∎
22email: olmi.luca@gmail.com
and
University of Puerto Rico, Rio Piedras Campus, Physics Dept., Box 23343, UPR station, San Juan, Puerto Rico, USA
33institutetext: P. Bolli 44institutetext: Istituto Nazionale di Astrofisica (INAF), Osservatorio Astrofisico di Arcetri, Largo E. Fermi 5, I-50125 Firenze, Italy
55institutetext: L. Cresci 66institutetext: Istituto Nazionale di Astrofisica (INAF), Osservatorio Astrofisico di Arcetri, Largo E. Fermi 5, I-50125 Firenze, Italy
77institutetext: Francesco D’Agostino 88institutetext: Università di Salerno, Via G. Paolo II 132, I-84084 Fisciano (SA), Italy
99institutetext: Massimo Migliozzi 1010institutetext: Università di Salerno, Via G. Paolo II 132, I-84084 Fisciano (SA), Italy
1111institutetext: Daniela Mugnai 1212institutetext: Consiglio Nazionale delle Ricerche (CNR), Istituto di Fisica Applicata Nello Carrara, Via Madonna del Piano 10, I-50019 Firenze, Italy
1313institutetext: Enzo Natale 1414institutetext: Istituto Nazionale di Astrofisica (INAF), Osservatorio Astrofisico di Arcetri, Largo E. Fermi 5, I-50125 Firenze, Italy
1515institutetext: Renzo Nesti 1616institutetext: Istituto Nazionale di Astrofisica (INAF), Osservatorio Astrofisico di Arcetri, Largo E. Fermi 5, I-50125 Firenze, Italy
1717institutetext: Dario Panella 1818institutetext: Istituto Nazionale di Astrofisica (INAF), Osservatorio Astrofisico di Arcetri, Largo E. Fermi 5, I-50125 Firenze, Italy
Lorenzo Stefani 1919institutetext: Consiglio Nazionale delle Ricerche (CNR), Istituto di Fisica Applicata Nello Carrara, Via Madonna del Piano 10, I-50019 Firenze, Italy
Laboratory measurements of super-resolving Toraldo pupils for radio astronomical applications
Abstract
The concept of super-resolution refers to various methods for improving the angular resolution of an optical imaging system beyond the classical diffraction limit. Although several techniques to narrow the central lobe of the illumination Point Spread Function have been developed in optical microscopy, most of these methods cannot be implemented on astronomical telescopes. A possible exception is represented by the variable transmittance filters, also known as “Toraldo Pupils” (TPs) since they were introduced for the first time by G. Toraldo di Francia in 1952 toraldo1952a . In the microwave range, the first successful laboratory test of TPs was performed in 2003 mugnai2003 . These first results suggested that TPs could represent a viable approach to achieve super-resolution in Radio Astronomy. We have therefore started a project devoted to a more exhaustive analysis of TPs, in order to assess their potential usefulness to achieve super-resolution on a radio telescope, as well as to determine their drawbacks. In the present work we report on the results of extensive microwave measurements, using TPs with different geometrical shapes, which confirm the correctness of the first experiments in 2003. We have also extended the original investigation to carry out full-wave electromagnetic numerical simulations and also to perform planar scanning of the near-field and transform the results into the far-field.
Keywords:
Angular resolution super-resolution techniques Toraldo pupils microwave measurements near-field1 Introduction
The concept of super-resolution refers to various methods for improving the angular resolution of an optical imaging system beyond the classical diffraction limit. In optical microscopy, several techniques have been successfully developed with the aim of narrowing the central lobe of the illumination Point Spread Function (PSF). These techniques either involve changing the fluorescence status of the specimen, or the specimen is imaged within a region having a radius much shorter than the illumination wavelength, thus exploiting the unique properties of the evanescent waves. Using electrically small artificial structures, negative refractive index (NRI) metamaterials (also known as negative index media, or NIM) provide a physical platform to controlling the properties of electromagnetic (EM) waves. One of the most striking properties of NRI materials is that a slab of metamaterial can be a “perfect lens” in which the evanescent waves, instead of decaying, are in fact enhanced through the slab and in theory it is thus capable of imaging infinite small features of targets zhang2008 .
However, few efforts have been made to overcome the diffraction limit of telescopes. This is mainly attributed to the fact that remote objects, like astronomical targets, are not easily accessible for artificial radiation manipulation and the great size of telescopes reduces the possibility of super-resolution optical elements composed of metamaterials. A concept that used a NRI lens positioned between the conventional reflector of a radio telescope and its focal plane to shape the PSF has been proposed may2004 but, to our knowledge, there are no published experimental measurements. A more exotic concept based on quantum cloning kellerer2014 has also been published, but its practical realization is yet to be proven.
In a classical filled-aperture telescope with diameter , and angular resolution , the purpose of a super-resolving optical device would be to increase the resolving power of the telescope without increasing its aperture. In fact, aperture synthesis telescopes can enhance the angular resolution beyond the limits of its individual filled-aperture telescopes, but at the cost of much increased complexity. References cagigal2004 and canales2004 review and discuss methods for designing super-resolving pupil masks that use variable transmittance pupils for optical telescopes. These pupils are attractive to design antennas and telescopes with resolution significantly better than the diffraction limit, , since their realization does not require significant modifications to the optical layout of the telescope or any new technological breakthrough.
The first time such pupils were discussed was at a lecture delivered by Toraldo di Francia at a colloquium on optics and microwaves in 1952 toraldo1952a . Toraldo di Francia suggested that the classical limit of optical resolution could be improved interposing a filter consisting of either infinitely narrow concentric rings or finite-width concentric annuli of different amplitude and phase transmittance in the entrance pupil of an optical system. These pupils are now also known as Toraldo pupils (TPs, hereafter) and are considered a special case of a the more general case of variable transmittance pupils. In fact, it can be easily shown that a TP consisting of infinitely narrow concentric rings, or continuous Toraldo pupil, is equivalent to a transmittance pupil with a complex illumination function (Olmi et al., in prep.). Many other super-resolving filters have since been proposed, but these methods offer little theoretical advantage over the original method proposed by Toraldo di Francia, as shown in Ref. cox1982 .
TPs have been widely analyzed in the context of microscopy neil2000 ; martinez2002 ; kim2012 , but so far they have never been designed for telescope or antenna applications. In fact, the first experimental studies in the microwave range of a TP were carried out in 2003 mugnai2003 and 2004 ranfagni2004 . These successful laboratory results later raised the interest in the potential application of TPs to microwave antennas and radio telescopes. In fact, given that discrete TPs (i.e., employing finite-width concentric coronae with different complex transmittance) for the microwave range are very easy to fabricate and relatively easy to model, we started a project devoted to a more careful analysis of TPs and how they could be implemented on a radio telescope.
During the first part of this work we have conducted extensive electromagnetic numerical simulations of TPs, using a commercial full-wave software tool, that have already been discussed elsewhere olmi2016 . We have used these simulations to study various EM effects that can mask and/or modify the performance of the pupils and to analyze the near-field (NF) as well as the far-field (FF) response. We then used these EM simulations to prepare more comprehensive laboratory testing, and the purpose of this paper is thus to discuss a series of experimental tests conducted at 20 GHz that significantly extend and improve previous laboratory investigations mugnai2003 ; ranfagni2004 . Our results again confirm Toraldo di Francia’s model and also suggest that TPs should be investigated as a potential tool to achieve super-resolution on a radio telescope.
The outline of the paper is as follows. In Sect. 2 we give an overview of the basic properties of TPs. In Sect. 3 we summarize the EM simulations which have been described elsewhere olmi2016 and also discuss some additional EM modeling specific to our laboratory tests. In Section 4 we describe the laboratory setup and procedures used to perform our measurements and the results obtained in the NF using two different types of TP. Therefore, in Sect. 5 we describe how the NF measurements were converted into the FF. Finally, in Sect. 6 we draw our conclusions.
2 TORALDO PUPILS
2.1 Analytical description
As we earlier mentioned, Toraldo di Francia introduced for the first time the concept of variable transmittance pupils in 1952 toraldo1952a ; toraldo1952b , and an analytical description of TPs can be found in several references born1999 ; cox1982 ; mugnai2003 . For the convenience of the reader we briefly review the theory here. In Toraldo di Francia’s model several approximations are implicitly assumed, thus reducing the problem of the scattered fields to a scalar diffraction problem in the case of linearly polarized radiation incident on the aperture (see, e.g., Chapter 5.14 of Ref. silver ). A full-wave discussion of the scattered fields from a TP is beyond the scopes of this work, and therefore we will adopt the same approximations as in Toraldo di Francia’s original version. However, for the near- to far-field transformation described in Section 5 we will adopt the full-wave approach both in our laboratory measurements and in the EM simulations.
Let us then consider a circular pupil of diameter and divide it into discrete, concentric circular coronae by means of circumferences with diameters , , , , where , , is a succession of numbers in increasing order, with and . In Toraldo di Francia’s original version, each corona is either perfectly transparent or provides a phase inversion (i.e., a phase change, see below), and is illuminated by a plane wave (i.e., with uniform phase over the pupil). By setting , where is the angle of diffraction measured with respect to the optical axis and is the wavelength, it can be shown that the total amplitude (in the FF), , diffracted by the composite TP is given by:
| (1) |
where is a constant that is proportional to the amplitude illuminating each corona, and is the Bessel function of the first order.
Once the partition of the pupil into circular coronae is established, we can impose independent conditions on , thus obtaining a system of equations from which we can determine the coefficients . These equations can be obtained, for example, by where () represent the zeros of the diffracted amplitude. In particular, by setting the position of the first zero the user establishes the width of the main lobe and thus the extent of the super-resolution effect.
Note that the coefficients can also have negative values, in which case they represent a phase-inversion of the wave propagating through the pupil. In fact, in this work we are only concerned with the simplest possible pupil, i.e., composed of discrete circular coronae that do or do not introduce a phase-inversion. A description of continuous phase filters can be found elsewhere dejuana2003 , as well as their application to ground-based telescopes cagigal2004 , while the precise relation with discrete Toraldo pupils will be discussed in a forthcoming paper (Olmi et al., in prep.) . Note that in order to obtain the phase-inversion, , the optical path excess (with respect to the wave propagating through air) must be , where is the physical thickness of the dielectric material and is the refraction index. If and then .
2.2 Illumination of the pupil
Solving the set of equations allows to determine the coefficients and thus, given that they are proportional to the amplitude illuminating each corona, it also determines the type of amplitude apodization required by a specific TP. In general, if no a priori constraint on the illumination is set, the resulting apodization may be quite complex, and while at visible wavelengths the required amplitude distribution could in principle be obtained using the appropriate neutral filters, in the microwave range this technique is not easily implemented. For example, in Ref. olmi2016 it is shown that for the simple case of a 3-coronae TP, its geometry can be chosen so that the required intensity illumination at the center of each corona can be adequately fit by a Gaussian beam. At microwave wavelengths a Gaussian illumination can be easily obtained using, for example, a rectangular feedhorn but a Gaussian beam cannot provide a uniform phase over the pupil, which is one of the optical conditions required by a TP. The pupil could be located in the FF of the Gaussian beam source, where the spherical wavefront can be approximated as a plane wave over the extent of the pupil, thus satisfying the uniform phase condition but without the required amplitude apodization.
|
Since it appears very difficult to implement amplitude apodization and uniform phase simultaneously over the pupil it is of interest to analyze how the output amplitude from a TP would change if one of these conditions is not met. For example, if the phase inversion, corresponding to negative coefficients, is not applied then no super-resolution effect is achieved and the shape of the PSF is basically unchanged. Instead, the condition about the amplitude apodization can be relaxed, though at the cost of a mild reduction in the super-resolution effect and modified sidelobes.
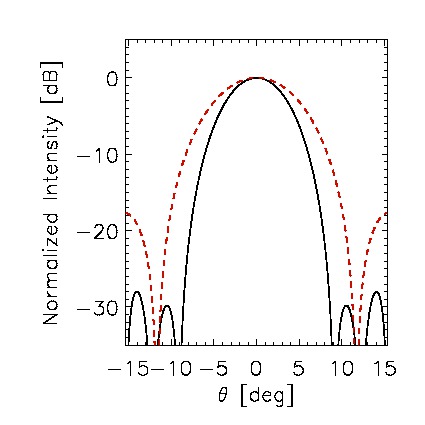
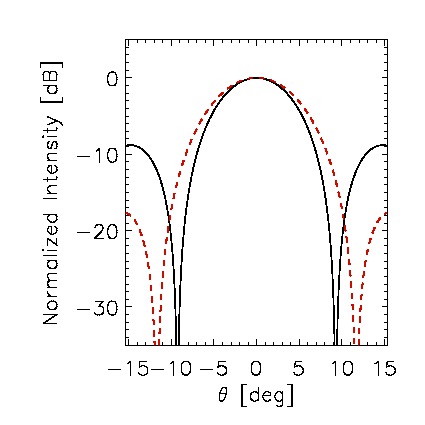
The simple case of a 3-coronae TP has been discussed elsewhere olmi2016 , and we thus show the equivalent effects for the case of a 4-coronae TP in Fig. 1. For this specific example we have selected the coefficients as . Given that an open pupil with the same diameter has its first zero at (corresponding to ) we set the amplitude at the values of , thus narrowing the main lobe, and we also set the maximum value of at . The resulting (unnormalized) coefficients are . The left panel of Fig. 1 shows the calculated diffracted amplitude by the TP assuming the correct amplitude apodization and phase inversion. It is customary cox1982 to define the resolution gain111Not to be confused with the antenna gain., , as the ratio of the radius of the first zero of the Airy distribution to that of the super-resolving diffraction pattern. Here we replace the radius of the first zero with the full width at half-maximum (FWHM, corresponding to the width at dB with respect to the peak value) of the PSF to measure , which in this case is . In the right panel of Fig. 1 we show the diffracted amplitude with no amplitude apodization applied, but still with the correct phase relations. The relative intensity, number and position of the sidelobes have changed and the super-resolution effect is somewhat lower, with .
This example shows that, although the super-resolution effect is still present, the performance of a TP is different if the correct apodization condition is not applied, which makes these pupils difficult to study in the microwave range with EM numerical simulations (see Sect. 3). Likewise, testing TPs in the laboratory would in principle require to design a suitable method to implement both amplitude apodization and phase inversions. However, in Sect. 4 we show that successful results can also be obtained when amplitude apodization is not present. These problems could be partly resolved with the use of phase-only masks dejuana2003 ; liu2008 which will also be discussed in a future work (Olmi et al., in prep.).
3 ELECTROMAGNETIC SIMULATIONS
3.1 Summary of previous results
Any measurement performed in the laboratory cannot fully satisfy all of the optically ideal conditions which are assumed for a TP, and thus a way to validate and test the performance of a TP under less than ideal laboratory conditions is required. The method used must also be able to address how the theoretical performance of a TP can be masked or altered by various optical (mostly diffractive) effects. Therefore, we carried out an extensive series of EM numerical simulations using the commercial software FEKO222http://www.altairhyperworks.com/product/FEKO, a comprehensive EM simulation software tool for the electromagnetic field analysis of 3D structures.
After a few attempts with frequencies, , of 10 and 50 GHz, we decided to perform the bulk of the EM simulations, followed by laboratory measurements, at GHz. At lower frequencies the computing time would be much lower, but the size (and separations) of the optical elements in units of wavelengths would be uncomfortably large for our expected experimental setup. At higher frequencies the situation pretty much reverses, with far too long computing times though with the advantage of reasonably sized microwave components. We found that 20 GHz represents a good trade-off between these opposite requirements.
During the first part of this work our EM simulations had the main purpose of generating a FEKO model which would represent an optical configuration as close as possible to the ideal system described in Sect. 2, thus trying to simulate the performance predicted by Eq. (1). These numerical simulations have already been discussed in a previous work olmi2016 , and thus here we just present a brief summary of the main results:
-
1.
Two different sources have been tested: plane-wave and Gaussian-beam illumination. The use of plane-waves requires a special technique to simulate an infinite ground plane where the pupil is realized, in order to avoid strong diffraction effects from the edges of a finite surface.
-
2.
The Gaussian beam produced by a rectangular feedhorn must illuminate the pupil in the FF to ensure the uniform phase condition. The tapered illumination of the feedhorn can also be used with a finite ground screen.
-
3.
Both NF and FF distributions have been analyzed. However, the analytical model of a TP discussed in Sect. 2.1 can only be compared with the FF numerical results.
-
4.
The simulated FFs confirm the super-resolution effect, even with no amplitude apodization. They also show that TPs with different numbers of coronae can be used to achieve a trade-off between resolution gain, , strength and position of the side lobes, and overall efficiency, measured as the decrease of the on-axis intensity compared to the open pupil.
Our initial EM simulations were thus successful, and helped us to analyze both the super-resolution effect using various geometrical configurations, and also other diffraction effects that could mask the expected narrowing of the PSF. Although simulating the FF is in general easier and less time-consuming than computing the NF, we were expecting to perform our experimental measurements in the NF (see Sect. 4.1). Therefore, we also carried out a number of EM simulations of the NF that were more closely reproducing the laboratory conditions, which we describe in the next section.
 |
3.2 Numerical simulations for S-parameters
One of the main goals of this work was to compare our experimental measurements in the NF with the expected results from our EM simulations. However, in this respect the main limitation of the EM simulations summarized above and discussed in Ref. olmi2016 is that they used an incident plane wave as the illuminating source. Furthermore, these simulations sampled the NF point-by-point, without taking into account the finite spatial response of the NF probe used in the actual measurements. Hence, the only viable option to perform a more reliable comparison between the measured and simulated diffraction patterns in the NF was to include the NF probe as well as the feedhorn in the FEKO model.
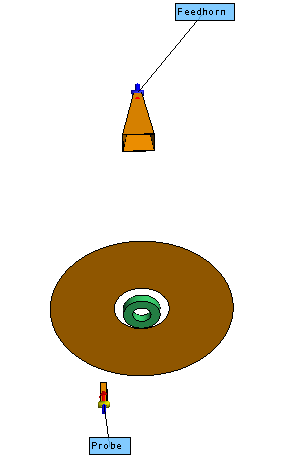
Therefore, we built a FEKO model specific for the NF measurements, that included both the feedhorn as the launcher and the probe after the pupil to sample the NF. Figure 2 shows our model where the feedhorn is visible behind the three-coronae pupil and the NF probe can be seen in front of the screen, in an off-axis position. In this case, since the field detection is done only through the excitation of the waveguide, the EM simulation returns the values of the scattering parameters, or -parameters, which measure the reflection and transmission coefficients of a 2-port device, such as a Vector Network Analyzer (VNA). During this simulation, the distances of the feedhorn and the probe to the pupil are held fixed, while the probe is moved perpendicular to the optical axis at regular steps. The forward and reverse transmission coefficients, and , are calculated, and once they are normalized they can be plotted as a function of the scanning position to be compared with the measured normalized NF diffraction pattern. This comparison will be discussed later in Sect. 4.2.
During the numerical simulations we found that diffraction by the edges of the disk where the circular aperture is realized could cause anomalous amplitudes along the optical axis. Since this effect is not observable off-axis, we think that this may be a consequence of the circular symmetry of the system causing the diffracted waves from the disk edge to interfere on the optical axis. This effect is geometry-dependent, and thus we chose the radius of the disk and the distance of the probe from the disk so that we did not detect this effect.
4 EXPERIMENTAL RESULTS
4.1 Preliminary tests
Our experimental measurements had two main goals: (a) detect and quantify the super-resolution effect with at least two TPs having different geometrical shapes; and, (b) evaluate and possibly reduce some of the effects that can mask and/or alter the super-resolution effect. An additional goal consisted in the determination of the FF patterns from NF measurements. In fact, for a circular aperture 9 cm in diameter, such as the one used in our tests, the Fraunhofer distance, , is about 1 m. We therefore decided to perform NF measurements instead of FF measurements for several reasons: (i) the Fraunhofer distance is of the same order of magnitude as the length of the anechoic chamber (about 7 m); (ii) FF scanning techniques would require more complex and expensive mechanical and microwave equipment, as well as measuring methods; (iii) our preliminary tests indicated that we did not have enough sensitivity to make measurements of the diffracted FF at distances of a few meters; (iv) the FF would be severely affected by diffraction effects caused by the ground screen supporting the TP, unless a much larger screen was adopted.
We note that these requirements are specific to our laboratory setup. On a telescope the TP, like any other optical device designed to modify the incident plane wavefront, should ideally operate at the entrance pupil of the telescope, i.e., the primary mirror. For antennas and telescopes where this is not possible, an image of the entrance pupil can be used to place a transmittance filter olmi2017 .
4.1.1 Measurement setup
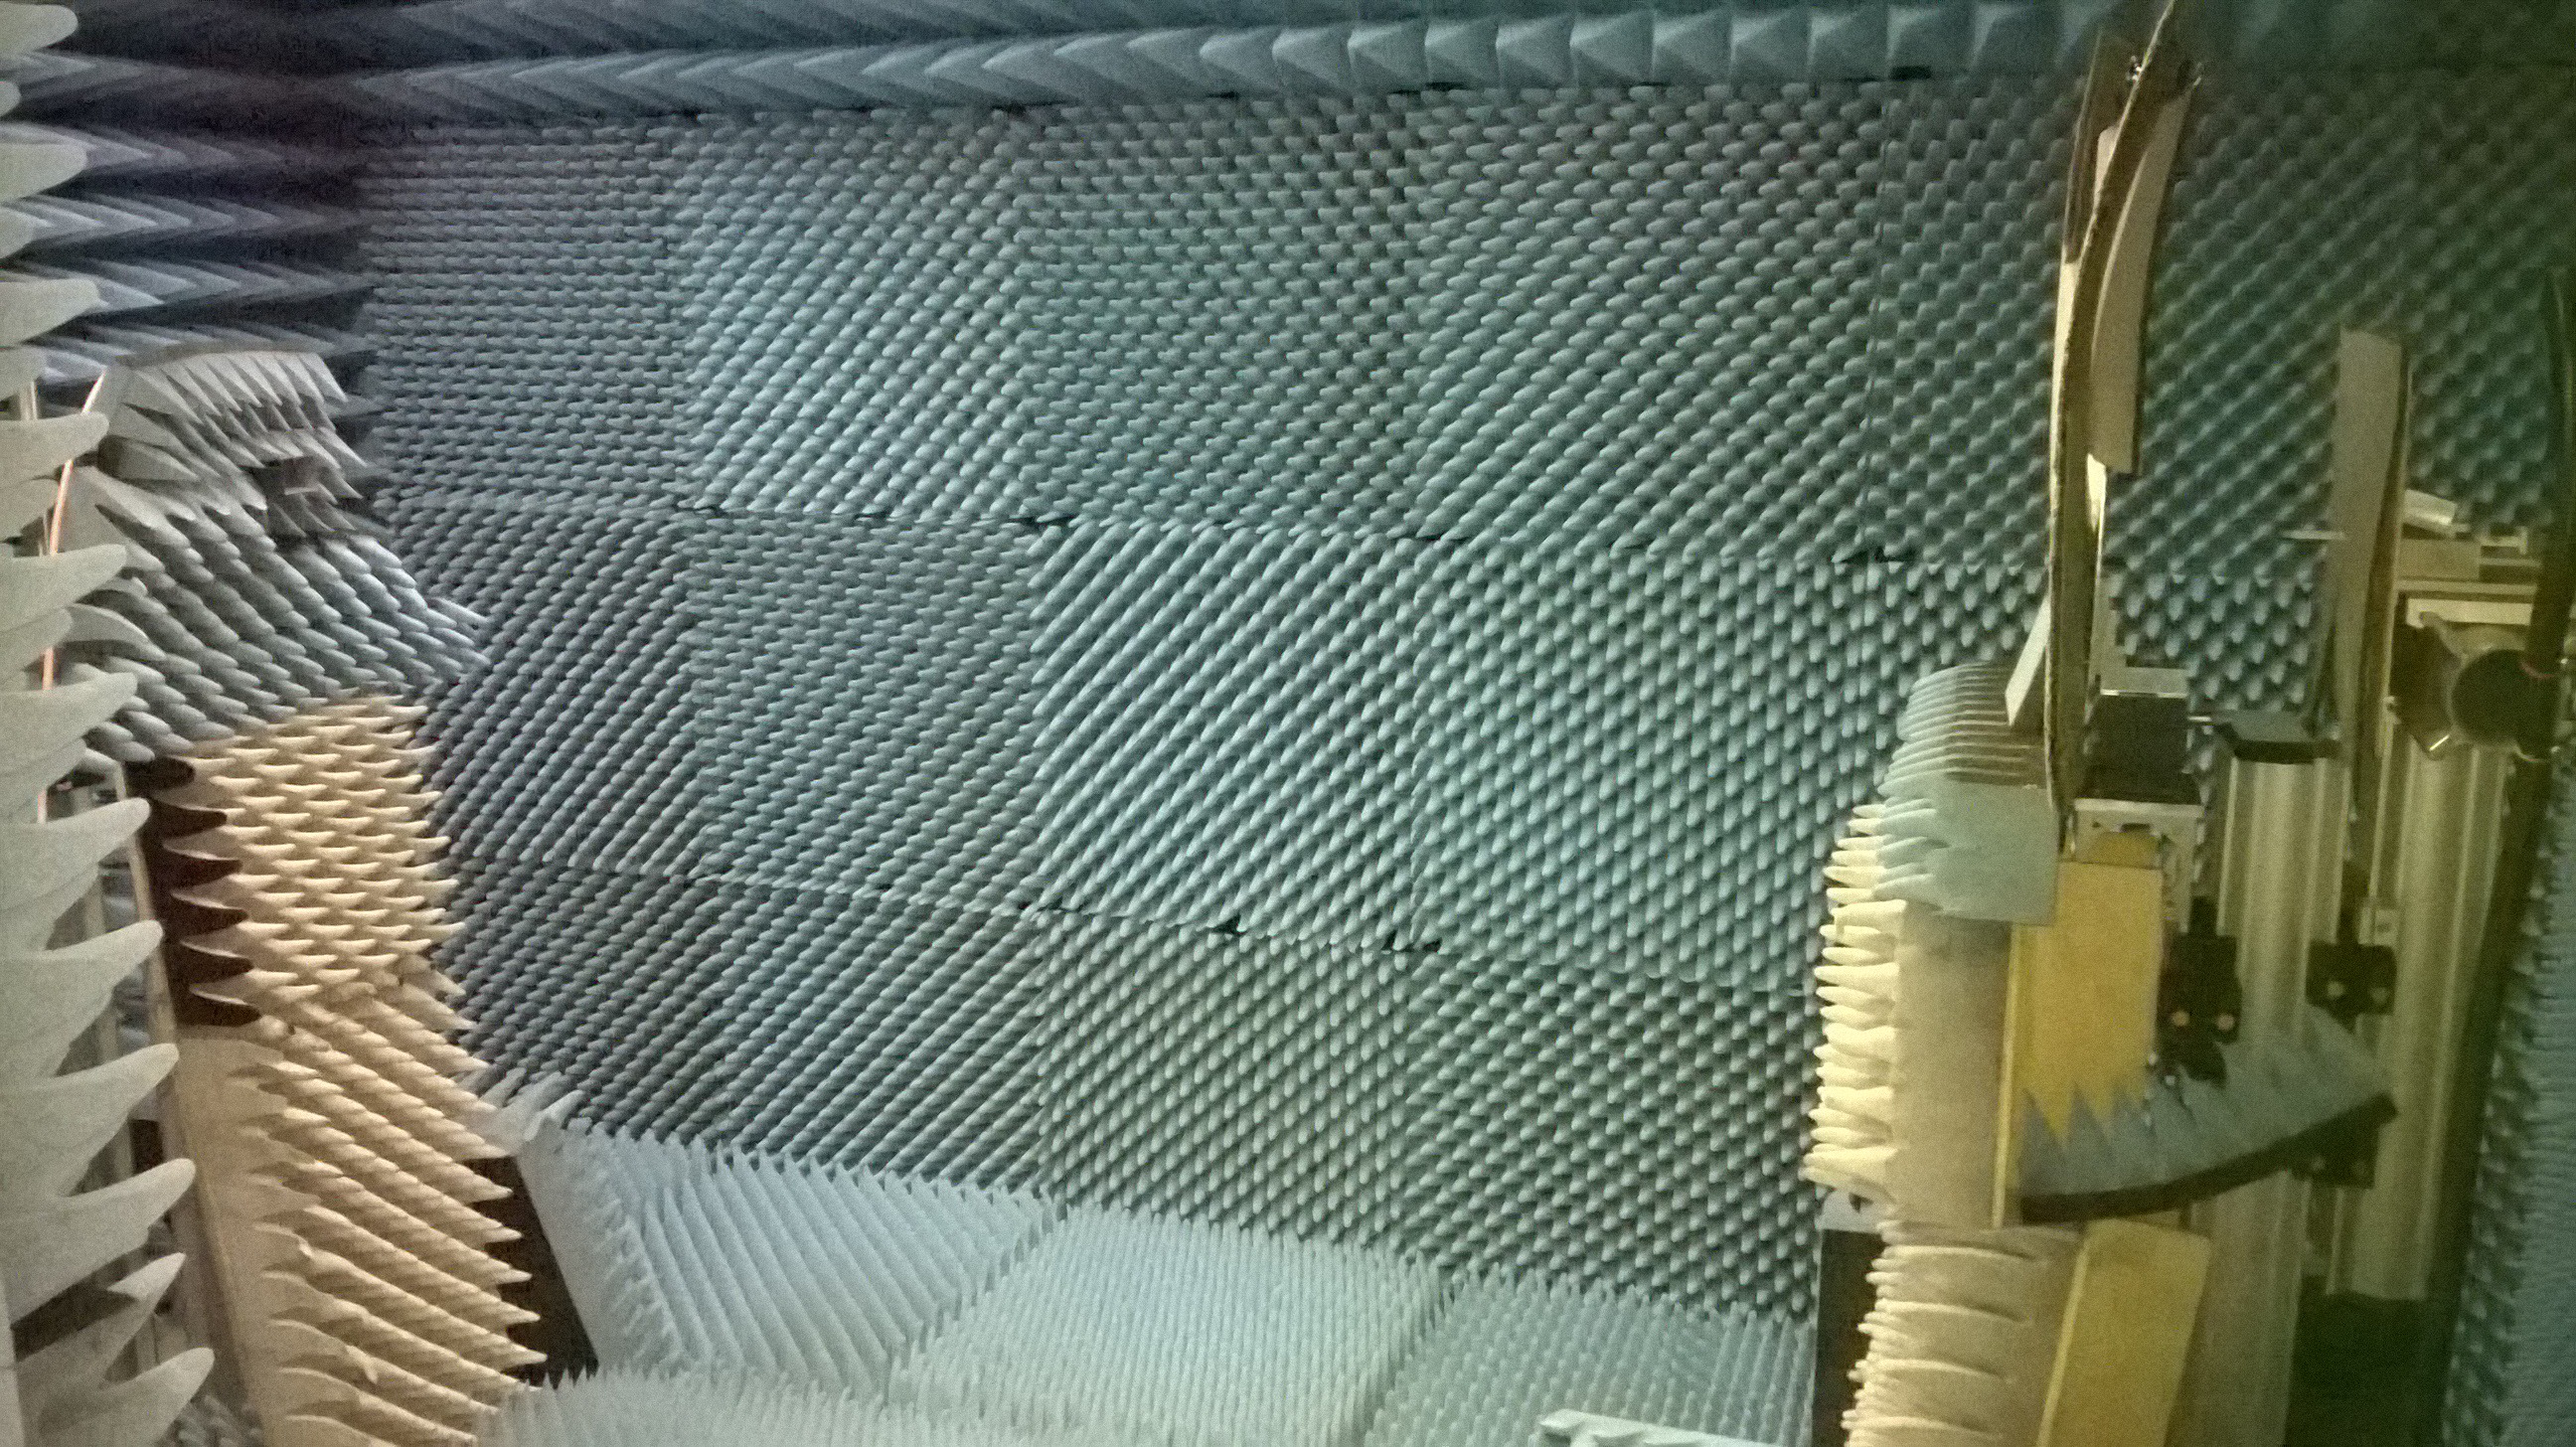
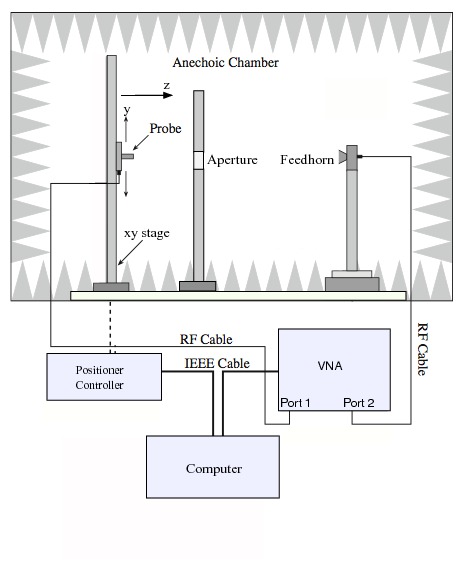
All microwave components were mounted on vertical supports that allowed to raise the optical axis about 1.5 m above the ground, in order to minimize the effects of reflections and multiple scatterings from the ground and the optical bench, though covered with microwave absorbers. The optical bench, 2.5 m long (see Fig. 3) allowed all vertical supports to move along the direction of propagation, which we will indicate as the -axis.
|
All measurements were performed with a VNA (Anritsu 37277C) recording both amplitude and phase. Coaxial cables connected the VNA to the launcher, a rectangular feedhorn having a mouth cm in size, while the waveguide had dimensions cm with a total length of 11 cm. The horn had a taper of dB at an angle of deg (FWHM deg) with respect to the optical axis, and a gain of dB. The NF probe consisted of a section, 18 cm in length, of an open-ended waveguide WR42 with smooth edges. Both the feedhorn and the probe were aligned so that their -field was directed vertically, or along the -axis, according to Fig. 4. The probe was mounted on a manual translational stage to scan the NF on an axis perpendicular to the direction of propagation (see Fig. 3). In between the feedhorn and the probe was mounted an assembly supporting a metal ground screen with a circular aperture which allowed to mount and remove the TPs. This assembly was covered by thin ( cm thick) planar microwave absorbers on the side facing the feedhorn. A schematics of the test set-up is shown in Fig. 4.
 |
After warm-up, both phase and amplitude measured with the VNA remained quite stable with peak-to-peak variations dB for the amplitude and deg for the phase. The feedhorn and the probe were first aligned using a HeNe laser positioned behind the horn. The circular aperture with the TP was then added to the optical bench and aligned as well. The coplanarity of the mouth of the horn and the plane of the circular aperture was checked using a retroreflector.
4.1.2 Noise measurements
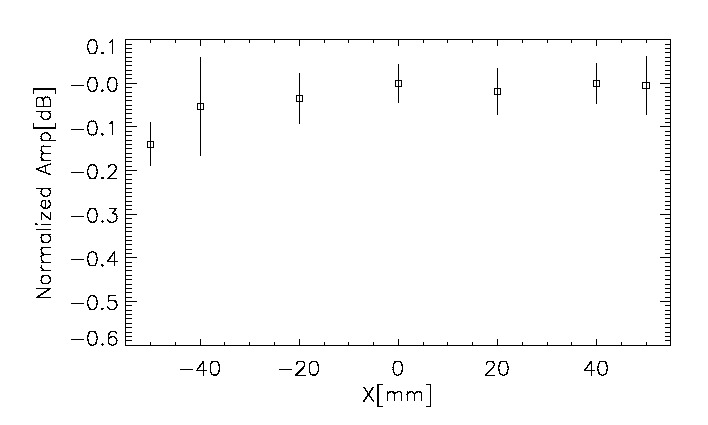
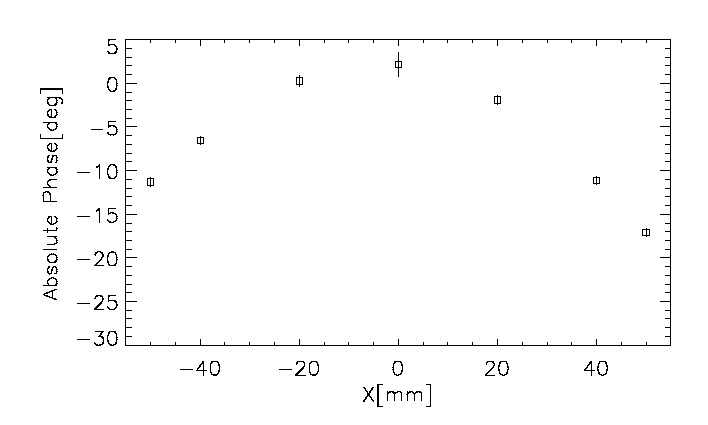
After the initial setup, we proceeded to measure the RF alignment and the noise level, both in amplitude and phase. We carried out these tests with just the launcher and the probe. The probe was decentered manually to scan the field from -5 to +5cm in the horizontal direction, , perpendicular to the optical axis, . The horizontal scan was repeated five different times, and the mean and standard deviation of both amplitude and phase were estimated for each probe position (see Fig. 5). The amplitude is quite uniform along , with peak-to-peak variations of less than 0.15 dB.
The power pattern of the feedhorn is expected to decrease as , where represents the on-axis power level, is the angle of observation measured with respect to the optical axis and . Thus, the expected power (or amplitude) variation at cm is dB, and we note that the observed amplitude variation along the -axis in the top panel of Fig. 5 is well within the error bars of the single measurement. These non-repeatable errors are due to various sources of scattering within the anechoic chamber which limit our ability to measure amplitude variations dB. Further tests have shown that we can appreciate amplitude variations (dB) along the scan axis if the separation between the feedhorn and the probe is m. However, the bottom panel of Fig. 5 shows that we can measure phase variations with greater accuracy. At a distance of m the spherical wavefront propagating from the feedhorn should cause a phase variation of about 11 deg at cm, and this is approximately what we see in Fig. 5. The slightly different phase variation at cm and cm is a measure of the RF misalignment.
|
|
4.2 Linear scanning in the near-field
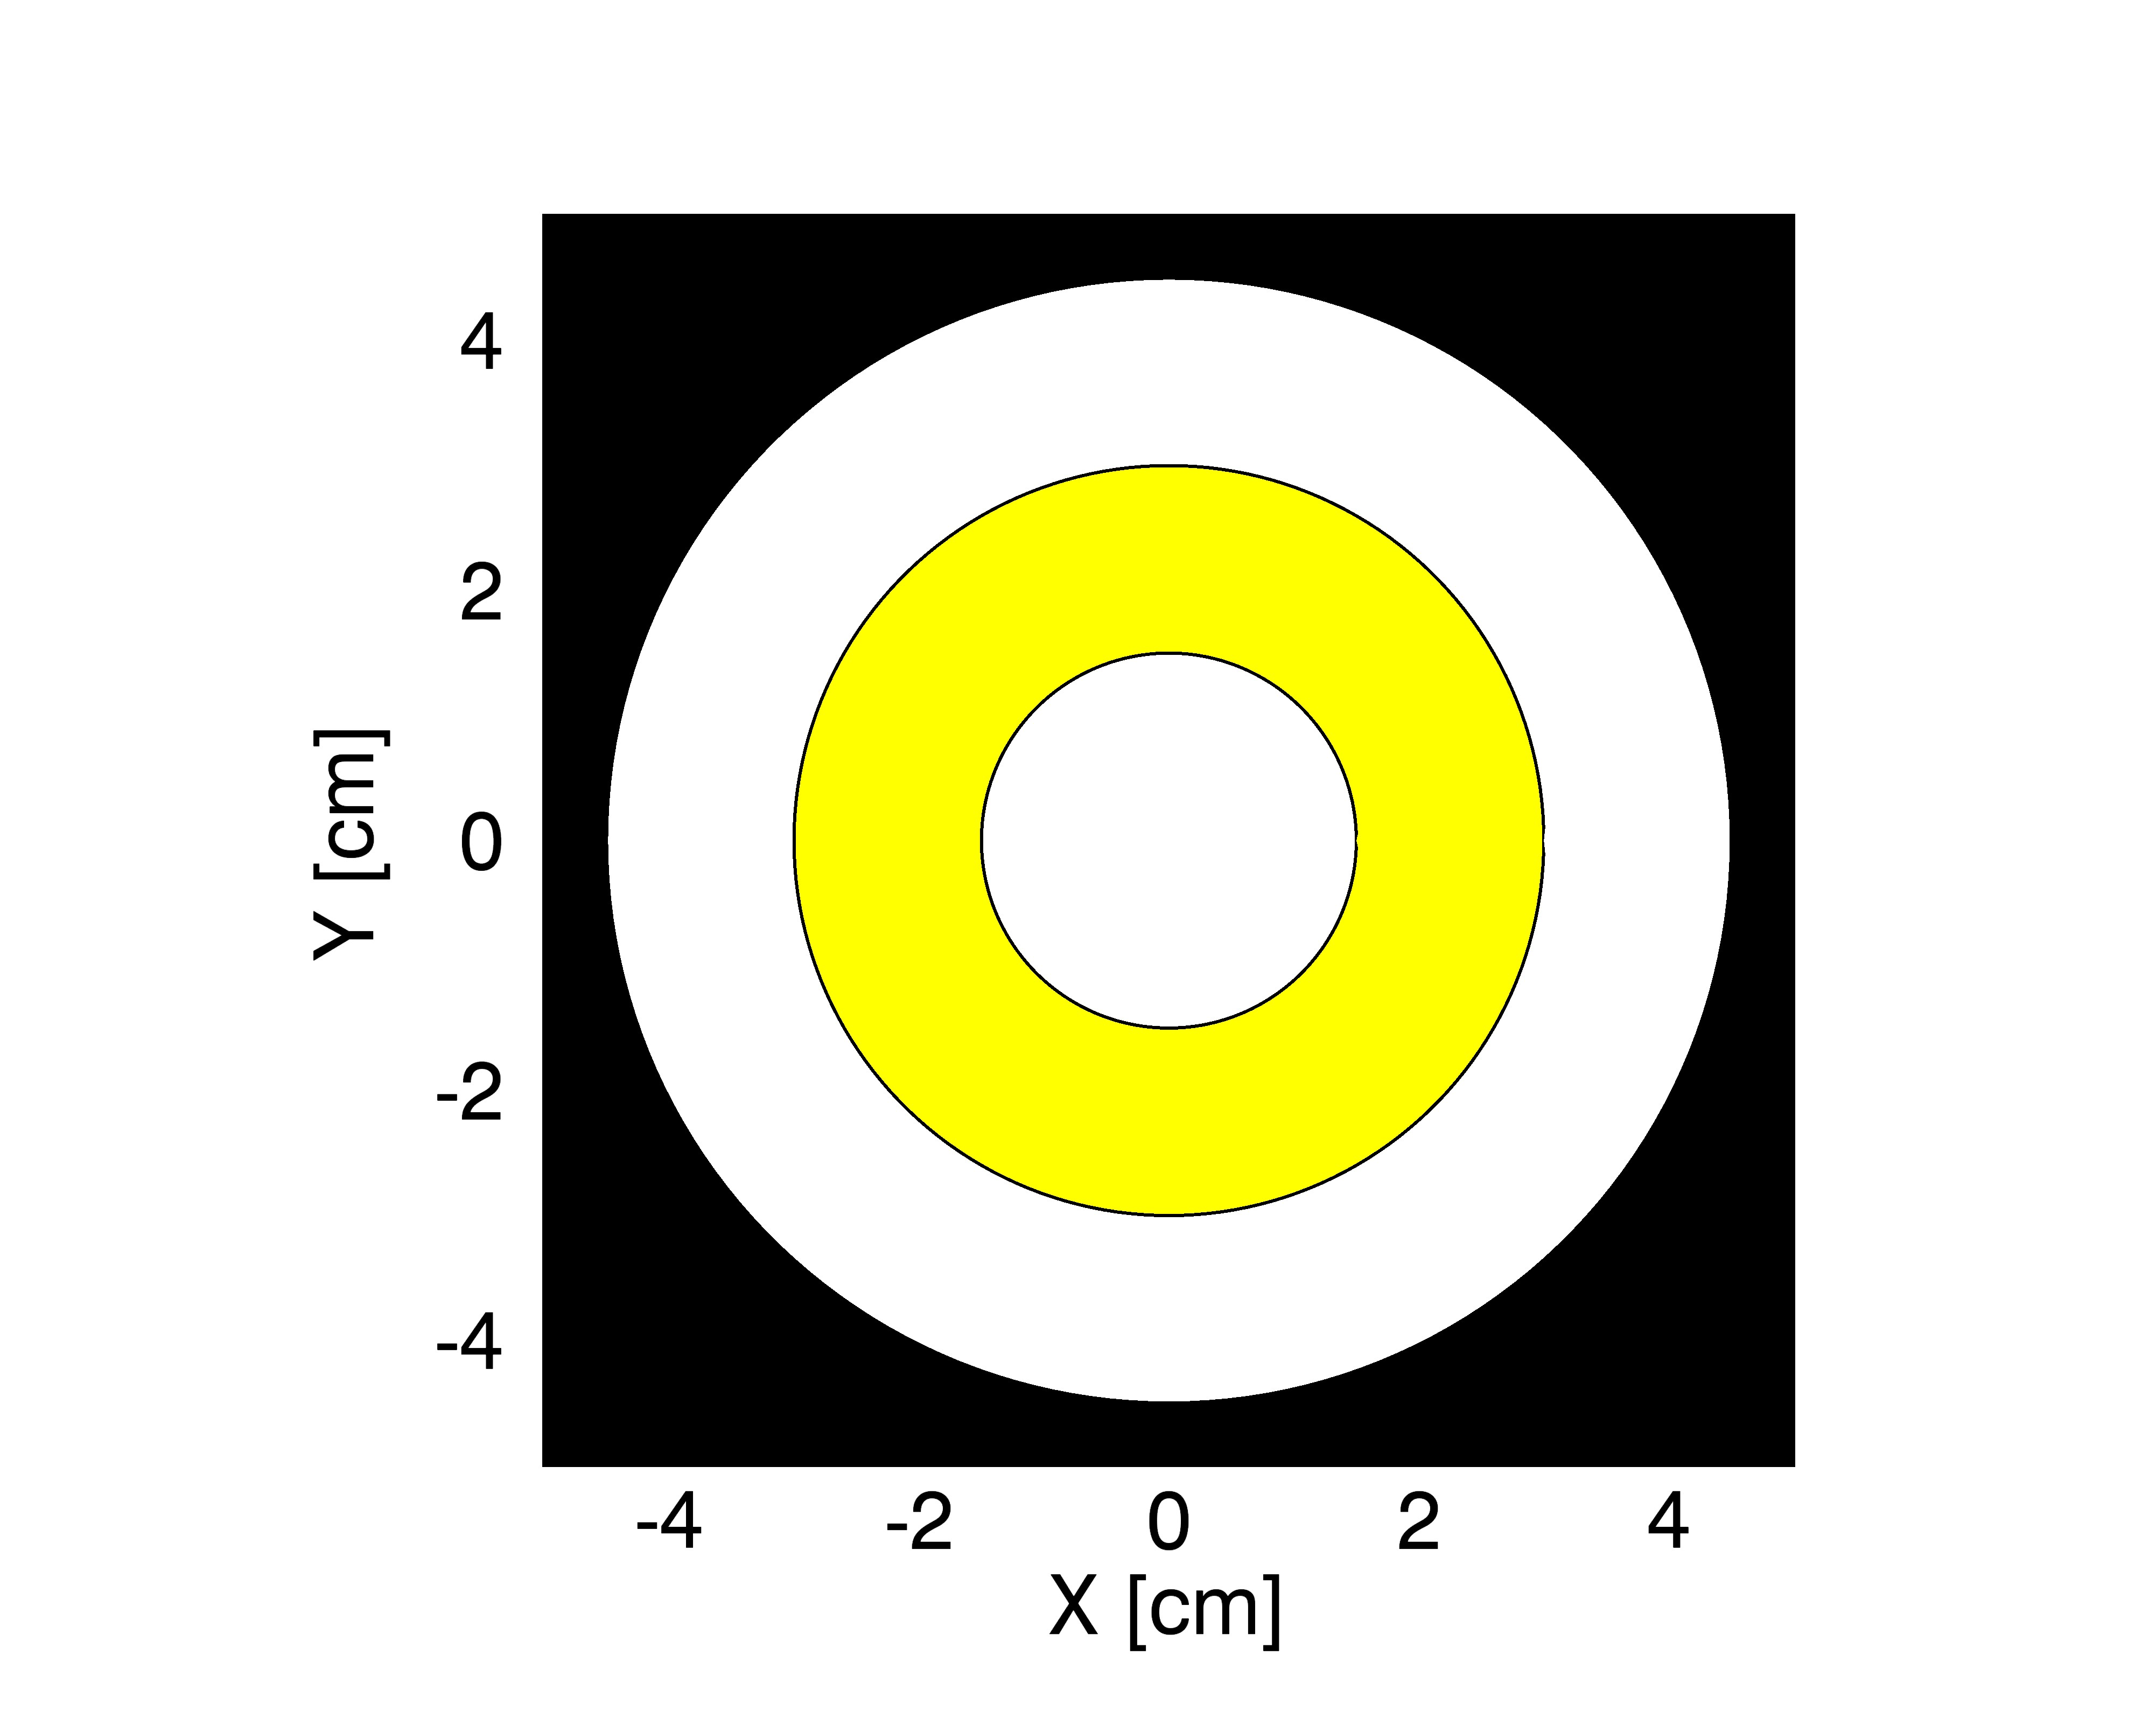
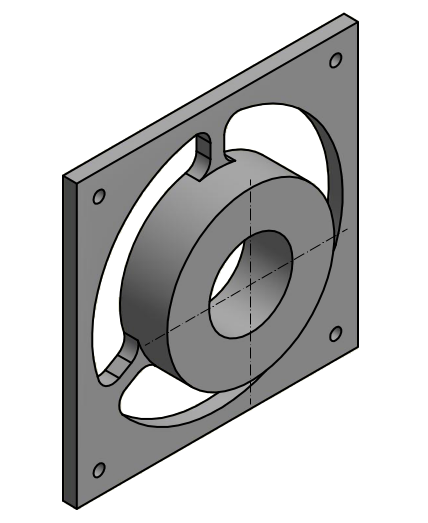
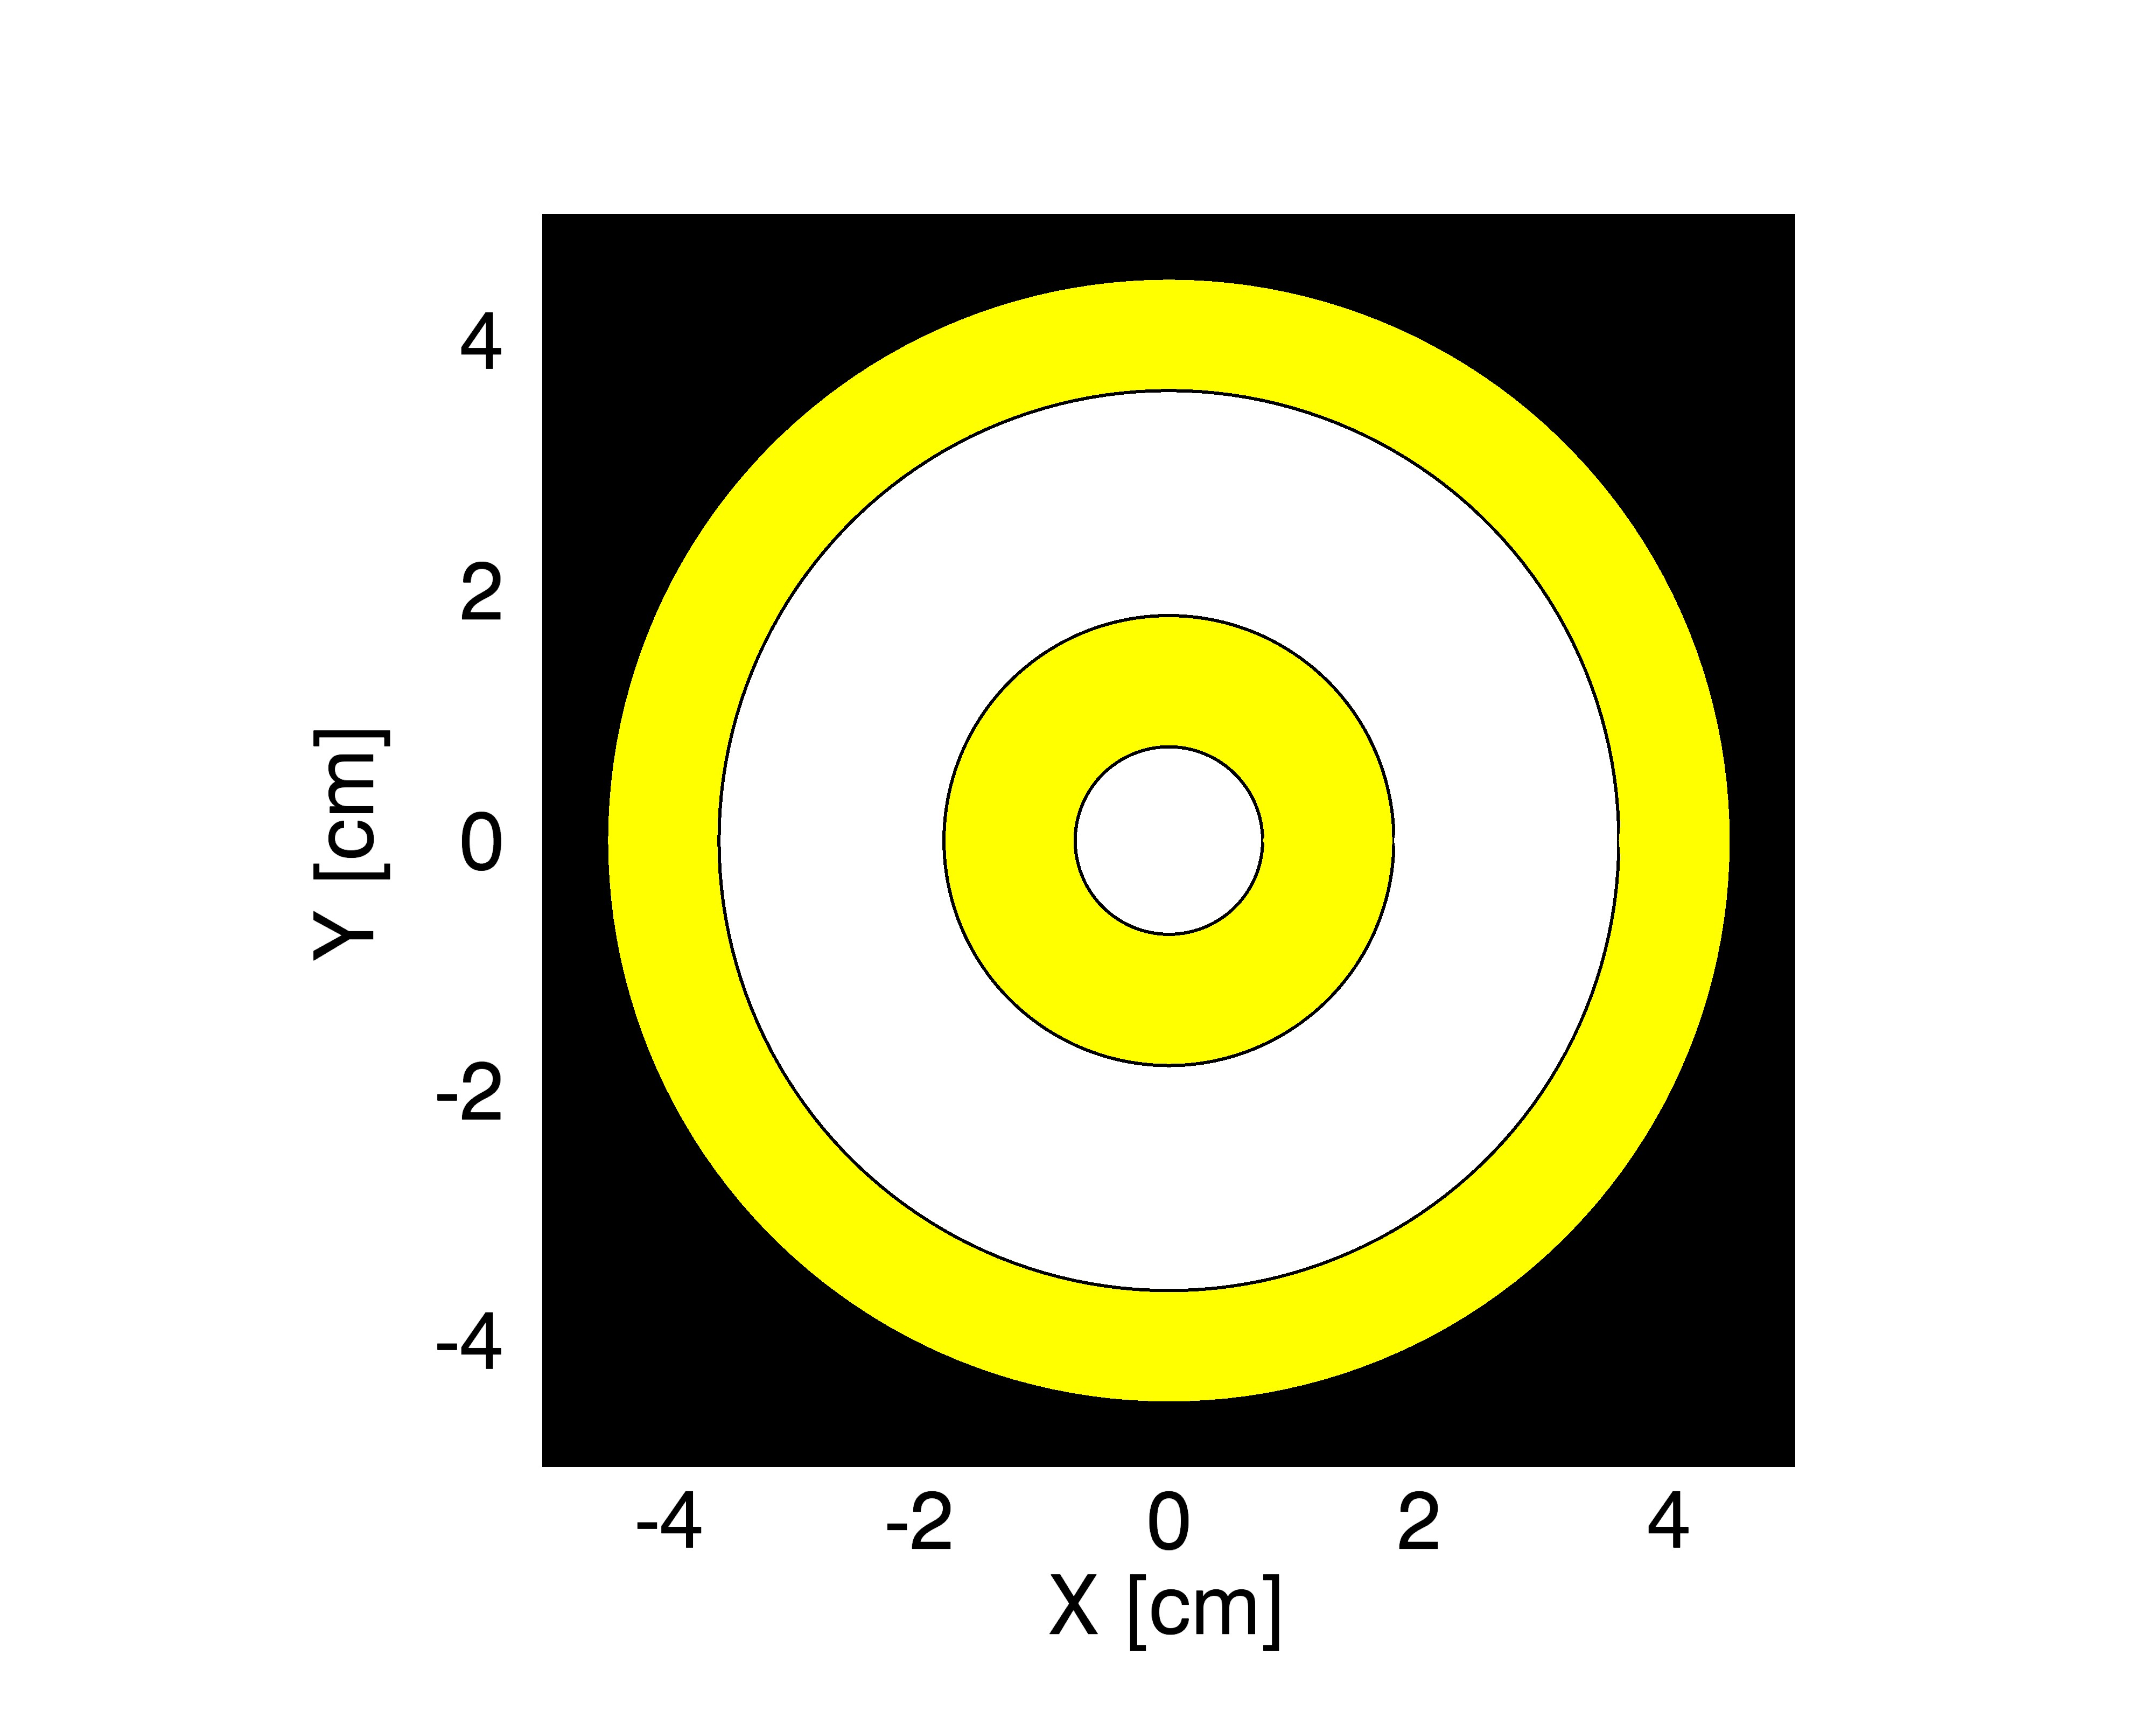
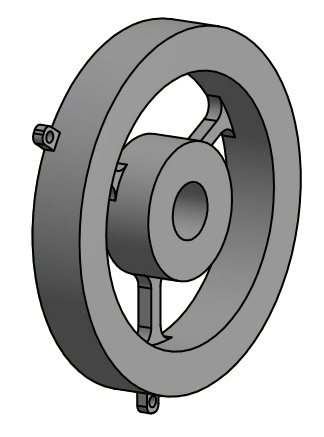
After the preliminary tests were completed we proceeded with the measurements of the diffracted fields by the open circular pupil and the same three- and four-coronae TPs described in Ref. olmi2016 . Figure 6 shows the layout of these TPs, which were fabricated from low-loss polyethylene, having a relative dielectric constant and a loss tangent of goldsmith1998 .
|
|
A scan along the -direction was first performed for the open pupil, roughly between cm and cm, with the probe positioned at different distances from the screen. In the top panel of Fig. 7 we show an example of our results obtained using the three-coronae TP with a distance between the launcher and the screen of 1.9 m, while the separation between the screen and the probe was 18 cm. Even a simple linear scan like this clearly shows that the FWHM of the amplitude distribution generated by the TP is smaller than that of an open pupil with the same diameter, and thus we detect the super-resolution effect, at least in the NF. Later we will show that this relation also holds in the FF. We note that the open pupil and TP fields have been measured more extensively on the negative -direction. This extended scan was intended to record the sidelobes level and also to check the measurement setup with low signal levels. Several combinations of distance between the launcher and the screen, and separation between the screen and the probe were experimented. The bottom panel of Fig. 7 was in fact obtained using a different set of parameters.
|

|
The top-panel of Fig. 7 also shows the radiation diagram obtained with FEKO using the -parameters method described in Sect. 3.2 (the few points shown are due to the long time required by each separate simulation). We note that the simulated pattern has a close correspondence with the measured signal, particularly regarding the positions of the nulls and the first sidelobes. Both diffraction patterns are sparsely sampled and thus part of the discrepancies between the two curves is likely a result of the insufficient sampling. It should also be noted that the radiation diagram produced by the TP in Fig. 7 also includes the effects of the three small rods that are used to hold the dielectric cylinder of the TP connected to the external rim, as shown in the right panel of Fig. 6. However, we have performed FEKO simulations including the rods and we have verified that the diffraction effects introduced by these supports are negligible.
|
The bottom panel of Fig. 7 shows the radiation diagram obtained with the four-coronae TP. Since in this case the amplitude generated by the TP is normalized to the peak value of the open pupil, one can appreciate the general decrease of the signal level in the NF when the TP is mounted on the circular aperture. While the central lobe shows the super-resolution effect, the relative level of the sidelobes is much higher compared to the three-coronae TP. Note that the individual FWHM cannot be compared between the top and the bottom panels because the separations between launcher, pupils and probe were different.
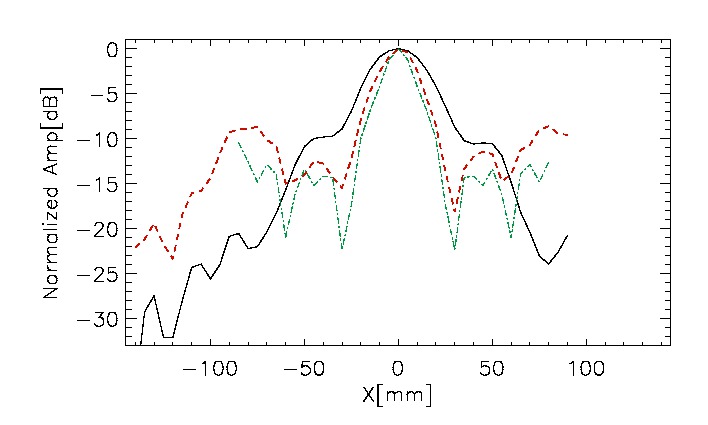
Finally, a critical question to be analyzed is the frequency response of a TP, which is important in the perspective of its possible use on a radio telescope. A wide-bandwidth analysis of the TPs was out of the scopes of this work. However, we have performed a simple test by measuring the response of the three-coronae TP at three separate frequencies, specifically 19.84, 20.0 and 20.24 GHz, thus spanning a 400 MHz range. The results are shown in Fig. 8, where all curves are normalized with respect to the peak value of the open pupil so the actual amplitude decrease when using the TP is visible. The launcher and probe distance from the pupil plane were slightly different from the example discussed above, but this has no effect on the present discussion. We note that the main lobes at the three frequencies are quite similar, while most of the differences are limited to the sidelobes. The sampling interval along the scan direction was larger compared to the previous example, and this may also contribute to some of the discrepancies, especially at low signal levels. These measurements suggest that the three-coronae TP has a usable bandwidth MHz. Given that most K-band receivers on currently operating radio telescopes have instantaneous bandwidths GHz, a TP device might be partially limiting the available bandwidth.
|
4.3 Planar scanning setup
After the preliminary measurements were completed, the NF probe was mounted on a motorized, two axes translation stage, which could be remotely controlled to move the probe at the required position in the plane, thus performing a planar scanning of the NF with uniform sampling step (plane-rectangular scanning). Likewise, the feedhorn was mounted on a rotational stage, a feature that was required to precisely rotate the horn and measure the cross-polarization.
In preparation for the measurements, the RF absorbing panels were appropriately positioned all around the metallic structure of the 2D positioner. The usual optical and RF alignment were then performed. Both VNA and translation stage were remotely controlled through LabVIEW333http://www.ni.com/labview/. The operator would specify the - size and step of the planar scanning to be performed by the probe in the NF and the control software would then move the probe at each position in the grid, where it would stop while the VNA measurement is acquired, and then would move to the next position. A typical raster map with points and a 0.5 cm sampling interval would take hr to complete. The complex voltage samples are stored together with their positions and will later be used for the NF-to-FF conversion (see Sect. 5).
4.4 Measurements results
|
|
Raster maps were performed with the open pupil and with both three- and four-coronae TPs. If the incident field over the aperture is linearly polarized (see Section 4.1.1), then in the scalar diffraction approximation (see Section 2.1) we need to consider only the scattered fields along the polarization direction silver . However, because we also required to perform the NF-to-FF transformation (see Sect. 5), both our measurements and EM simulations had to determine the copolar and cross-polar444Although the copolar and cross-polar terms are generally referred in the literature to the FF, here we will use them to indicate the vertical, -component, and horizontal, -component, of the NF. radiation patterns of the scattered fields. In addition, the comparison of copolar and cross-polar components also had an interest in preparation to a potential application of TPs with the receiver system of a radio telescope.
The cross-polar pattern was recorded after rotating the feedhorn by 90∘. The major challenge for the measurement of the cross-polar pattern was clearly the low-level of the signal, since we were approaching the expected dynamic range limit of our experimental setup. For this reason we selected the distance between the feedhorn and the pupil, and the distance between the pupil and the probe to achieve an acceptable trade-off in terms of planarity of the incident wave and signal levels, that would allow the cross-polarization to be measured. We performed planar scannings using various distances between the probe and the pupil. However, in the end we selected a separation of 10 cm because larger separations would also lead to a larger truncation error (see Sect. 5).
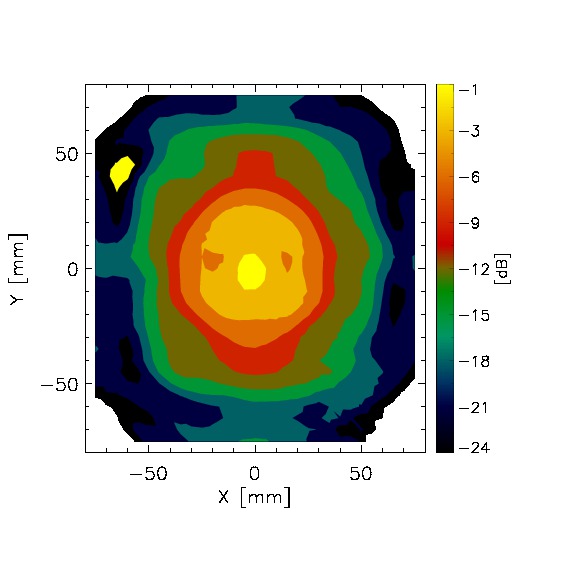
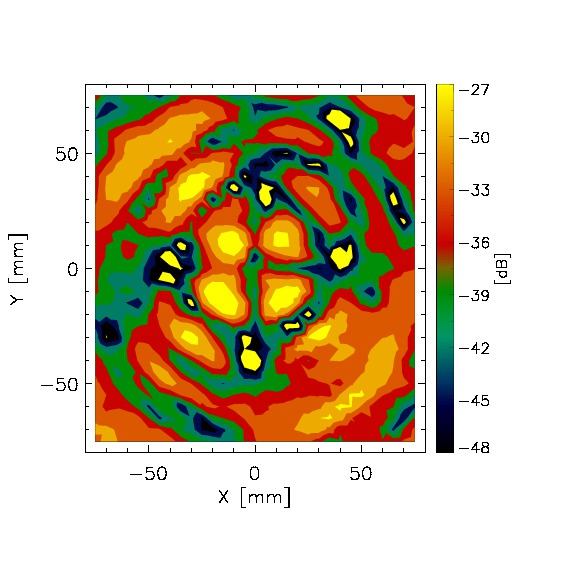
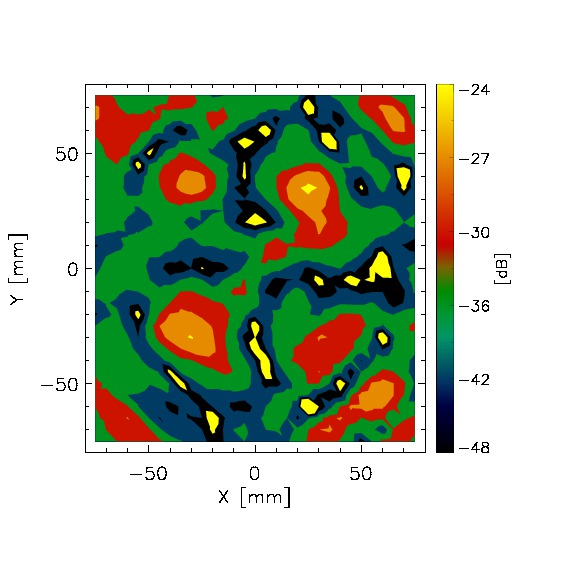
The copolar and cross-polar amplitude patterns of the open circular pupil are shown in Fig. 9. The copolar pattern has a slightly elliptical shape which, however is not visible in Fig. 10 and is only partially visible in Fig. 11. We do not have enough data to further investigate this issue, which might be a consequence of the overall accuracy of the measurement procedure. The cross-polar pattern also shows a good signal-to-noise ratio (SNR), which allows to measure its level at least 27 dB below the copolar signal. Achieving a good SNR is a necessary condition in order to allow a reliable reconstruction of the FF. As a repeatability test, we have performed this map again after several days and found that the shape of the pattern was essentially the same, confirming the robustness of the measurements setup.
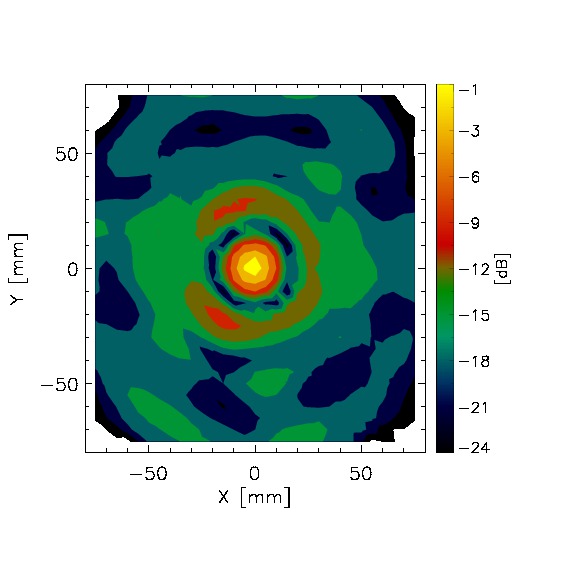
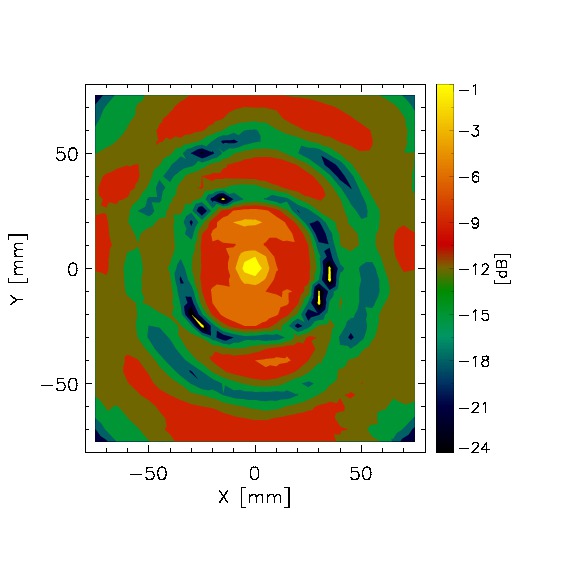
Next, we have performed the raster map with the three-coronae TP mounted on the circular aperture. The copolar and cross-polar amplitude patterns are shown in Fig. 10. The left panel shows a nicely circular main lobe and a first sidelobe with also an approximately circular symmetry, which indicate a good overall RF alignment. The cross-polar map in the right panel of Fig. 10 also shows the typical four-lobe pattern, but with clearly lower SNR compared to Fig. 9. It should be noted, in fact, that the 0 dB signal level is referred to the peak value of the copolar component of the TP and not of the circular aperture, and thus the absolute amplitudes in Fig. 10 are many dBs below the levels of Fig. 9. In addition, the copolar pattern has a FWHM that is clearly smaller than that of the open pupil, which confirms the preliminary results described in Sect. 4.2.
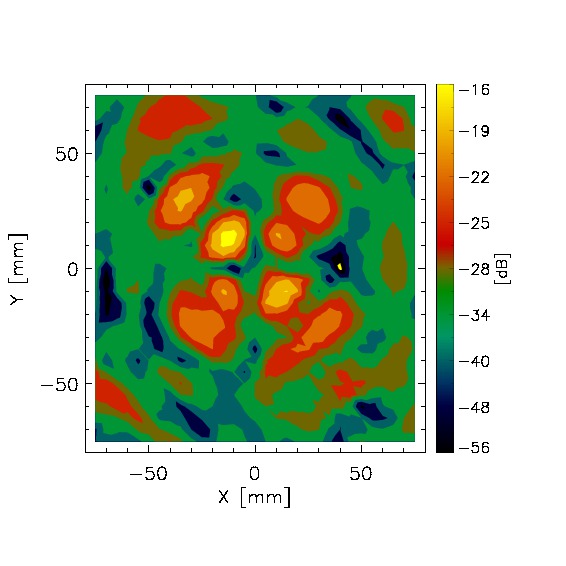
Finally, the NF maps obtained with the four-coronae TP are shown in Fig. 11. Compared to Fig. 9 the super-resolution effect is clearly visible, but a higher degree of asymmetry can be seen in the copolar pattern, which also shows higher sidelobes compared to the three-coronae TP. Higher sidelobes were already measured during the preliminary linear scans, as shown in Fig. 7. The cross-polar pattern is also clearly detected with the same symmetry as in Figures 9 and 10.
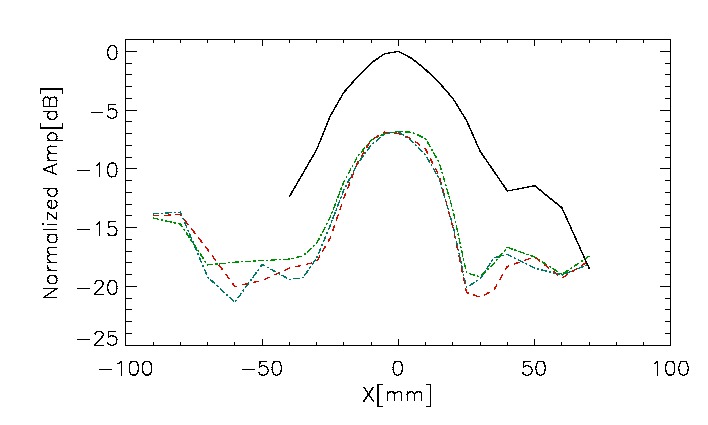
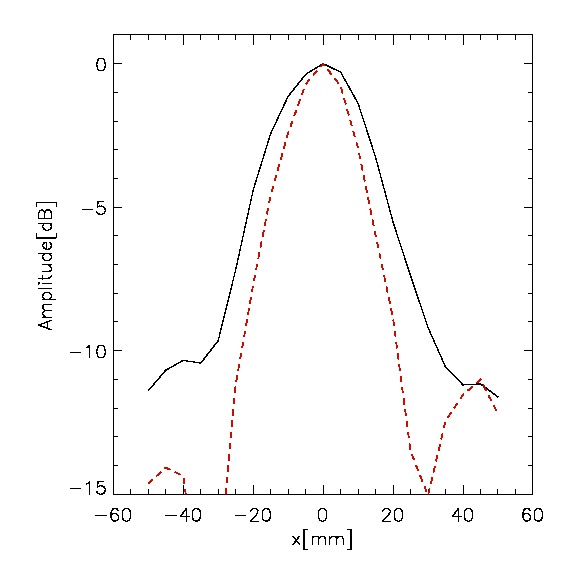
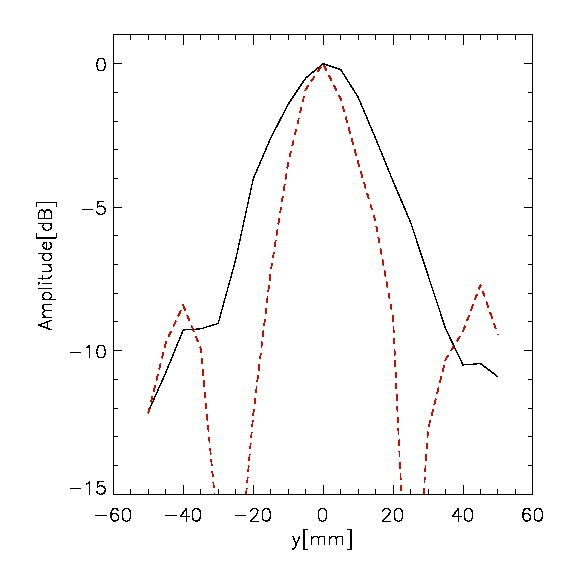
In Fig. 12 we also show the transversal cuts, along the - and -axis, of the 2D amplitudes shown in Figures 9 and 10. These curves should be compared with the top panel of Fig. 7. Despite the difference in the FWHM of the - and -cuts of the amplitude of the open pupil, due to the slight asymmetry discussed earlier, these results show otherwise a good agreement with the linear scan shown in Fig. 7.
|
|
|
|
5 NEAR-TO-FAR-FIELD TRANSFORMATION
Since all our measurements were performed in the NF of the open or composite circular pupil, a fundamental step in our work was the determination of the FF pattern from the NF measurements. As it was earlier mentioned in Sect. 4.3, in preparation for our NF-FF transformation procedure, we employed a planar scanning technique with regularly spaced data (plane-rectangular scanning). This is certainly the simplest technique from the experimental and computational point of view, and in Appendix A we review the specific method used for the NF-FF transformation. We apply the NF-FF transformation to the measured NF of the open and composite circular pupils, shown in Figures 9 to 11.
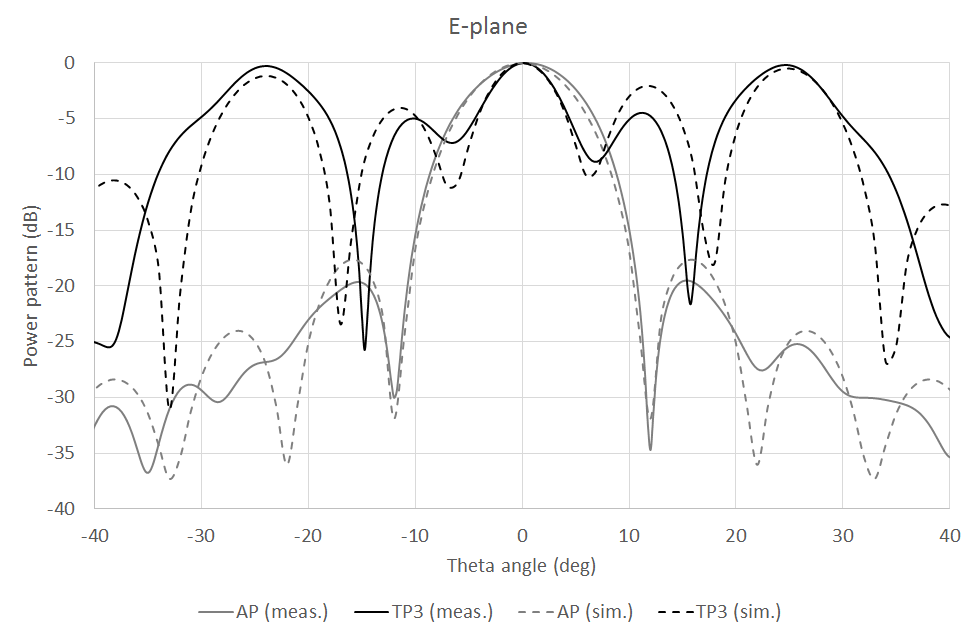
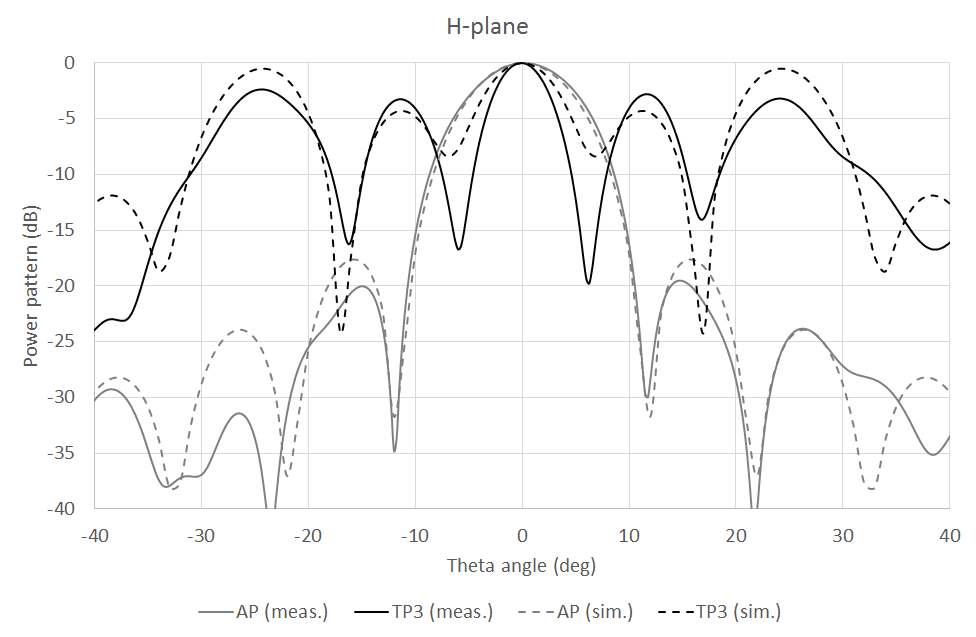
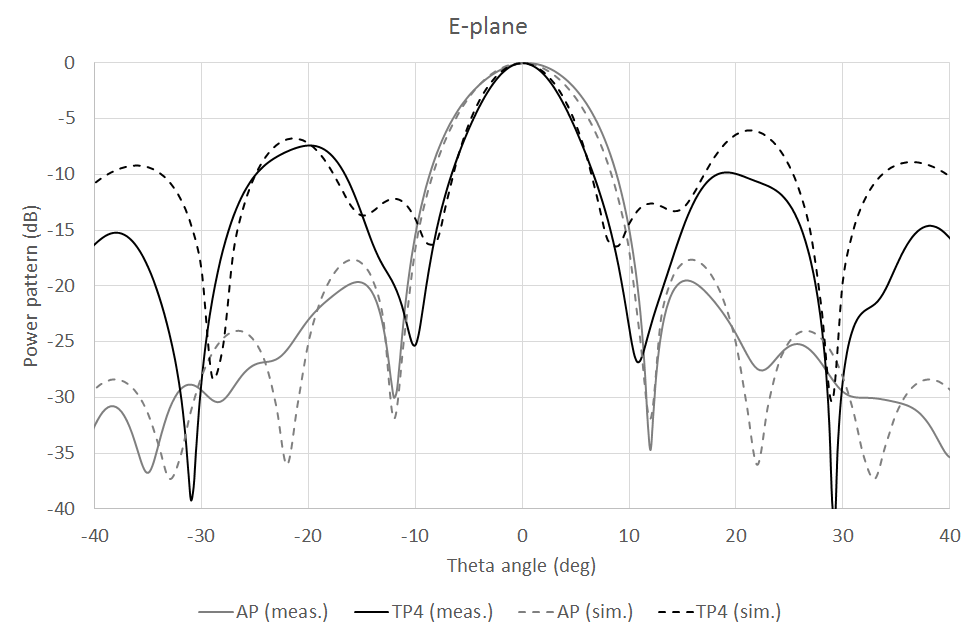
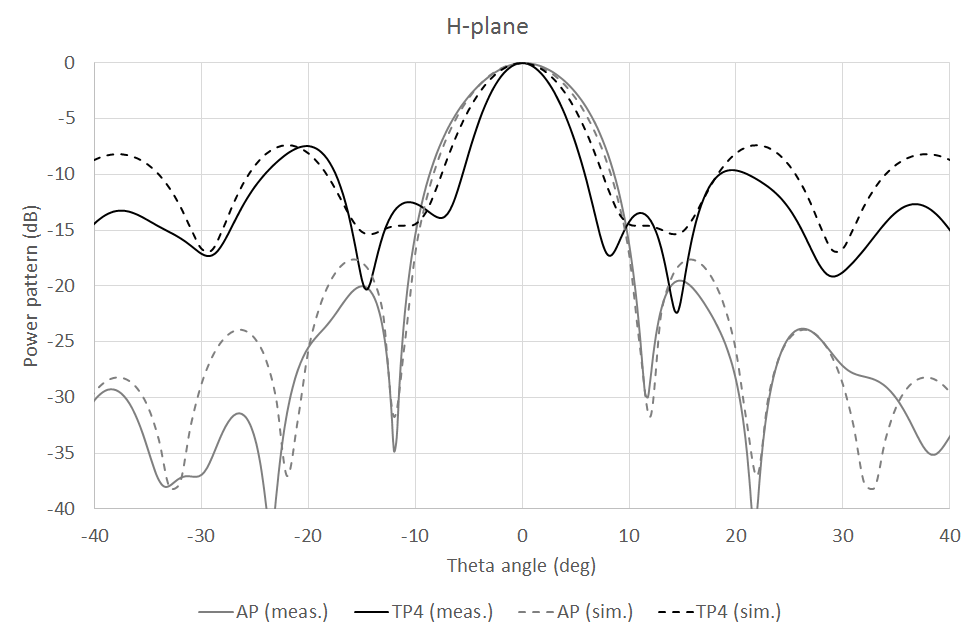
We show the FF of the three- and four-coronae TP in Figures 13 and 14, respectively, where they are also compared with the FF of the open pupil. We separately show the two components along the and reference planes, which correspond to cuts of the FF along the - and -axis, respectively (thus corresponding to the vertical and horizontal orientations discussed in Appendix A). The radiation diagrams show several interesting features. First of all, the super-resolution effect is clearly visible for both TPs, though at different levels, as expected. The FWHM is different along the two planes and is a consequence of the slight asymmetry of the radiation diagrams in the - and -planes. Secondly, the number, intensity and position of the sidelobes is also different between the two TPs, which is also expected, as discussed in Sect. 2 (see also Ref. olmi2016 ). In particular, the four-coronae TP has much lower level sidelobes, though the resolution gain, , is somewhat lower compared to the three-coronae TP. Finally, the normalized power patterns in Figures 13 and 14 do not show that the radiation diagrams of the TPs lie several dBs below the intensity level of the open pupil. Therefore, before TPs can be used effectively on a radio telescope their overall efficiency must be increased (see also Section 6).
When comparing the measured (and NF to FF transformed) FF of the TPs with the simulated FF from FEKO, we note from Figures 13 and 14 that the simulated FF of the open pupil closely follows the measured field, particularly in the -plane. However, in the case of the TPs we can note some discrepancies between the measured and simulated fields, which are more evident in the -plane. At present, we do not have a convincing explanation of as to why in the -plane we simultaneously observe a better agreement between the measured and simulated FF of the open pupil, and a larger discrepancy in the case of the composite pupils. A tentative explanation could be that the dielectric coronae are not modeled with sufficient accuracy by our numerical simulations in FEKO. In all cases we can also note an increasingly larger discrepancy between the measured and modeled sidelobes at larger observing angles. This effect, however, is better known and is associated with the truncation effect discussed in Appendix A.
Given all uncertainties and limitations in both the experimental measurements and numerical simulations, we think that the agreement between the measured and simulated FF is reasonably good, and confirms the ability of a discrete TP to achieve the super-resolution effect even in the absence of the required amplitude apodization, as previously discussed in Sect. 2. These measurements also show that it is indeed possible to achieve a trade-off between the super-resolution effect and the sidelobes level when a larger number of coronae is used in the design of the TP.
6 CONCLUSIONS
“Toraldo Pupils”, or variable transmittance filters, introduced by G. Toraldo di Francia in 1952 toraldo1952a ; toraldo1952b , represent a viable technique to achieve super-resolution, i.e., an angular resolution beyond the classical diffraction limit, in the microwave range. One of the most important characteristic of the TP is its simplicity and ease of fabrication. In order to investigate the possibility to apply these techniques to filled-aperture radio telescopes, we have first performed a series of extensive EM numerical simulations olmi2016 at a frequency of 20 GHz, which represents a trade-off between the computing time required by the EM simulations and the size and separations of the microwave components in units of wavelengths. The simulated FFs confirm that a partial super-resolution effect can be achieved even without the amplitude apodization required by the ideal optical model. We have also used additional EM simulations to more accurately model the launcher (rectangular feedhorn) and the spatial sampling in the NF by the probe.
We have then carried out laboratory measurements of the diffracted NFs by different TPs and compared them with the corresponding diffraction pattern of a circular open pupil. We first performed a series of preliminary tests, mainly devoted to measure various sources of noise and scattering, and then carried out planar scannings of the NF, measuring both the copolar and cross-polar components of the fields. The NF was then transformed into the FF and we detect the super-resolving effect in both ranges. Comparing our results in the FF with the FEKO numerical simulations, we find in general a good agreement. Our sensitivity is good enough to measure the sidelobes, allowing us to compare the level and number of sidelobes for the two TPs under test. Our measurements confirm the results of the first experiments in the microwave range mugnai2003 ; ranfagni2004 and, in particular, they show that the super-resolution effect is achieved with both three- and four-coronae discrete TPs. The different resolution gain, , and sidelobes obtained with the two TPs confirm that the number and geometry of the coronae can be used to achieve a trade-off between and the sidelobes relative intensity and position. This is important if a specific device including a TP should be designed to operate on a radio telescope.
Overall, our investigation confirms the super-resolving TP proof of concept. However, before TPs can be used efficiently on a radio telescope several problems must be addressed and solved. The main problem is that a variable transmittance filter should ideally be placed at the entrance pupil of a filled-aperture telescope, i.e., the primary reflector for classical two-mirrors telescopes. As this is clearly impractical (unless an active primary surface is available), a viable option is to place the TP at an image of the entrance pupil. This image can be generated through the use of a collimator, which also couples the TP device to, e.g., an existing receiver of a radio telescope. This and other design issues will be discussed in a forthcoming paper that will describe the preliminary design of a prototype TP optical system to be mounted on the 32-m Medicina antenna in Italy555http://www.med.ira.inaf.it/ olmi2017 .
Another important problem that needs further analysis is that the gain in angular resolution, obtained by the reduction in size of the main lobe, may be offset by the increase in intensity of the sidelobes and the decrease in the aperture efficiency (or antenna gain olmi2007 ) of the radio telescope. By using pupils with an array of concentric annuli, or even a continuous TP (Olmi et al., in prep.), the PSF can be tailored in such a fashion that one can get a narrow central beam surrounded by neighboring sidelobes of low intensity. The sidelobe level and position with respect to the optical axis are important especially in mapping applications. However, in this case an alternative solution can be the application of deconvolution algorithms to remove the high sidelobes from the final map roy2011 . We think that the loss in the aperture efficiency measured in our laboratory experiments can be mitigated by the use of efficient global optimization algorithms in the design of super-resolving pupil filters, as well as by the use of metamaterials.
Acknowledgements.
We gratefully acknowledge the contribution of the Ente Cassa di Risparmio di Firenze (Italy) for supporting this research. We also wish to thank G. Cauzzi (INAF-OAA) for providing us with some of the essential mechanical components used in our laboratory measurements, L. Carbonaro (INAF-OAA) for helpful suggestions regarding the mechanical setup and A. Ignesti (CNR-IFAC) for valuable suggestions on how to perform the measurements in the anechoic chamber.Appendix A Plane-rectangular NF-FF transformation
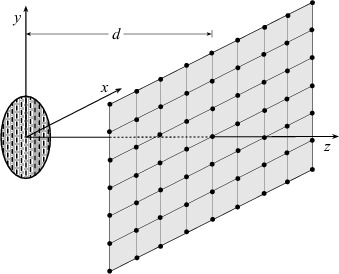
Among the NF-FF transformation techniques (planar, cylindrical or spherical), the plane-rectangular scanning is the simplest and most efficient from the analytical and computational viewpoints. Such a technique is particularly suitable for highly directive antennas since the pattern can be reconstructed only in a cone with an apex angle less than . In the plane-rectangular scanning (Fig. 15), the probe is mounted on a - positioner so that it can measure the NF amplitude and phase on a plane-rectangular grid. From these data, measured for two orthogonal orientations (horizontal, , and vertical, ) of the probe, or equivalently the transmitting feedhorn (by applying a rotation around the longitudinal axis in the second set), and taking into account the probe spatial response, one can compute the antenna FF pattern paris1978 ; joy1972 .
 |
It can be easily recognized that the NF tangential components of the field ( and ) cannot be obtained when performing the measurement by means of a real probe. In fact, the probe sees the center of the diffracting pupil (which constitutes our “antenna under test”, or AUT) from different directions when moving in the scanning plane. Moreover, even at a fixed position the probe sees each point of the AUT from a different angle. As a consequence, the FF of the AUT cannot be accurately recovered from the measured NF data by employing the uncompensated NF-FF transformation. The basic theory of probe compensated NF measurements on a plane as proposed in Refs. paris1978 ; joy1978 is based on the application of the Lorentz reciprocity theorem. The key relations in the reference system used in the present work are:
| (2) |
| (3) |
where:
| (4) |
and
| (5) |
where is a constant and is the free-space wavenumber. Namely, the antenna FF is related to: (i) the 2D Fourier transforms and of the output voltages and of the probe for the two independent sets of measurements; and (ii) the FF components , and , radiated by the probe and the rotated probe, respectively, when used as transmitting antennas. According to Ref. yag1984 , the FF components of the electric field, , , radiated by an open-ended rectangular waveguide (of sizes and along the and axis, respectively) excited by a TE10 mode are:
| (6) |
| (7) |
where the function is discussed in Ref. yag1984 . Similar equations can be found for the , field components.
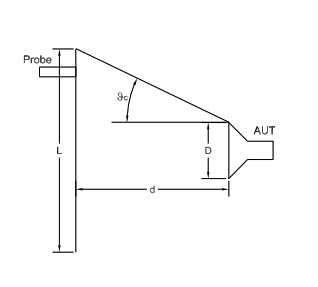 |
According to Eq. (5), in order to obtain the FF pattern all over the hemisphere in front of the AUT, the measurement plane should be infinite but, of course, this is not possible in a practical setup. The dimension of the plane should be such that the field becomes negligible at its edges, thus, minimizing the error associated with this truncation. Due to this so-called truncation error, the calculated FF using the planar NF data is valid only up to a critical angle outward from the aperture of the AUT (see Fig. 16):
| (8) |
References
- (1) Born, M., Wolf, E.: Principles of Optics, seventh edn. (1999)
- (2) Cagigal, M.P., Canales, V.F., Oti, J.E.: Design of Continuous Superresolving Masks for Ground-based Telescopes. Publications of the Astronomical Society of the Pacific 116, 965–970 (2004). DOI 10.1086/425592
- (3) Canales, V.F., de Juana, D.M., Cagigal, M.P.: Superresolution in compensated telescopes. Optics Letters 29, 935–937 (2004). DOI 10.1364/OL.29.000935
- (4) Cox, I.J., Sheppard, C.J.R., Wilson, T.: Reappraisal of arrays of concentric annuli as superresolving filters. Journal of the Optical Society of America (1917-1983) 72 (1982)
- (5) de Juana, D.M., Oti, J.E., Canales, V.F., Cagigal, M.P.: Design of superresolving continuous phase filters. Optics Letters 28, 607–609 (2003). DOI 10.1364/OL.28.000607
- (6) Goldsmith, P.F.: Quasioptical Systems (1998)
- (7) Joy, E., Paris, D.: Spatial sampling and filtering in near-field measurements. IEEE Transactions on Antennas and Propagation 20, 253–261 (1972). DOI 10.1109/TAP.1972.1140193
- (8) Joy, E.B., Leach Jr., W.M., Rodrigue, G.P., Paris, D.T.: Applications of probe-compensated near-field measurements. IEEE Transactions on Antennas and Propagation 26, 379–389 (1978). DOI 10.1109/TAP.1978.1141856
- (9) Kellerer, A.: Beating the diffraction limit in astronomy via quantum cloning. Astronomy and Astrophysics 561, A118 (2014). DOI 10.1051/0004-6361/201322665
- (10) Kim, H., Bryant, G.W., Stranick, S.J.: Superresolution four-wave mixing microscopy. Optics Express 20, 6042 (2012). DOI 10.1364/OE.20.006042
- (11) Liu, L., Wang, G.: Designing superresolution optical pupil filter with constrained global optimization algorithm. Optik 119, 481–484 (2008)
- (12) Martinez-Corral, M., Caballero, M.T., Stelzer, E.H.K., Swoger, J.: Tailoring the axial shape of the point spread function using the Toraldo concept. Optics Express 10, 98 (2002)
- (13) May, J., Jennetti, T.: Telescope resolution using negative refractive index materials. In: UV/Optical/IR Space Telescopes: Innovative Technologies and Concepts, Proc. SPIE, vol. 5166, p. 220 (2004)
- (14) Mugnai, D., Ranfagni, A., Ruggeri, R.: Pupils with super-resolution. Physics Letters A 311, 77–81 (2003). DOI 10.1016/S0375-9601(03)00445-6
- (15) Neil, M.A.A., Wilson, T., Juskaitis, R.: A wavefront generator for complex pupil function synthesis and point spread function engineering. Journal of Microscopy 197, 219 (2000)
- (16) Olmi, L., Bolli, P.: Ray-tracing and physical-optics analysis of the aperture efficiency in a radio telescope. Appl. Opt. 46 (2007)
- (17) Olmi, L., Bolli, P., Carbonaro, L., Cresci, L., Mugnai, D., Natale, E., Nesti, R., Panella, D., Roda, J., Zacchiroli, G.: Design of Super-Resolving Toraldo Pupils for Radio Astronomical Applications. Proc. of the XXXII URSI General Assembly and Scientific Symposium, submitted (2017)
- (18) Olmi, L., Bolli, P., Cresci, L., Mugnai, D., Natale, E., Nesti, R., Panella, D., Stefani, L.: Super-resolution with Toraldo pupils: analysis with electromagnetic numerical simulations. In: Ground-based and Airborne Telescopes VI, Proc. SPIE, vol. 9906 (2016)
- (19) Paris, D.T., Leach Jr., W.M., Joy, E.B.: Basic theory of probe-compensated near-field measurements. IEEE Transactions on Antennas and Propagation 26, 373–379 (1978). DOI 10.1109/TAP.1978.1141855
- (20) Ranfagni, A., Mugnai, D., Ruggeri, R.: Beyond the diffraction limit: Super-resolving pupils. Journal of Applied Physics 95, 2217–2222 (2004). DOI 10.1063/1.1644026
- (21) Roy, A., Ade, P.A.R., Bock, J.J., Brunt, C.M., Chapin, E.L., Devlin, M.J., Dicker, S.R., France, K., Gibb, A.G., Griffin, M., Gundersen, J.O., Halpern, M., Hargrave, P.C., Hughes, D.H., Klein, J., Marsden, G., Martin, P.G., Mauskopf, P., Netterfield, C.B., Olmi, L., Patanchon, G., Rex, M., Scott, D., Semisch, C., Truch, M.D.P., Tucker, C., Tucker, G.S., Viero, M.P., Wiebe, D.V.: Deconvolution of Images from BLAST 2005: Insight into the K3-50 and IC 5146 Star-forming Regions. Astrophysical Journal 730, 142 (2011). DOI 10.1088/0004-637X/730/2/142
- (22) Silver, S.: Microwave Antenna theory and Design. McGraw-Hill Company (1949)
- (23) Toraldo di Francia, G.: Il Nuovo Cimento (Suppl.) 9, 426 (1952)
- (24) Toraldo di Francia, G.: Atti Fond. Giorgio Ronchi 7, 366 (1952)
- (25) Yaghjian, A.D.: Approximate formulas for the far field and gain of open-ended rectangular waveguide. IEEE Transactions on Antennas and Propagation 32, 378–384 (1984). DOI 10.1109/TAP.1984.1143332
- (26) Zhang, X., Liu, Z.: Superlenses to overcome the diffraction limit. Nature Materials 7, 435–441 (2008). DOI 10.1038/nmat2141