The Hubble Space Telescope UV Legacy Survey of Galactic Globular Clusters – XI. The horizontal branch in NGC 6388 and NGC 6441††thanks: Based on observations with the NASA/ESA Hubble Space Telescope, obtained at the Space Telescope Science Institute, which is operated by AURA, Inc., under NASA contract NAS 5-26555.
Abstract
The Hubble Space Telescope UV Legacy survey of Galactic Globular Clusters (GC) is characterising many different aspects of their multiple stellar populations. The “Grundahl–jump" (G–jump) is a discontinuity in ultraviolet brightness of blue horizontal branch (HB) stars, signalling the onset of radiative metal levitation. The HB Legacy data confirmed that the G–jump is located at the same Teff (11,500 K) in nearly all clusters. The only exceptions are the metal–rich clusters NGC 6388 and NGC 6441, where the G–jump occurs at Teff13-14,000K. We compute synthetic HB models based on new evolutionary tracks including the effect of helium diffusion, and approximately accounting for the effect of metal levitation in a stable atmosphere. Our models show that the G–jump location depends on the interplay between the timescale of diffusion and the timescale of the evolution in the Teff range 11,500 KTeff14,000 K. The G–jump becomes hotter than 11,500 K only for stars that have, in this Teff range, a helium mass fraction Y0.35. Similarly high Y values are also consistent with the modelling of the HB in NGC 6388 and NGC 6441. In these clusters we predict that a significant fraction of HB stars show helium in their spectra above 11,500 K, and full helium settling should only be found beyond the hotter G–jump.
keywords:
stars: horizontal branch, stars: interiors, (stars:) Hertzsprung-Russell and colour-magnitude diagrams, (Galaxy:) globular clusters: individual: NGC6388, (Galaxy:) globular clusters: individual: NGC6441, stars: abundances1 Introduction
Two problems cohexist in determining the stellar distribution along the horizontal branch (HB) of Globular Clusters (GCs): the presence of discrete multiple populations in practically all clusters (see, for a recent update, Paper I and Paper IX, Piotto et al., 2015; Milone & et al., 2016) and the presence of phenomena ascribed to well identified variations in the atmospheric composition of the stars. In particular, the ‘Grundahl jump’ (G–jump) in the Strömgren color (Grundahl et al., 1998) has been shown to be connected to the sudden onset (at Teff K) of enhanced abundances of elements heavier than carbon and nitrogen in the atmospheres of blue HB stars hotter than this Teff. When the envelope is free from any form of turbulence, some elements suffer radiative levitation, due to radiation pressure on resonant lines, and the spectrum changes due to the higher concentration of metals. The result is a sudden ‘jump’ in the magnitudes and colors most affected by metal lines (Grundahl et al., 1999). A concomitant decrease in the helium abundance is observed in the atmospheres of stars hotter than 11,500 K, while cooler stars have normal helium. Typically, the helium to hydrogen ratio becomes a factor 10–100 smaller than the solar value (Behr, 2003; Moni Bidin et al., 2009, 2012). Blue HB stars also show a drop in rotation rates close to the G–jump (e.g. Behr et al., 2000; Recio-Blanco et al., 2004).
The reasons for the presence of another discontinuity at Teff20,000 K is less clear (Momany et al., 2004), as discussed in paper VII by Brown et al. (2016), while the most extreme gap, at Teff35,000 K is interpreted as the Teff discontinuity between the end of standard HB and the “late–flashers" stars, in which helium is the dominant atmospheric constituent (Sweigart, 1997; Moehler et al., 1999; Brown et al., 2001).
The main Teff location of the HB in different clusters depends on age and metallicity, while its color extension has been satisfactorily explained as the primary effect of the spread in the initial helium content (Yin) of the cluster populations (D’Antona et al., 2002)111The reader must keep in mind that the helium content has two different aspects and meanings in this work: 1) the “initial” helium mass fraction Y, or Yin in the evolving stars. This value may be different for the different “multiple populations”. It affects the stellar evolution (lifetimes, luminosities, Teff). In HB, it affects the morphology of the evolutionary track). 2) The surface helium mass fraction Ysurf. Starting from a specific Yin value of the evolving star, we consider how the helium abundance is modified by diffusion and mixing processes in the stellar envelope, and in particular at the surface..
The larger is the Yin, the hotter is the HB location of core–helium burning stars, even if the mass loss during the previous red giant branch phase is the same.
A simple argument in favour of the role of helium is that the clusters showing the most relevant abundance anomalies also have the HBs most extended in color (Gratton et al., 2010; Milone
et al., 2014), and self–enrichment models predict a direct correlation between light elements and helium content anomalies. One of the main chemical signatures of second generation, the sodium abundance, on average is larger at hotter HB locations (e.g. Marino et al., 2011; Gratton
et al., 2011; Milone
et al., 2012; Gratton
et al., 2014) in agreement with the expectation that higher Y HB stars have larger Teff.
The presence of very large helium contents (Y0.35) in the stars populating the ‘blue hook’, a group especially relevant in a few massive clusters222See Brown
et al. (2016), paper VII, for an update of the blue hook presence in clusters from the UV Legacy Survey observations. is more clearly confirmed by the presence of a similar high helium main sequence population in Cen (Bedin et al., 2004; Norris, 2004) and NGC 2808 (D’Antona et al., 2005; Piotto
et al., 2007).
Anyway, HB morphologies can not be characterized solely in terms of helium abundance. Two other parameters play a role in the location of stars along the HB: 1) the possible increase in the total CNO content in some populations in a few clusters (Marino
et al., 2013; D’Antona
et al., 2016), which shifts the tracks to cooler locations (e.g. Salaris et al., 2008), and 2) mass loss in the red giant branch, which may be larger in second generation stars (see the discussion in D’Antona
et al., 2013), shifting the tracks to hotter locations.
The data acquired by the Hubble Space Telescope Treasury survey (paper I), are providing strong evidence that, in most clusters, multiple stellar populations form discrete groups differing in the mean average chemical composition of their member stars (paper IX). In this case, it is probable that also the helium content is discontinuous passing from one group to the other, although the differences between contiguous groups may be very small in Y.
It is not clear whether helium discontinuities are necessary to explain any of the discontinuities in the HB. Paper VII reconsidered the morphology of HB using the photometric catalogues from the UV Treasury survey (paper I), and established beyond any doubts that the three important discontinuities cited above are located at the same Teff in nearly all clusters, and therefore can not be related to differences in the initial Y among specific groups of progenitor stars. Discontinuities at other Teff locations should be examined one by one to assess the possible role of helium differences, as it would be interesting to understand whether the morphology of HBs provides clear evidence for helium differences due to the presence of multiple populations. In some specific cases, this problem has been already addressed. D’Antona & Caloi (2004) established that a helium discontinuity was responsible for the scarcity of stars in the RR Lyr region of NGC 2808, an hypothesis that has been subsequently confirmed by the discovery of its triple main sequence. Di Criscienzo et al. (2011) and Di Criscienzo et al. (2015) established that the stars in NGC 2419 are mainly distributed into a group with standard Y and another one with very high Y.
Brown et al. (2016) have identified the G–jump at Teff13,000–14,000K in the metal rich peculiar clusters NGC 6441 and NGC 6388. They attribute the presence of a discontinuity at such a hotter Teff to the possibility that this Teff region is populated by extremely helium rich stars (Yin0.35). The high–Yin stars are confined to the hotter end of the HB and/or to the blue hook stars in other clusters where they are found. Their location at such, much lower, Teff in NGC 6441 and NGC 6388 is in agreement with the identification of the presence of high–Yin stars also in the thick red clump and in the RR-Lyrae strip, where they cause of long, anomalous periods(Caloi & D’Antona, 2007).
In this work we compare the observed HB of NGC6388 and NGC6441 with new HB models that include diffusion. To do this, we will use a library of new HB evolutionary tracks (see Tailo et al., 2015; Tailo et al., 2016, for the application of these models to the study of Cen). We show here that models including helium diffusion and helium contents Y 0.35 – 0.38 are necessary to explain the hotter Grundahl’s jump in these clusters. We predict that a relevant fraction of the stars populating the region TeffK must show non negligible Ysurf in their atmosphere, and that full helium settling occurs only in stars of larger Teff. In further coming papers we will use the same sets of models to infer the helium distribution and the mass loss of HB stars in the GCs studied in the Treasury UV survey (Tailo et al. 2017a,b, in preparation).
The outline of the paper is the following. In § 2 we discuss the observations of the two clusters, and their relevance in the study of multiple populations in GCs, in particular concerning helium variations. In § 3 we explain the input physics of the stellar models employed in this work, and, in particular, the formulation of the helium diffusion parametrization. We compare the high–Y model excursions through the HR diagram in models with and without helium settling. In § 4 we show the results of synthetic HB models and their comparison with the Treasury data for the two clusters. In § 4.1 we show the constraints on helium which allow to reproduce the hotter Grundahl jumps and in § 5 we discuss and summarize the results.
2 The clusters NGC 6388 and NGC 6441: similarities and differences
NGC 6388 and NGC 6441 host a very extended HB (Rich et al., 1997) in spite of their high metallicity, [Fe/H]–0.50 (Carretta et al., 2007; Origlia et al., 2008); GC with this metallicity typically have only a red HB. The fraction of stars populating the red HB is the most prominent (about 87% in NGC 6388, and about 91% in NGC 6441, Bellini et al., 2013). Another very important anomaly resides in the very long periods of their RR Lyr variables (the average period of a,b type RR Lyr is 0.71 d in NGC6388, and 0.76 d in NGC 6441 Pritzl et al., 2000), even longer than the typical periods of the Oosterhoff type II clusters, which are generally metal poor. The peculiar luminosity of the HB at the RR Lyr location is a clear indication of the presence of helium rich stars in the RR Lyr region, although this explanation was controversial until Caloi & D’Antona (2007) modeled the whole HB of NGC 6441 in the HST bands F439W and F555W observed by Piotto et al. (2002), showing that the helium enriched stars are not limited to the small percentage of the blue HB (Busso et al., 2007), but are present also in the red HB, justifying its thickness in magnitude. In Caloi & D’Antona (2007) the percentage of stars having a standard–Y was determined as a mere 38% in NGC 6441. A similar analysis was presented by D’Antona & Caloi (2008) for the HB in NGC 6388. In both clusters, the extension in color of the HB was attributed to the property of high–Y, high metallicity HB models, which, for a small range of mass, undergo long excursions from low to high Teff (Sweigart & Gross, 1976).
Despite the fact that these clusters must host a significant fraction of very helium-rich stars, Bellini et al. (2013) have shown that they must differ also in some other chemical aspects. In the color mF390W–mF814W333remember that the band F390W is influenced by CNO abundances., NGC 6441 shows a split main sequence, populated by 65% on its red side (Bellini et al., 2013). The analysis by Bellini et al. shows that the helium difference between these two main sequences is Y and suggests that the helium distribution is bimodal, with about one third of NGC 6441 stars clustering around very high helium (Y=0.35–0.36), and the remaining stars, including the first generation group, having on average Y0.30. The distribution may be multimodal, similarly to what we have observed in NGC 2808 (D’Antona et al., 2005; Piotto et al., 2007), although either the presence of differential reddening, other observational peculiarities, or the presence of a strongly diluted second generation, in which the helium content merges with the initial value (see, e.g. D’Antona et al., 2016, for the case of NGC 2808) do not allow to isolate independently the “first generation" sequence.
The visual color magnitude diagram of NGC 6388 reveals a dim sub giant branch, that has been interpreted with a CNO enriched population including 222% of the total number of cluster stars (Piotto et al., 2012). In other clusters with split sub giant branch, the CNO variation has been confirmed from direct spectroscopic measurements (Yong et al., 2009; Yong et al., 2015; Marino et al., 2012; Lim et al., 2015). In contrast, there is no evidence of a CNO enriched population in NGC 6441 (Bellini et al., 2013). On the other hand, the main sequence color spread in mF606W–mF814W of the two clusters is similar, implying similar helium total variation, as also suggested by the HB color and magnitude distribution.
The situation is very complex, and a more general discussion on the HB properties of the Treasury Program clusters will be presented in a separate paper. We devote this first study to the presentation of the models and to constrain the value of the helium content of the stars crossing the CM diagram from the red to the blue side, with detailed comparison with the location of the G–jump.
3 HB models including sedimentation
The HB models have been computed with the ATON code, whose main inputs concerning opacities, convection model —including overshooting — and equation of state are reported in Ventura et al. (2008). The most recent updates in the models follow those presented in Tailo et al. (2015); Tailo et al. (2016), apart from a refined treatment of diffusion which we discuss in this section. Complementary isochrones for the evolution from the main sequence up to the tip of the red giant branch, with the same compositions of the HB models, are computed. The HB evolution starts from the zero age horizontal branch (ZAHB), where the helium-core mass is fixed by previous evolution up to the helium flash. We follow the evolution of each model up to the exhaustion of helium in the core.
In this work, we adopt a metallicity in mass fraction Z=0.006, with [/Fe]=0.40 based on the abundance measurements by Carretta et al. (2007) for NGC 6388 and by Origlia et al. (2008) for NGC 6441. The helium mass fraction is set to Y=0.25, 0.28, 0.30, 0.32, 0.35 and 0.38. We compute both standard models, and models including helium diffusion, using the formulation given by Thoul et al. (1994). The routine self consistently computes the effects of gravitational and thermal settling of helium and of the ‘average’ metal with respect to hydrogen, in all the mesh-points of the structure palced within an outer and inner boundary. The inner boundary is placed where hydrogen is present. The outer boundary is chosen as described in the following paragraphs. The code computes the coefficients described in equation 41 of Thoul et al. (1994) to obtain the diffusion velocities for each of the components considered. Then, the equation regulating the rate of change of the elements mass fraction (equation 40 in Thoul et al., 1994) is solved following the scheme adopted in Iben & MacDonald (1985).
The treatment of diffusion –even the simple diffusion of helium– is a challenging problem. Note that the diffusion velocities rapidly decrease as density and temperature increase. Surface settling of helium is very fast in the optical atmosphere, unless some source of turbulence is present, so that diffusion acts only below the turbulent region, Thus, the global effect of diffusion is a by-product of the residual turbulence in the outer envelope (Michaud et al., 2007, 2008). A common way to deal with this problem is to assume as outer boundary of the diffusion computation a fixed mass fraction Mturb, above which it is assumed that turbulence prevents diffusion. Values of Mturb10 of the total mass are quoted in relevant literature, for main sequence low mass stars with deep convective envelopes. If the inner boundary of the convective region is inner than Mturb, diffusion operates from the inner boundary of convection.
For HB models, there are several important studies in the recent literature. Michaud et al. (2011) include self consistently both atomic diffusion and radiative acceleration. They find that the abundance anomalies observed in HB stars atmospheres at Teff above the G–jump are compatible with the model results, when they assume an envelope mixed mass of . No hypothesis is made about the physical reasons for the mixing mechanism. The same models predict too large helium abundances with respect to the observations in the range 12,000Teff17,000 K (see also Moehler et al., 2014). LeBlanc et al. (2009, 2010) have shown that stratified model atmospheres, in which atomic diffusion and levitation are both included solve the long-standing problem of computing appropriate gravities for the hot HB stars, and this seems in contrast with a fully mixed region (Moehler et al., 2014). Nevertheless, these same stratified models predict higher than observed abundances for the elements affected by radiative levitation. Thus these results are in part contradictory and much work is needed to arrive to a self-consistent solution.
Concerning our models, we concentrate on studying the interaction between the timescale of Teff change with time along the evolution and the timescale of helium diffusion. We wish to explore what happens when these two timescales are comparable. As observations and models have already shown that the G–jump transition is concomitant to the appearance –or disappearence– of the H–convection region, we have to follow as completely as possible the evolution of the convective regions and the transition from convective to radiative envelopes. The computations will determine when and at which Teff the atmosphere becomes free of any kind of turbulence, and radiation pressure on the lines allows metals to levitate, producing the G–jump. The variation with Teff of the convective regions can not be described by choosing a boundary for the turbulence too much inside the star. The external layers may be convective due to the partial hydrogen ionization region for Teff11,500 K, but the He I and He II partial ionization regions may be present in deeper layers (see Fig. 2, top panel), and they emerge into the most external envelope respectively at Teff15,000 K and 30,000 K (see, e.g., figure 9 in paper VII and references therein). These convective regions should play a role in the diffusion modeling.
We first examined models in which diffusion is efficient below the inner boundary of the most external convective region (either He I or H), or from below a very small mass fraction (Mturb=10-10 of the total mass) if there is no outer convection. Sedimentation of helium in the atmosphere results too fast, and is not consistent with the measured (small) abundances of Ysurf in the HB stars in NGC 6752 at Teff12,000 K (Moni Bidin et al., 2007). In order to fit the observed values, we may counteract the fast helium settling with a parametric mass loss along the evolution. This approach is successful, but it is not satisfactory, because the mass loss rate necessary to fit the data vary with Teff. Those required for models at Teff11,500 K are 10 times higher than at Teff11,500 K. The reason is straightforward. In models cooler than the G–jump, our assumption implies that diffusion operates below the (small) surface convective region due to partial H–ionization. On the other hand, for models at Teff higher than the G–jump, it operates from below the He I–convection region, where the diffusion velocities are low.
We moved to a different approximation. We still fix the external boundary for the diffusion computation at Mturb=10-10 of the total mass, if both H– and He I–convection layers are not present or do not extend beyond Mturb. This choice helps to make stable the solution of the diffusion equations. In all other cases, we assume that the whole external envelope is turbulent down to the boundary below the He II convective region, independently from the presence or not of the H–convection layer. The diffusion velocities below this boundary are smaller than below the plain H–convection layer, so diffusion less effective also at Teff below the G–jump. This choice of the external diffusion boundary proved to be more satisfactory, as it requires only a very small mass loss rate (of the order of the solar mass loss rate) to allow the survival of the small but measurable helium content in the stars hotter than the G–jump, in agreement with the data of NGC 6752 (Tailo et al. 2017a, in preparation). For these reasons we adopt this approach in the present work.
We use bolometric corrections and color transformations available from Castelli & Kurucz (2004), for the metallicity Z=0.006 and for standard helium content. The models do not include atmospheric radiative levitation so they are not fully self–consistent. We simulate its effect by shifting the specific magnitude computation to the tables of [Fe/H]=0.3 transformations as soon as the helium surface content of the model drops below Ysurf=10-3. In other words, although we use a rough approximation444 LeBlanc et al. (2010) show that model atmospheres in which the metals are homogeneously increased account only in part for the offset of the G–jump in the Grundahl et al. (1999) Strömgren color magnitude diagram. Computation of stratified model atmospheres is necessary to account for the whole G–jump. , we link the occurrence of metal levitation to the evolution of the surface helium abundance experienced by our models, which is a good proxy of the surface stellar turbulence in the Teff range of interest.
3.1 The necessity of full evolutionary computation to model the role of helium in the models
One immediate result of our test computation of the HB evolution models including diffusion is the following. Convection due to the high opacity in the hydrogen partial ionization zone disappears at the onset of full ionization, at Teff=11,500 K, which establishes a very well defined convection boundary (and consequently is a strong observational marker). The behavior of the He I and He II partial ionization regions is much more awkward: their survival also depends on the presence of helium in the layers with the appropriate temperatures. If helium is fully settled in these layers, one or both of these convective regions may disappear in the course of evolution.
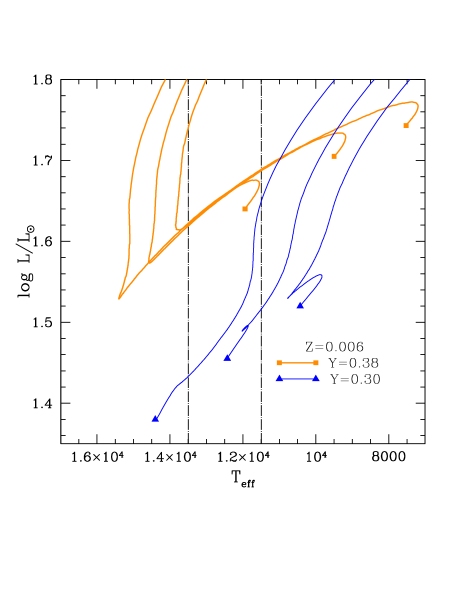
During their HB lifetime, stars do not remain at a fixed Teff, so the location and extension of their convection zones will change because the Teff changes. The variation of the convective layers depends also on the timescale on which this Teff evolution occurs compared to the diffusion timescale. This effect is schematically described in Fig. 1, where we compare two different sets of evolutionary tracks whose ZAHB locations (solid squares and triangles) are in proximity of the G–jump region. The two sets refer to models with initial helium (Yin) equal to 0.30 and 0.38, for masses 0.53, 0.54 and 0.55. The paths of the plotted tracks are different. Tracks with lower Yin evolve from high to low Teff, whereas those with higher Yin cross the G–jump boundary (11,500 K) from low to high Teff.
3.1.1 Standard evolution: reaching the G–jump from a larger Teff
If helium diffusion is accounted for and the evolution proceeds from an initial Teff11,500 K, helium settles to layers where it is fully ionized, and the convection regions disappear for any values of Yin (standard or higher than standard). In the stable atmosphere metals levitate, until the evolving star crosses the boundary of 11,500 K and the onset of H–convection destroys the atmospheric radiative stability. In general, the tracks in the G–jump region evolve from hotter to cooler Teff, for both standard and enhanced Y, at the low metallicity typical of most GCs.
This is the ‘standard’ case, and we depict it by looking at the evolution of the convective regions (Fig. 2) for the 0.54 with Y=0.28 and Z=0.006. This track crosses the Teff range from 13,000 K to 10,000 K. During the whole standard (no diffusion) evolution the He–partial ionization regions in the inner layers are preserved (top panel), but these regions disappear very soon including the effect of diffusion (bottom panel). In models with important mass loss rates (M⊙/yr), or having a bigger Mturb, helium settling will be slower than shown in Fig. 2, but the helium convective region will be quenched before the star evolves through the standard G–jump, as the Teff decrease with time takes place over several tens of million years, and models must be consistent with the small Ysurf at Teff11,500 K in the observations(Moni Bidin et al., 2007).
The stable atmosphere allows metals levitation, so that the G–jump appears strictly below Teff=11,500 K. This kind of evolution is standard for all tracks with Y0.34 at low metallicity. This justifies the unique location of the G–jump at the same Teff in all GCs (Brown et al., 2016), in spite of possible differences in the specific Yin of stars populating the Teff’s close to the G–jump in clusters having different histories of helium enrichment in second generation stars.
3.1.2 Crossing the G–jump evolving from a smaller Teff
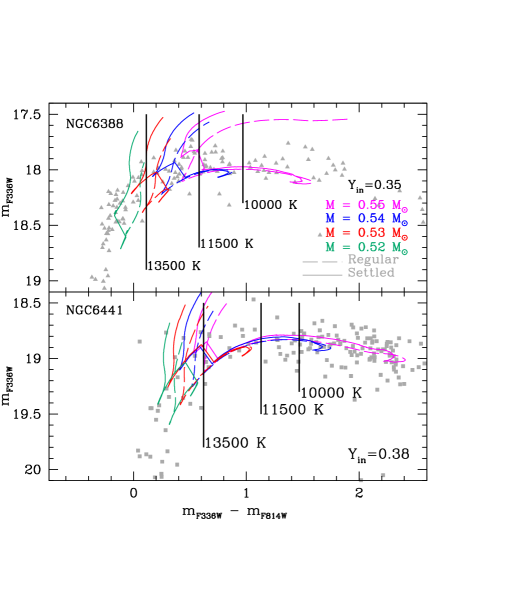
The peculiar case of the clusters under examination is illustrated in Fig. 3, where we show the Treasury program data for NGC 6388 and NGC 6441. The two observational G–jumps are indicated by vertical lines at Teff=11,500 K and 13,500 K (see the discussion in Brown et al., 2016). Superimposed are tracks for Z=0.006 and Y=0.35 (top) or Y=0.38 (bottom), both standard (dashed) and including diffusion (full lines). Diffusion modifies the Teff excursions of the tracks, which become shorter. The onset of the effect of radiative metal levitation (the change of bolometric corrections, leading to the sudden jumps in color and magnitude) is included when the surface Y becomes 0.001.
Apart from the smallest mass (0.52), the tracks evolve from low to high Teff. If the evolution starts from Teff11,500 K, the He–abundance in the envelope may remain large enough that the He convection zones may survive, possibly until this first He ionization is complete, formally at a Teff as large as 15,000 K. The stability of the atmosphere and the occurrence of radiative levitation will then occur only at a Teff intermediate between the standard G–jump (11,500 K) and the Teff of full He–ionization.
We see that the hotter track (0.52), evolving from high to lower Teff, shows a prompt effect of diffusion. The other tracks show loops in the HR diagram. The long loops are due to the very high Y and the relatively high metallicity of the models, as shown in the seminal paper by Sweigart & Gross (1976). The most interesting cases are the 0.54 and 0.55 evolutions, which proceed along long loops from Teff below the G–jump. Indeed the 0.54 track shows that the G–jump occurs at larger Teff than the standard models. The precise Teff at which the stellar envelope attains radiative equilibrium depends on the competition between the He–diffusion timescale of the models and the timescale of Teff evolution. The larger is Y, the faster is the evolution through the G–jump region. Brown et al. (2016) analysis shows that NGC 6441 has only the hotter G–jump, while NGC 6388 may have also a (smaller) G–jump at the standard Teff. This may hint that some of the stars in NGC 6388 are evolving along tracks which become fully radiative at the standard Teff. We show that this may depend on the precise Y of the stars evolving in this Teff range.
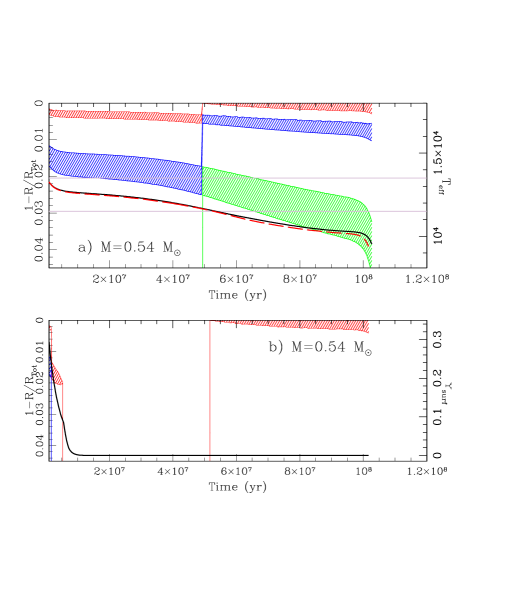
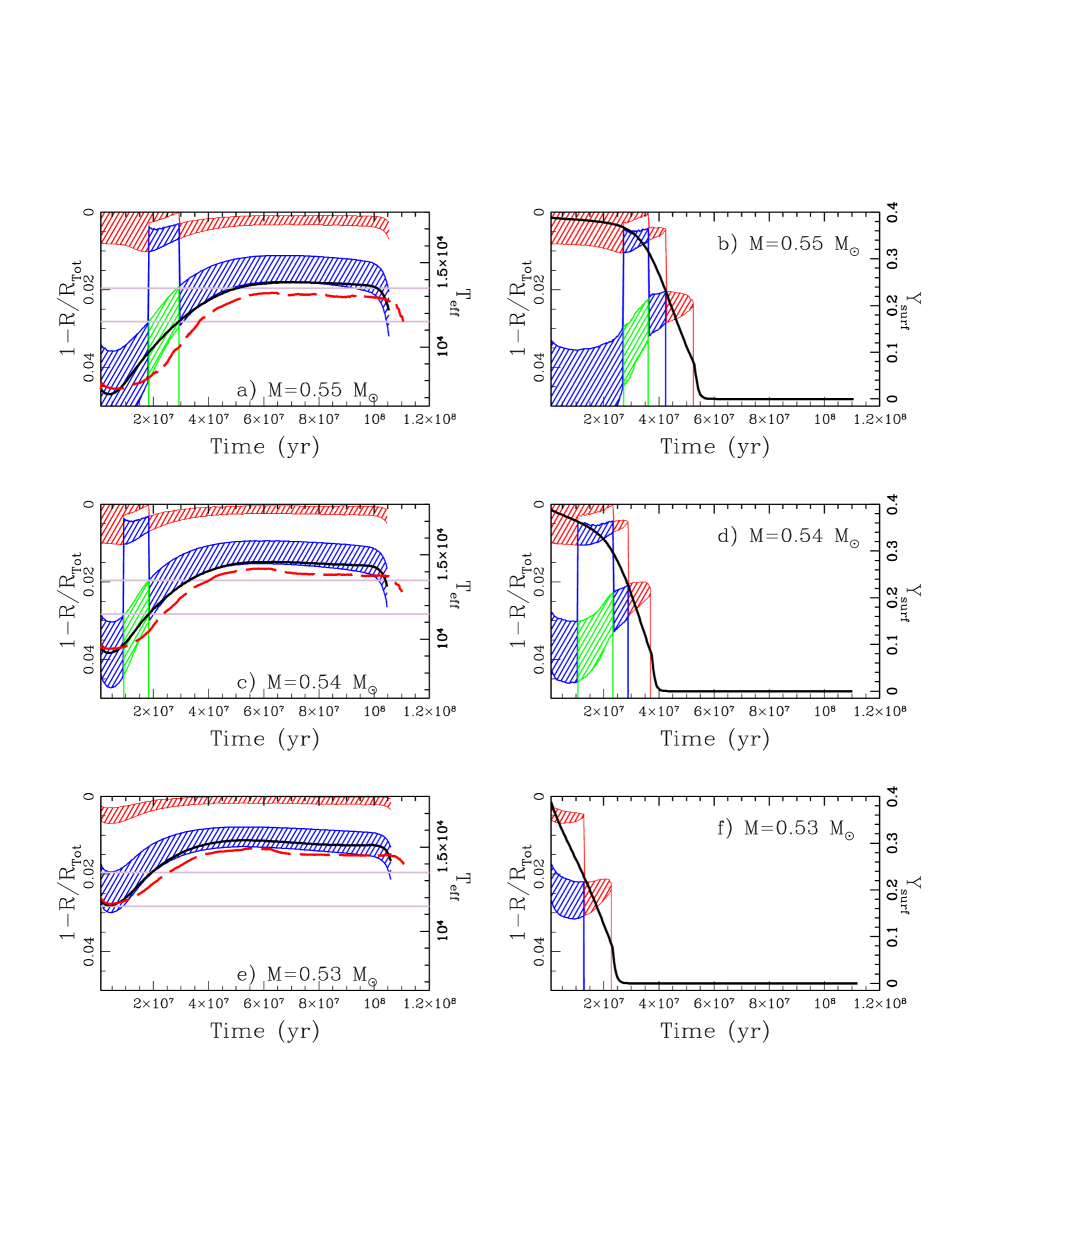
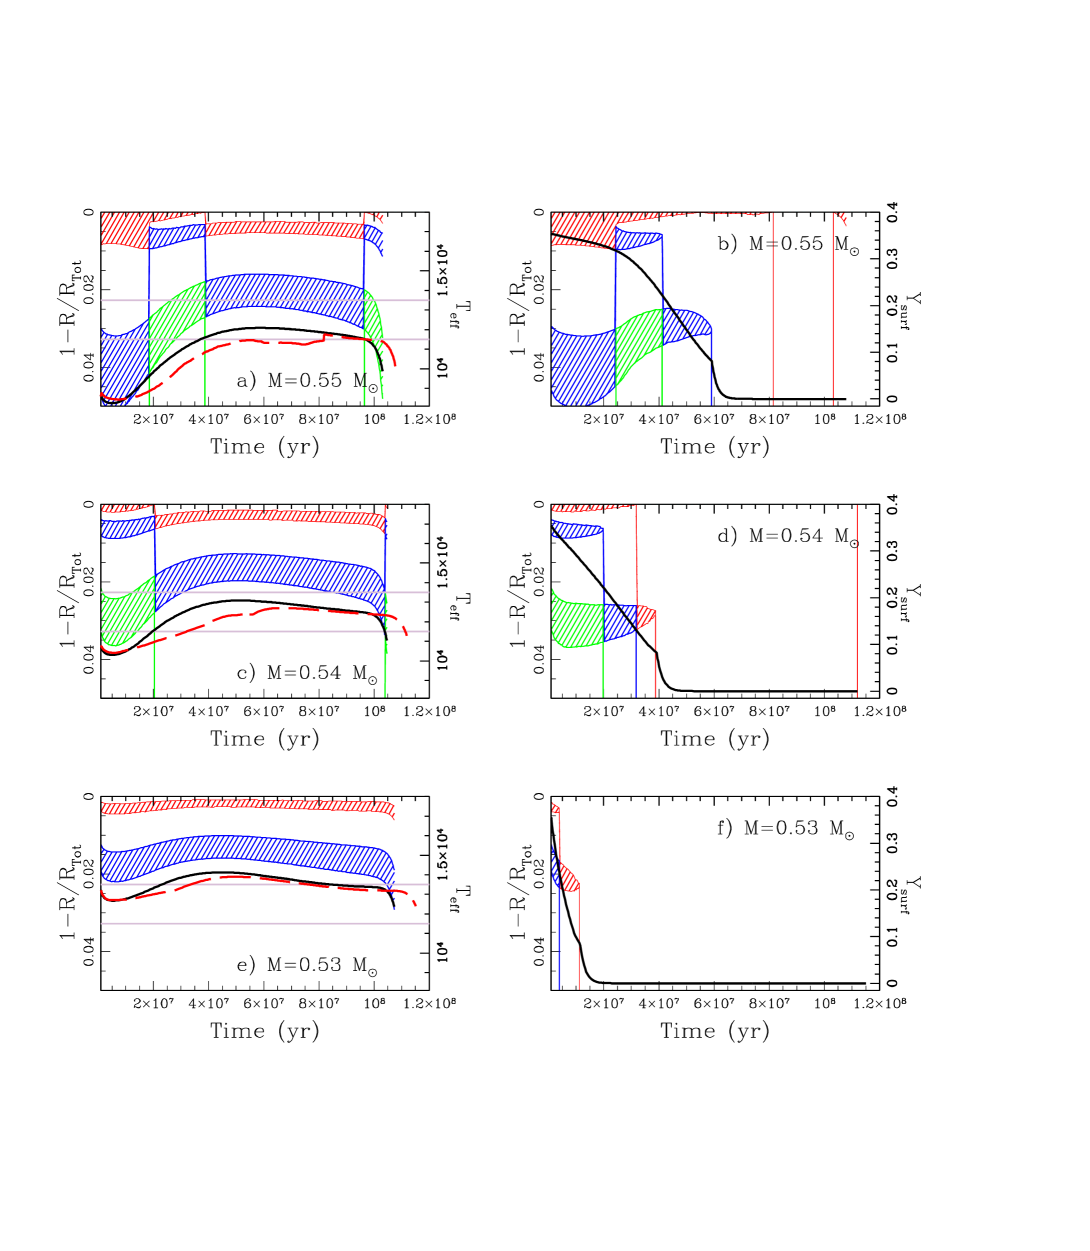
In the following figures, we show the difference between the convection region in models with and without gravitational settling for Y=0.38 (Fig. 4) and Y=0.35 (Fig. 5). We depict the evolution of the outer convection zones for three tracks in the standard (left panels) and diffusion case (right panels). The full black line and red dashed line in the left figures represent the Teff evolution with time (right side scale). On the other hand, the black lines of the right panels describe the Ysurf evolution with time of the diffusive models (scale on the right). We see that diffusion drastically modifies the He–convective region. In Fig. 4 (case Y=0.38) the evolutionary loops are very extended, and the fully radiative structure is achieved at Teff13,500 K in all the three tracks. These models will produce a sharp G–jump at the required Teff. We allow diffusion below the He-I partial ionization layer, but notice that the He-II driven convective region, which is interior to the 2% of the stellar radius, also plays a role and acts to slow down He–diffusion efficiently (see later the discussion on the observables). This shows that the diffusion problem is far to be fully explored, and these models are only first steps towards a full understanding of the different physical inputs.
In Fig. 5 (case Y=0.35), the top panels (a and b) represent the 0.55 evolution, which starts at Teff10,000 K and evolves rapidly towards larger Teff. The track excursion ends more or less at the standard G–jump. The 0.54 track (panels c and d) evolves through the standard G–jump. It preserves both the He–I convection region and a finite Ysurf until Teff12,000 K. The 0.53 track (panels e and f) starts in between the two G–jumps and loses the convective regions at Teff13,000K.
4 Simulations for the blue HB side
We compute simulations of the HB data from the Treasury program using the new diffusion tracks database. This allows us to check the working hypothesis that the interplay between the timescale of diffusion and the timescale of the evolution beyond the standard Teff of the G–jump is the dominant physical reason which shifts the G–jump location to Teff13,500 K in these peculiar clusters.
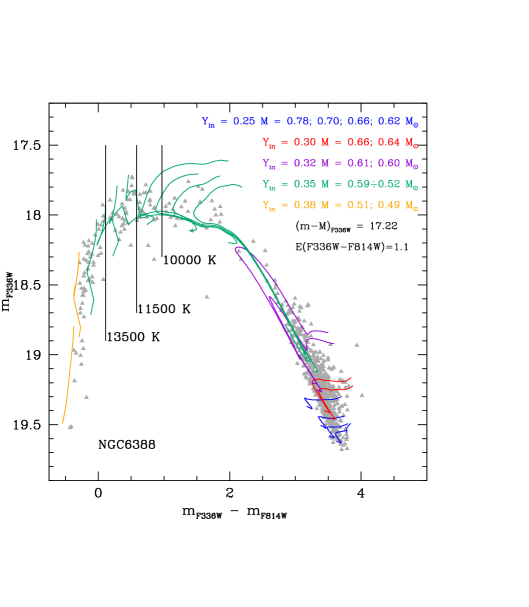
We show in Fig.6̇ the whole HB of NGC 6388 in the plane mF336W versus mF336W–mF814W. The UV band data come from the Treasury HST Survey (Piotto et al., 2015) while the mF814W data come from the ACS Survey of GCs (Sarajedini et al., 2007). Appropriate tracks from the database —shifted to apparent magnitudes and colors— are superimposed on the data. As already well known from previous work, different helium contents are needed to reproduce the color–magnitude diagram. The clump must include stars with Y as large as Y=0.32. In addition, values of Y0.34 are needed to ‘cross’ the diagram from low to large Teff, at the appropriate magnitude (as shown by Caloi & D’Antona, 2007, this is necessary also to reproduce the RR Lyr anomalous long periods and high luminosities). The latter authors presented example simulations of the optical HB data of these clusters, while we now concentrate on the blue side only. As the helium content of the stars which evolve from the red to the blue side is not known from first principle, we use different simulations to understand which are the plausible choices.
The synthetic HBs are built by basically following the prescriptions described by Caloi & D’Antona (2007) (see also Tailo et al., 2016). We fix the age of the cluster (typically at 12 Gyr) and subdivide the stars into groups having different helium content. We derive the mass MRGB evolving in the red giant phase for the set (age, Z, Y) of each group, and assume an average mass loss value M, which is randomly varied assuming a gaussian deviation M). We thus have an HB mass MHB=MRGB–M for each group of Y values. The average mass loss is adjusted to achieve the MHB masses which describe the observational values. In principle, the variation of MHB may be due solely to the decrease of MRGB with increasing Y, but previous studies have shown that some additional mass loss may be needed (see, e.g., the discussion in D’Antona et al., 2013). We take care to avoid discontinuities in the number counts and/or in the Y values. If the samples are similar in numbers, or monotonically varied with Y, the discontinuities obtained in the color distribution are a result of the temporal evolution of the tracks. Example cases of the chosen values are listed in Table 1.
4.1 The blue HB description in terms of models including diffusion
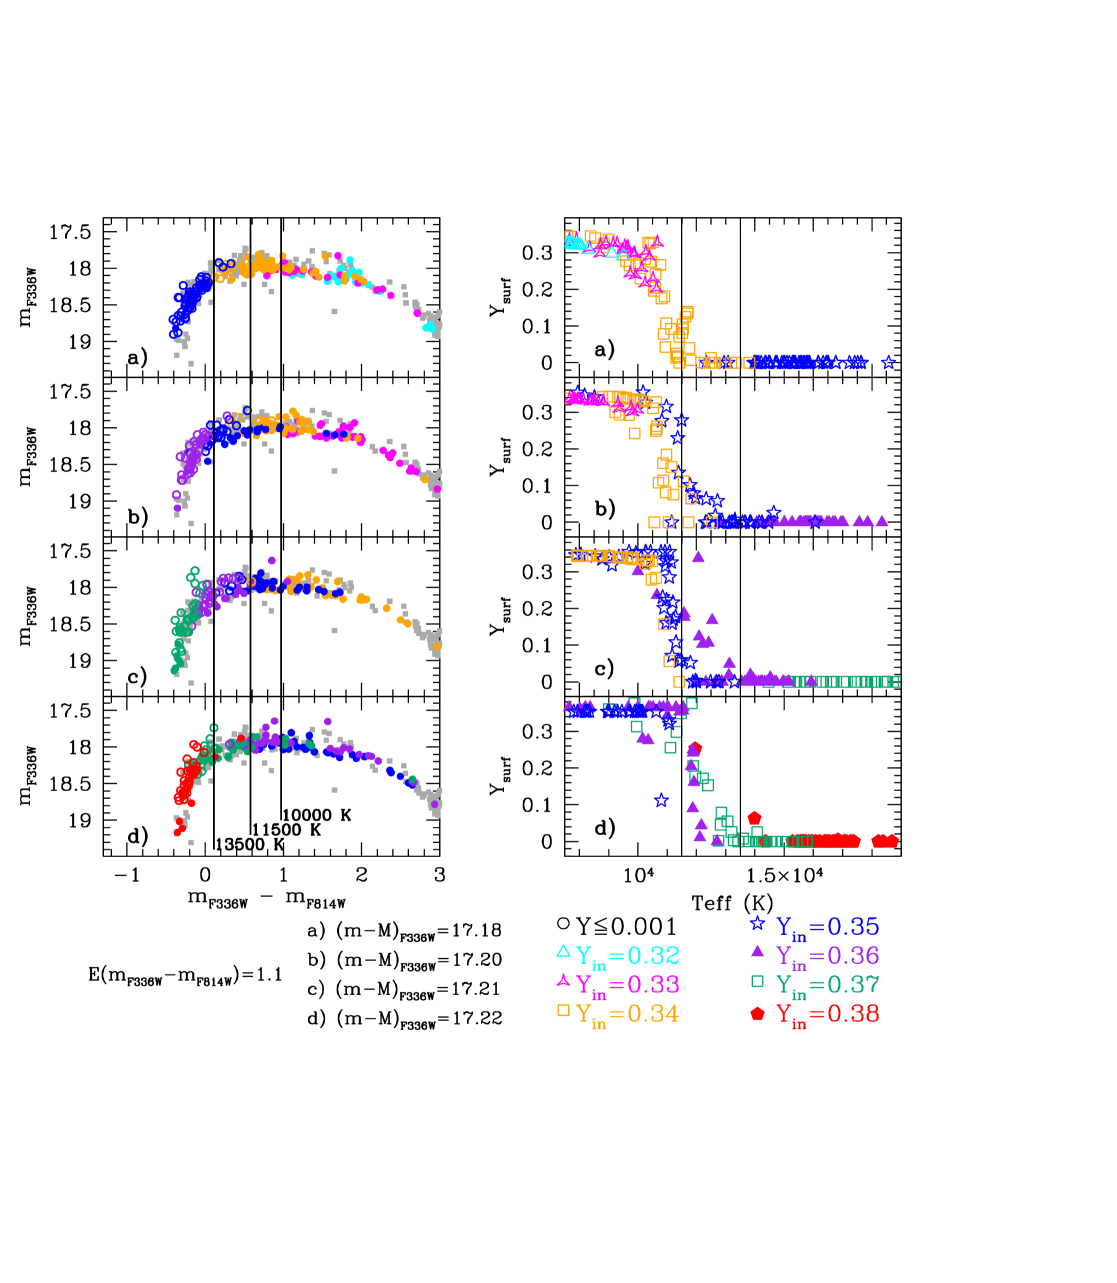
In Fig. 7 we present a simple test of our hypothesis concerning the role of helium in the shift of the G–jump. Considering only the HB part extending from the RR Lyr region to the Momany gap at Teff20000 K, we show the influence of a different choice of the helium distribution for stars crossing the Teff range between the standard G–jump (11,500 K) and the hotter G–jump location (13,500 K). In the left panels of Fig. 7 we show four simulations for the HB of NGC 6388 (coloured dots), superimposed to the data (grey squares). The helium mass fraction increases from the panel a (Y=0.34 in between the G–jumps) to panel d (Y=0.37). We slightly adjusted the value of mass loss to compensate for the variation of MRGB induced by the increase in Y. This is done to obtain stars of grossly the same Teff’s in all four simulations. The luminosity of the tracks increases with Y, so we adjust the distance modulus to fit the different simulations to the data. The HB luminosity fit requires an increase by 0.04 mag, and the average period of the RR Lyr increases from 0.644 d to 0.742 d, passing from the simulation of panel a to d. Considering that the mean period of a-b type RR Lyr is 0.71 d in this cluster (Pritzl et al., 2001), and the uncertainty in the metallicity, the agreement can be considered good for all the simulations. The determination of the helium content from the RR Lyr confirms that it must be large, in the range Y=0.32–0.36.
The right panels in Fig. 7 show Ysurf in the different simulations. We see that in the panel a all the stars deplete the surface helium when they cross the standard G–jump: this indicates that Y=0.34 is not sufficient to provoke the shift of the main G–jump. In panels b and c, a fraction of the stars, with Y=0.35, shifts full He–settling to 12500 K, and panel d shows that most stars preserve a non negligible helium content up to Teff13,000 - 13,500 K if Y=0.37 in between the two G–jumps. These simulations show that a stable atmosphere and radiative levitation of metals may occur at higher Teff than in standard clusters, as shown in Brown et al. (2016). Accordingly, the effect of survival of the convection region described in § 3 for the tracks evolving from low to high Teff becomes efficient enough only when Y=0.35-0.37 in the G–jump Teff range.
The standard G–jump at Teff=11,500K is not evident in the data of NGC 6441 (a small stellar sample is available), while it might be present in NGC 6388 (Brown et al., 2016). Anyway, panel c in Figure 7 suggests that a standard G–jump could also be present and coexist with the hotter G–jump in these clusters.
If the helium abundance in the Teff range 11,500–13,500 K is not negligible, it could be revealed by appropriate observations. In spite of the very high initial Y, a fraction of stars should show 0Ysurf0.2, and should not display peculiarly large metal abundances.
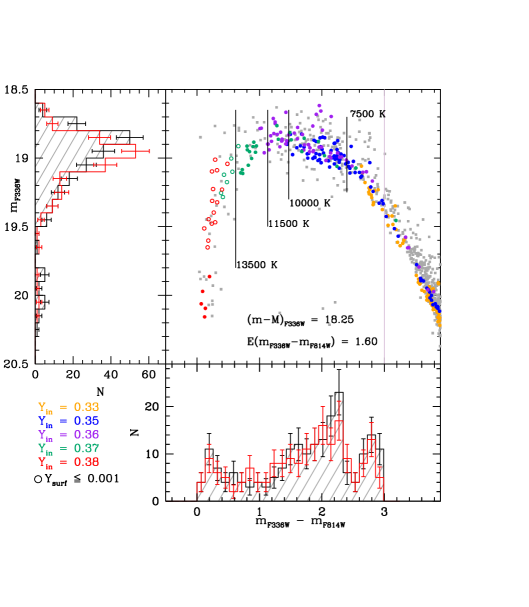
4.2 Two simulations for the blue HB
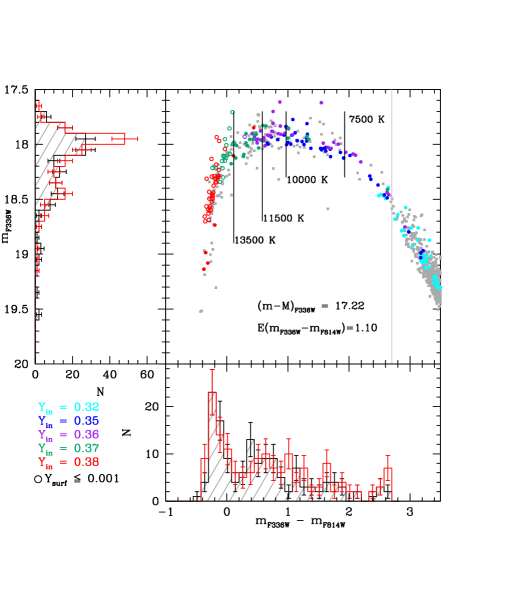
The simulations exemplified in Figure 8 and 9 have helium distributions chosen according to panel d of Fig. 7 for both NGC 6388 NGC 6441. The data are shifted in distance modulus and dereddened according to the labels in the figures, to be superimposed to the simulation points. The comparison is made through the number versus magnitude mF336W histograms, where the data are shown as dashed grey histograms in the left panel. The histograms represented in the bottom panel of both Figs. 8 and 9 show the stellar counts versus color, limited to mF336W–mF814W=2.7 and to mF336W–mF814W=3.0 respectively. The simulation correctly describes the rapid excursion from the red to the blue side in both clusters, evident in the very low stellar counts at Teff7,500 K. Different colors identify stars extracted in the different groups of helium, as labelled. The main inputs of the simulations are in Table 1. We use four groups of Y uniformly spaced for the bluest part of the branch. The mass loss M during the red giant evolution is assumed to be slightly higher for the Y=0.37 and 0.38 groups, to allow a better fit of the morphology in the chosen schematization. The number versus Y distribution is flat in the case of NGC 6388, and it is monotonically decreasing for NGC 6441, but no variations in the numbers are artificially introduced to reproduce the number vs.color discontinuities. In particular, we see that the dip in the counts for NGC 6388 at the right of the Teff=13,500 K boundary is all contained within the same helium (Y=0.37) and mass loss group, so it reflects mainly the Teff versus time evolution of the tracks, the effect of helium settling and the onset of the G–jump. In the case of NGC 6441 the situation is similar, but the scarcity of data does not allow a more stringent comparison.
| NGC 6441 | NGC 6388 | |||||
|---|---|---|---|---|---|---|
| M)=0.01 | M)=0.01 | |||||
| Y | N | (M/M⊙) | Y | N | (M/M⊙) | |
| 0.33 | 90 | 0.170 | 0.32 | 40 | 0.185 | |
| 0.35 | 90 | 0.170 | 0.35 | 40 | 0.185 | |
| 0.36 | 60 | 0.170 | 0.36 | 40 | 0.185 | |
| 0.37 | 30 | 0.185 | 0.37 | 40 | 0.195 | |
| 0.38 | 20 | 0.208 | 0.38 | 40 | 0.204 | |
5 Discussion
We use new models including helium diffusion to model the evolution of the He convective regions, which reflects in the possible survival of surface turbulence in HB stars of Teff larger than the G–jump location. The standard location at Teff=11,500 K corresponds to the onset of full H-ionization in the envelopes. We have shown that turbulence may survive at larger Teff only if models evolve from lower to larger Teff, as it only occurs at high metallicity and high helium content (Sweigart & Gross, 1976; Caloi & D’Antona, 2007).
We have analyzed the distribution of HB stars in the two peculiar clusters NGC 6388 and NGC 6441 based on observations taken within the HST UV Legacy Treasury data (Piotto et al., 2015) an the ACS GC Survey (Sarajedini et al., 2007). This new analysis provides a further strong evidence for the presence of stars with very large initial helium content in these clusters. In particular:
-
1.
We confirm the result (Caloi & D’Antona, 2007; Busso et al., 2007) that a huge helium range (Y0.13 in our models) is necessary to understand the extension of the HB to large Teff’s, atypical for the relatively high metallicity of the stars in these clusters; a large helium spread (Y0.08–0.1) is already present among the stars populating the red side of the HB. This is shown by the comparison of the tracks with the data in the clump;
-
2.
Y values in the range 0.34–0.38 for the tracks crossing the RR Lyr region provide periods consistent with the long periods of the RR Lyrs in these clusters;
-
3.
the discontinuity in the distribution of stars at Teff7500 K is a result of the rapid excursion of the tracks evolving from the red to the blue side of the HB, and thus a further signal of high Y at these Teff’s.
-
4.
HB tracks including helium atomic diffusion and a parametric treatment of metal levitation model the interaction between the timescales of diffusion of helium and the timescale of the Teff evolution of the tracks.
-
5.
the analysis of the blue HB side shows that we expect that the G–jump is occurring at Teff larger than the standard G–jump Teff, due to the peculiar shape of high–helium evolutionary tracks. High–Y high–Z models cross the color magnitude diagram from low to high Teff (Sweigart & Gross, 1976; Caloi & D’Antona, 2007), on a timescale short enough to allow the survival of the helium partial ionization regions at Teff11,500 K; this is an additional proof that the blue HB subset of stars in NGC 6388 and NGC 6441 have large helium abundance;
-
6.
for the set of computed models (Z=0.006 and [/Fe]=0.4), the helium contents which may justify the presence of the hotter G–jump are in the range Y=0.36–0.38;
-
7.
the data for NGC 6388 show also the presence of a standard G–jump at Teff11,500 K (Brown et al., 2016). If this is the case, some of the stars in between the two G–jumps may have achieved full helium settling. This is consistent with the simulations of stars with initial Y=0.35 - 0.36 (panel b-c of Fig. 7) crossing the Teff region between the two jumps;
-
8.
observations aimed at measuring the helium and metal content in the atmospheres of HB stars in the range 11,500 Teff 13,500 K may confirm this model;
-
9.
in all other galactic GCs, the metallicity is generally smaller and the HB tracks evolve towards the G–jump from hotter Teff for any Y value. Models show that helium is substantialy depleted and the envelope is radiatively stable in these stars, so that there is a sudden onset of convection below Teff=11,500 K, when hydrogen is partially recombined. The radiative levitation of metals sharply ends at this single Teff, whatever the initial Y value of these stars. This is probably the reason why the G–jump location in all cluster occurs at the same Teff (Brown et al., 2016), in spite of the possible differences in the initial helium abundance of the second generation stars at the G–jump.
Acknowledgments
Support for program GO-13297 was provided by NASA through a grant from the Space Telescope Science Institute, which is operated by the Association of Universities for Research in Astronomy, Inc., under NASA contract NAS 526555.
M.T., F.DA., S.C. and G.P. acknowledge partial support by PRIN-INAF 2014 (PI: S. Cassisi). G.P. also acknowledges partial support by the Universit degli Studi di Padova - Progetto di Ateneo CPDA141214 ”Towards understanding complex star formation in Galactic globular clusters”.
M.D.C. acknowledges the contribution of the FP7 SPACE project ASTRODEEP (Ref. No. 312725), supported by the European Commission.
A.P.M. and A.F.M. have been supported by the Australian Research Council through Discovery Early Career Researcher Awards DE150101816 and DE160100851
References
- Bedin et al. (2004) Bedin L. R., Piotto G., Anderson J., Cassisi S., King I. R., Momany Y., Carraro G., 2004, ApJ, 605, L125
- Behr (2003) Behr B. B., 2003, ApJS, 149, 67
- Behr et al. (2000) Behr B. B., Djorgovski S. G., Cohen J. G., McCarthy J. K., Côté P., Piotto G., Zoccali M., 2000, ApJ, 528, 849
- Bellini et al. (2013) Bellini A., et al., 2013, ApJ, 765, 32
- Brown et al. (2001) Brown T. M., Sweigart A. V., Lanz T., Landsman W. B., Hubeny I., 2001, ApJ, 562, 368
- Brown et al. (2016) Brown T. M., et al., 2016, preprint, (arXiv:1603.07651)
- Busso et al. (2007) Busso G., et al., 2007, A&A, 474, 105
- Caloi & D’Antona (2007) Caloi V., D’Antona F., 2007, A&A, 463, 949
- Carretta et al. (2007) Carretta E., et al., 2007, A&A, 464, 967
- Castelli & Kurucz (2004) Castelli F., Kurucz R. L., 2004, ArXiv Astrophysics e-prints,
- D’Antona & Caloi (2004) D’Antona F., Caloi V., 2004, ApJ, 611, 871
- D’Antona & Caloi (2008) D’Antona F., Caloi V., 2008, MNRAS, 390, 693
- D’Antona et al. (2002) D’Antona F., Caloi V., Montalbán J., Ventura P., Gratton R., 2002, A&A, 395, 69
- D’Antona et al. (2005) D’Antona F., Bellazzini M., Caloi V., Pecci F. F., Galleti S., Rood R. T., 2005, ApJ, 631, 868
- D’Antona et al. (2013) D’Antona F., Caloi V., D’Ercole A., Tailo M., Vesperini E., Ventura P., Di Criscienzo M., 2013, MNRAS, 434, 1138
- D’Antona et al. (2016) D’Antona F., Vesperini E., D’Ercole A., Ventura P., Milone A. P., Marino A. F., Tailo M., 2016, MNRAS, 458, 2122
- Di Criscienzo et al. (2011) Di Criscienzo M., et al., 2011, MNRAS, 414, 3381
- Di Criscienzo et al. (2015) Di Criscienzo M., Tailo M., Milone A. P., D’Antona F., Ventura P., Dotter A., Brocato E., 2015, MNRAS, 446, 1469
- Gratton et al. (2010) Gratton R. G., Carretta E., Bragaglia A., Lucatello S., D’Orazi V., 2010, A&A, 517, A81
- Gratton et al. (2011) Gratton R. G., Lucatello S., Carretta E., Bragaglia A., D’Orazi V., Momany Y. A., 2011, A&A, 534, A123
- Gratton et al. (2014) Gratton R. G., et al., 2014, A&A, 563, A13
- Grundahl et al. (1998) Grundahl F., VandenBerg D. A., Andersen M. I., 1998, ApJ, 500, L179
- Grundahl et al. (1999) Grundahl F., Catelan M., Landsman W. B., Stetson P. B., Andersen M. I., 1999, ApJ, 524, 242
- Iben & MacDonald (1985) Iben Jr. I., MacDonald J., 1985, ApJ, 296, 540
- LeBlanc et al. (2009) LeBlanc F., Monin D., Hui-Bon-Hoa A., Hauschildt P. H., 2009, A&A, 495, 937
- LeBlanc et al. (2010) LeBlanc F., Hui-Bon-Hoa A., Khalack V. R., 2010, MNRAS, 409, 1606
- Lim et al. (2015) Lim D., Han S.-I., Roh D.-G., Lee Y.-W., 2015, Publication of Korean Astronomical Society, 30, 255
- Marino et al. (2011) Marino A. F., Villanova S., Milone A. P., Piotto G., Lind K., Geisler D., Stetson P. B., 2011, ApJ, 730, L16
- Marino et al. (2012) Marino A. F., et al., 2012, A&A, 541, A15
- Marino et al. (2013) Marino A. F., Milone A. P., Lind K., 2013, ApJ, 768, 27
- Michaud et al. (2007) Michaud G., Richer J., Richard O., 2007, ApJ, 670, 1178
- Michaud et al. (2008) Michaud G., Richer J., Richard O., 2008, ApJ, 675, 1223
- Michaud et al. (2011) Michaud G., Richer J., Richard O., 2011, A&A, 529, A60
- Milone & et al. (2016) Milone A. P., et al. 2016, preprint, (arXiv:submitted)
- Milone et al. (2012) Milone A. P., et al., 2012, ApJ, 744, 58
- Milone et al. (2014) Milone A. P., et al., 2014, ApJ, 785, 21
- Moehler et al. (1999) Moehler S., Sweigart A. V., Landsman W. B., Heber U., Catelan M., 1999, A&A, 346, L1
- Moehler et al. (2014) Moehler S., Dreizler S., LeBlanc F., Khalack V., Michaud G., Richer J., Sweigart A. V., Grundahl F., 2014, A&A, 565, A100
- Momany et al. (2004) Momany Y., Bedin L. R., Cassisi S., Piotto G., Ortolani S., Recio-Blanco A., De Angeli F., Castelli F., 2004, A&A, 420, 605
- Moni Bidin et al. (2007) Moni Bidin C., Moehler S., Piotto G., Momany Y., Recio-Blanco A., 2007, A&A, 474, 505
- Moni Bidin et al. (2009) Moni Bidin C., Moehler S., Piotto G., Momany Y., Recio-Blanco A., 2009, A&A, 498, 737
- Moni Bidin et al. (2012) Moni Bidin C., Villanova S., Piotto G., Moehler S., Cassisi S., Momany Y., 2012, A&A, 547, A109
- Norris (2004) Norris J. E., 2004, ApJ, 612, L25
- Origlia et al. (2008) Origlia L., Valenti E., Rich R. M., 2008, MNRAS, 388, 1419
- Piotto et al. (2002) Piotto G., et al., 2002, A&A, 391, 945
- Piotto et al. (2007) Piotto G., et al., 2007, ApJ, 661, L53
- Piotto et al. (2012) Piotto G., et al., 2012, ApJ, 760, 39
- Piotto et al. (2015) Piotto G., et al., 2015, AJ, 149, 91
- Pritzl et al. (2000) Pritzl B., Smith H. A., Catelan M., Sweigart A. V., 2000, ApJ, 530, L41
- Pritzl et al. (2001) Pritzl B. J., Smith H. A., Catelan M., Sweigart A. V., 2001, AJ, 122, 2600
- Recio-Blanco et al. (2004) Recio-Blanco A., Piotto G., Aparicio A., Renzini A., 2004, A&A, 417, 597
- Rich et al. (1997) Rich R. M., et al., 1997, ApJ, 484, L25+
- Salaris et al. (2008) Salaris M., Cassisi S., Pietrinferni A., 2008, ApJ, 678, L25
- Sarajedini et al. (2007) Sarajedini A., et al., 2007, AJ, 133, 1658
- Sweigart (1997) Sweigart A. V., 1997, ApJ, 474, L23
- Sweigart & Gross (1976) Sweigart A. V., Gross P. G., 1976, ApJS, 32, 367
- Tailo et al. (2015) Tailo M., et al., 2015, Nature, 523, 318
- Tailo et al. (2016) Tailo M., Di Criscienzo M., D’Antona F., Caloi V., Ventura P., 2016, MNRAS, 457, 4525
- Thoul et al. (1994) Thoul A. A., Bahcall J. N., Loeb A., 1994, ApJ, 421, 828
- Ventura et al. (2008) Ventura P., D’Antona F., Mazzitelli I., 2008, Ap&SS, 316, 93
- Yong et al. (2009) Yong D., Grundahl F., D’Antona F., Karakas A. I., Lattanzio J. C., Norris J. E., 2009, ApJ, 695, L62
- Yong et al. (2015) Yong D., Grundahl F., Norris J. E., 2015, MNRAS, 446, 3319