Strong Evidence Against A Non-Degenerate Companion in SN 2012cg
Abstract
Even though SN 2012cg is one of the best-studied Type Ia Supernovae to date, the nature of its progenitor system has been debated in numerous studies. Specifically, it is difficult to reconcile recent claims of the detection of a main-sequence companion with recent deep, late-time H flux limits. In this study we add three new constraints: 1) We analyze new high-signal-to-noise, nebular-phase, LBT/MODS spectrum of SN 2012cg and place an upper limit on the amount of low-velocity, solar-abundance material removed from a possible companion of . 2) We use Swift X-ray observations to constrain the preexplosion mass-loss rate to be for . 3) We carefully reanalyze a prediscovery MASTER image and, with published light curves of SN 2012cg, we estimate the time of first light and conservatively constrain the radius of a Roche-lobe overflowing companion to be . These observations disagree with a large nearby companion, and, when considered with other studies of SN 2012cg’s progenitor system, essentially rule out a non-degenerate companion.
Subject headings:
supernovae: specific (SN 2012cg)1. Introduction
The physical nature of the progenitor systems of Type Ia Supernovae (SNe Ia) remains largely elusive despite decades of work (for a review see Wang & Han, 2012). It is generally accepted that SNe Ia result from the thermonuclear explosion of a carbon-oxygen white dwarf (WD; Hoyle & Fowler, 1960) in a close binary system, but there are still two competing classes of models. In the double-degenerate (DD) model, the WD’s companion is another WD where the binary merges either due to the removal of energy and angular momentum from the system by gravitational radiation (Tutukov & Yungelson, 1979; Iben & Tutukov, 1984; Webbink, 1984) or due to the perturbations of a third (e.g., Thompson, 2011; Katz & Dong, 2012; Shappee & Thompson, 2013; Antognini et al., 2014) or fourth (Pejcha et al., 2013) body. In the single-degenerate (SD) model, the WD’s companion is a non-degenerate star (Whelan & Iben, 1973; Nomoto, 1982). In most current models, the WD accretes matter from the non-degenerate companion until the WD undergoes unstable runaway nuclear burning. However, many current explosion simulations of both SD (e.g. Kasen et al., 2009) and DD (e.g. Pakmor et al., 2012) progenitors can match the observable signatures of SNe Ia around -band maximum light (), and observational searches for distinguishing characteristics between these two models have proven difficult.
Despite these challenges, significant progress has been made during the past decade, and some classes of SD models have been observationally ruled out as the dominant channel (e.g., Bianco et al., 2011; Lipunov et al., 2011; Chomiuk et al., 2016; Maguire et al., 2016). However, there are still candidate SD progenitor systems (e.g. U Sco and V445 Pup; Li et al., 2011). Additionally, in the past few years, detailed studies of individual nearby SNe Ia have proven particularly fruitful. A prime example is SN 2011fe (Nugent et al., 2011a), the brightest SN Ia in almost 40 years at just 6.4 Mpc away (Shappee & Stanek, 2011), which was discovered by the Palomar Transient Factory (PTF; Law et al., 2009) less than one day after explosion. For SN 2011fe, none of the observational signatures expected for SD channels have been seen (Horesh et al., 2012; Chomiuk et al., 2012b; Margutti et al., 2012; Brown et al., 2012; Shappee et al., 2013b), while early-light-curve properties (Piro et al., 2010; Nugent et al., 2011b; Bloom et al., 2012) and direct evidence for nuclear synthetic yields argue for a DD channel (Shappee et al., 2017). However, there might be multiple channels for producing normal SNe Ia (e.g., Maguire et al., 2013; Yamaguchi et al., 2015), so additional well-studied SNe Ia are needed.
In the SD model, the companion is expected to be struck by the SN ejecta soon after explosion. This feature of the SD model has proven to be a fruitful observational test. First, the interaction of the SN ejecta with the companion will modify the rising light curve at early times. Such a signature is dependent on the viewing angle, and the strongest effect will occur when the companion lies along the line of sight between the observer and the SN. At a fixed viewing angle, this emission scales proportionally with the companion’s radius (), which allows early-time observations to constrain the properties of the companion (Kasen, 2010). Second, material from the companion will be stripped when struck by the SN ejecta (e.g., Wheeler et al., 1975; Marietta et al., 2000; Meng et al., 2007; Pakmor et al., 2008; Pan et al., 2012b; Liu et al., 2012). Pan et al. (2012b) and Liu et al. (2012) use hydrodynamic simulations to show that of solar-metallicity material is expected to be removed from main-sequence (MS) companions and that this material will be embedded in low-velocity supernova debris with a characteristic velocity of 1000 . Initially, this material will be hidden by the higher-velocity, optically thick, iron-rich ejecta, but will then appear in late-time, nebular-phase spectra ( days; Mattila et al., 2005) as the higher-velocity ejecta become optically thin. Finally, this impact is expected to affect the companion’s future properties (Podsiadlowski, 2003; Pan et al., 2012a; Shappee et al., 2013a).
The Lick Observatory Supernova Search (LOSS; Filippenko et al., 2001) discovered the nearby SN 2012cg in NGC 4424 (; Kent et al., 2008) on 2012 May 17.2 UT (MJD = 56064.22) and quickly announced it to the community (Cenko et al., 2012). Munari et al. (2013) determined was 2012 June 4.5 UT (MJD=56082.0). At just Mpc ( mag; Cortés et al., 2008), SN 2012cg has been an ideal candidate for extensive follow-up with multiwavelength studies in the radio (Chomiuk et al., 2012a, 2016), the far-infrared (far-IR) with Herschel (Johansson et al., 2013), the IR with the Hubble Space Telescope (HST; Amanullah et al., 2015), the optical from the ground (Silverman et al., 2012; Munari et al., 2013; Yamanaka et al., 2014; Amanullah et al., 2015; Maguire et al., 2016; Marion et al., 2016) and HST (Amanullah et al., 2015; Graur et al., 2016), the ultraviolet (UV) with Swift (Marion et al., 2016) and HST (Amanullah et al., 2015), and X-rays with Swift (Margutti & Soderberg, 2012).
However, even though SN 2012cg is one of the best-studied SNe Ia to date, the nature of its progenitor remains debated in a number of studies:
(1) Silverman et al. (2012) claim that their early-time observations from the 0.76m Katzman Automatic Imaging Telescope (KAIT) rule out a ( ) main-sequence companion for certain viewing angles and red-giant companions ( ) for almost all viewing angles.
(2) Marion et al. (2016) use the same KAIT observations with additional observations from the F. L. Whipple Observatory 1.2m (FLWO), the Las Cumbres Observatory Global Telescope Network (LCOGT; Brown et al., 2013), Swift, and ROTSE-IIIb (Akerlof et al., 2003) to argue that they see a blue, early-time excess in the optical light curve consistent with the Kasen (2010) models of the SN ejecta interacting with a main-sequence companion.
(3) Chomiuk et al. (2012a, 2016) observed SN 2012cg with the Karl G. Jansky Very Large Array to place some of the deepest radio limits of any SNe Ia.111Only SN 2011fe and SN 2014J have deeper limits in the radio. The resulting limits on any preexisting wind are inconsistent with those observed for symbiotic binaries and most isolated red giants (Chomiuk et al., 2016). Main-sequence B stars with 6 M⊙ may, however, be consistent with the radio limits so long that the mass transfer from the companion to the WD is very conservative.
(4) Maguire et al. (2013) obtained Very Large Telescope (VLT) XShooter spectra of SN 2012cg and days after . They detected blueshifted NaI D absorption that was taken to be tentative evidence for previous mass loss from an SD progenitor. However, Maguire et al. (2013) note that recent DD models (e.g., Shen et al., 2013; Raskin & Kasen, 2013) can also reproduce their observations.
(5) Maguire et al. (2016) use VLT spectra from XShooter and FORS2 acquired days after to constrain late-time H flux from SN 2012cg. Using scaled models from Mattila et al. (2005), Maguire et al. (2016) placed a strong limit of on the amount of solar-metallicity material present at low velocity, 1000 , in SN 2012cg. This limit strongly disfavors a hydrogen-rich SD companion in the progenitor system of SN 2012cg (Maguire et al., 2016). Additionally, Maguire et al. (2016) find no evidence for low velocity, 1000 , He emission at 5876, 10830, and 20590 Å in their XShooter visible and near-IR (NIR) spectra. However, no theoretical model predictions of the peak luminosity for these He features exist and it is not clear if these observations rule out material removed from a He star companion.
(6) Graur & Maoz (2012) used archival HST preexplosion images of NGC 4424 to obtain magnitude limits on the progenitor system of and mag. These limits rule out most supergiants as a possible binary companion.
(7) Graur et al. (2016) observed SN 2012cg to very late times with HST and claim their observations are better described by the nuclear synthetic yields expected from a progenitor white dwarf with a mass near the Chandrasekhar limit. However, these observations are in a single long-pass filter making the measured decay sensitive to changes in the underlying spectral energy distribution. Graur et al. (2016) also note that their observations are consistent with a light echo.
(8) Liu & Stancliffe (2016) attempted to reconcile these observational studies with theoretical predictions from binary evolution and population-synthesis calculations for a range of progenitor scenarios. They find that either a SD progenitor with a 6 M⊙ MS companion or a DD model with carbon-oxygen WD donor might be the progenitor of SN 2012cg, but both scenarios are in conflict with at least some of the reported observations. The most difficult observations to reconcile are the early-time light-curve detection from Marion et al. (2016) and the late-time hydrogen limits from Maguire et al. (2016).
In this study, we add a new late-time H constraint, a new X-ray constraint, and reanalyze a timely prediscovery photometric observation of SN 2012cg. Our findings agree with the Maguire et al. (2016) H limits and disagree with the Marion et al. (2016) claim of an excess in the early-time light curve from SN 2012cg. When our constraints are considered with other studies of SN 2012cg’s progenitor system, the available observations strongly favor a DD progenitor. In Section 2, we present our new deep nebular phase spectra and place a limit on the amount of hydrogen-rich, low-velocity material possible in SN 2012cg. In Section 3, we describe and discuss Swift X-ray observations and limits. In Section 4, we present the MASTER photometry, refit the early-time light curve, and place constraints on the presence of a non-degenerate companion. Finally, in Section 5, we discuss the observational constraints on SN 2012cg and conclude that a DD model is the most likely progenitor of SN 2012cg.
2. The Search for Companion Material
In this section, we place a deep and constraining limit on the presence of hydrogen-rich, low-velocity material in SN 2012cg. We obtained a high-signal-to-noise spectrum of SN 2012cg 286 days after (MJD = 56368.3) using the Large Binocular Telescope (LBT) + Multi-Object Double Spectrographs (MODS; Pogge et al., 2010). We obtained s exposures through a wide slit. The spectra reduction was the same as described in Shappee et al. (2013b). We estimate that our absolute flux calibration around H to be accurate to or better.
To place an H limit from the spectrum of SN 2012cg we followed the methods presented in Leonard (2007) as described in Shappee et al. (2013b). Briefly, we first smooth the spectrum on a scale much larger than the expected width of an H feature. Varying the smoothing width from 100 - Å lead to no significant differences. We then subtract off this smoothed spectrum and look for any excess flux in the residuals around H. Our nebular phase spectrum and continuum fit in the vicinity of H are shown in the top panel of Figure 1 binned to their approximate spectral resolution. We searched for H emission within ( Å) about H at the redshift of NGC 4424. We note that this width is wider and thus more conservative than the Mattila et al. (2005) analysis. There is no evidence for any H emission in the spectrum.
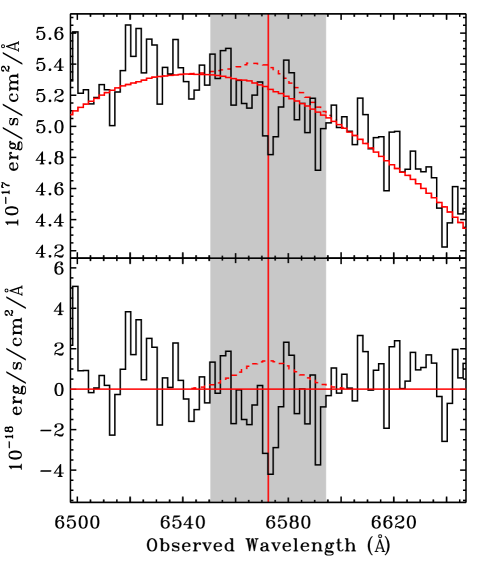
To quantify our limit we use equation 1 of Leonard (2007) leading to a upper limit on the equivalent width of Å assuming a full-width at half-maximum of the H spectral feature is Å.
To translate this equivalent width limit into a constraint on the amount of material stripped from a non-degenerate companion, we follow Leonard (2007) and Shappee et al. (2013b) by scalling from the results of Mattila et al. (2005). After accounting for the distance to NGC 4424 and the measured extinction of SN 2012cg, we place an upper limit on the amount of solar-abundance material in SN 2012cg of . This limit agrees with the limit reported by Maguire et al. (2016), who also scale from the Mattila et al. (2005) 380-day model. However, because our observation was acquired earlier (286 vs. days after ), when a given mass of material is expected to be more luminous, we view our limit as even more conservative.
3. Swift X-ray Limits
In this section, we analyze Swift X-ray data obtained for SN 2012cg and place limits on the mass-loss rate and wind velocity from its progenitor system. X-ray emission in a young SN originates from the SN shock interaction with the circumstellar medium (CSM). It directly depends on both the properties of the SN explosion (i.e. shock velocity, ejecta mass) and the properties of the environment (i.e. the amount of mass previously ejected by the stellar progenitor). Depending on these properties, different emission processes are expected to contribute to the observed X-rays, in particular: (i) Inverse Compton (IC) scattering of photospheric optical photons off of relativistic electrons accelerated by the SN shock, (ii) synchrotron emission from the same population of accelerated electrons, and (iii) thermal bremsstrahlung. In the low-density regime expected around Type Ia SN progenitors ( M⊙ yr-1; Chomiuk et al., 2016), IC emission has been shown to dominate the X-ray emission at days (Margutti et al., 2012; see Chevalier & Fransson, 2006 for a review). In Section 3.1 we describe the Swift observations, and we constrain the 0.3-10 keV X-ray flux. In Section 3.2, we place limits on SN 2012cg’s progenitor system mass-loss rate.
3.1. Swift-XRT Observations
The X-Ray Telescope (XRT, Burrows et al. 2005) on board the Swift satellite (Gehrels et al., 2004) started observing SN 2012cg on 2012 May 18 UTC () and carried out an extensive follow-up campaign. Here we concentrate on observations obtained within days of explosion (), which offer the best opportunity to constrain the presence of X-ray radiation originating from IC emission. The XRT data were analyzed using HEASOFT (v6.15) and corresponding calibration files. We used standard filtering and screening criteria.
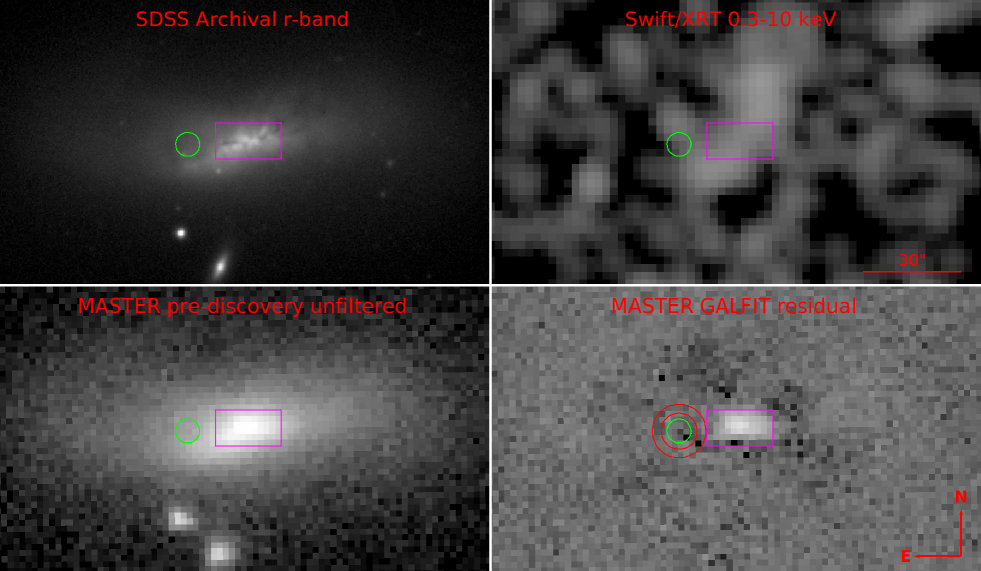
Combining the 24.7 ks of Swift/XRT data collected in this time interval, we find no evidence for X-ray emission from a point source at the position of SN 2012cg, with a 3 count-rate limit of (0.3-10 keV). Unfortunately, unresolved diffuse X-ray emission from the host galaxy prevents us from obtaining a deeper limit. Figure 2 shows the Swift/XRT 0.3-10 keV X-ray image. The Galactic neutral hydrogen column density in the direction of SN 2012cg is (Kalberla et al., 2005). From the measured total reddening and assuming a Galactic dust-to-gas ratio, we infer an intrinsic . With these parameters and adopting an absorbed power-law spectral model with photon index (see Section 3.2), the count-rate limit above translates into an unabsorbed flux limit , corresponding to (0.3-10 keV).
3.2. Constraints on the progenitor system mass-loss rate from X-ray observations
To place constraints on the progenitor-system mass-loss rate, we adopted the generalized IC formalism developed in Margutti et al. (2012). We assumed the following: 1) The SN outer density structure is with (Matzner & McKee, 1999). 2) The electrons are accelerated by the SN shock in a power-law distribution with , as found from radio observations of hydrogen-stripped SN explosions (e.g. Soderberg et al. 2006). Thus we expect a photon index . 3) The fraction of post-shock energy density in relativistic electrons is where the limit on the density scales as . (See Appendix A in Margutti et al. 2012.)
We next estimated the bolometric luminosity of SN 2012cg, which is required to translate the X-ray flux limit into a physical limit on mass loss in the progenitor system. We used the UV through NIR photometry published by Marion et al. (2016). For each epoch, we corrected for the observed extinction and distance to NGC 4424 and then integrated the flux density over the wavelength range of the observations. We lack NIR measurements after 9 days past , so we linearly extrapolated the NIR photometry and added a conservative error estimate. For a 10,000 K blackbody, the amount of flux falling outside the wavelength range covered by the photometry is %. We adopt this correction to reconstruct the bolometric luminosity of SN 2012cg around the time of the optical peak.
By combining the bolometric light curve with the X-ray limits calculated in Section 3.1, we can constrain the environment density around SN 2012cg. For an ISM medium where , we derive . However, a star that has been losing material at constant rate gives rise to a wind-like CSM where , where is the wind velocity. For a wind-like medium, we infer for .
In Figure 3, we compare these limits to published limits (Margutti et al., 2012, 2014; Russell & Immler, 2012) and candidate SNe Ia progenitor systems. We find that, because of the X-ray emission from the host galaxy, our Swift/XRT limits are not very constraining. We can rule out only a fraction of symbiotic progenitor systems, and we would not expect to detect signatures from MS or subgiant companions.

4. Early-time Light Curve and Companion Constraints
If the progenitor of an SN Ia is a WD accreting from a non-degenerate companion, then the SN ejecta will interact with the companion and potentially produce an observable feature in the rising light curve at early times. Such a signature is dependent on the viewing angle, with the strongest effect occurring when the companion lies along the line of sight between the observer and the SN. At a fixed viewing angle, this emission scales proportionally with .
In this section, we constrain the radius of a possible companion in the progenitor system of SN 2012cg using its very early-time light curve. In Section 4.1, we introduce light curves from Marion et al. (2016). In Section 4.2 we present three prediscovery observations that were not included in the analysis of Marion et al. (2016). In Section 4.3, we closely follow the methods of Shappee et al. (2016) to fit the early-time light curves and constrain the time of first light (). Finally, in Section 4.4, we use these observations, our estimate of , and the interaction models of Kasen (2010) to place stringent limits on .
4.1. KAIT, LCOGT, FLWO, Swift, and ROTSE Observations
We use the optical photometry published by Marion et al. (2016) from KAIT (, , , and ), FLWO (, , , , and ), LCOGT ( and ), ROTSE-IIIb (unfiltered but calibrated to -band), and the UV/Optical Telescope (UVOT; Roming et al., 2005) on board Swift (, , and ). The NIR observations from the Peters Automated Infrared Imaging Telescope presented in Marion et al. (2016) were not acquired early enough to be useful for fitting or constraining a possible companion, and they are not used in this section. Additionally, there were only 2, 2, and 3 Swift UV observations in the , , and filters within 6 days of discovery, respectively333We note that only two of the first three observations are shown in Figure 5 of Marion et al. (2016)., so these observations are also not useful for constraining but are discussed in Section 5.
We transformed the Swift and observations to Bessel and bands, respectively, using the UVOT-Johnson color corrections444http://heasarc.gsfc.nasa.gov/docs/heasarc/caldb/swift/docs/uvot/uvot
_caldb_coltrans_02b.pdf derived from the Pickles stars. These transformations are small, mag, and do not qualitatively affect our results. We transformed the Swift into AB-magnitudes using the transformations presented on the Swift website555http://swift.gsfc.nasa.gov/analysis/uvot_digest/zeropts.html and, compare it directly Sloan data because the filter response functions are somewhat similar. However, when interpreting the -band observations care should be taken for two reasons. First, SNe Ia have strong Ca II H&K lines (3945 Å) that rapidly change in strength and velocity in their early-time spectra. Furthermore, Ca II H&K is located right on the edge of -band. Second, the Sloan and Swift are not the same filter and the earth’s atmosphere substantially affects . Thus, a careful -corrections are required to correct for the differences in the actual band passes which is beyond the scope of this paper. Unfortunately, the ground-based -band observations start too late to be useful on their own in constraining the presence of a potential companion. Thus we include the Swift observations because they do not qualitatively affect our fits, were already shown in Marion et al. (2016), and are potentially useful when comparing with the ground-based -band photometry. However, we strongly warn the reader about their reliability.
4.2. Prediscovery Observations
There have been three prediscovery observations reported in the literature:
(1) The previous KAIT observation of the host galaxy of SN 2012cg was on 2012 May 12.3 UTC (), 4.9 days before discovery (Silverman et al., 2012).
(2) Cortini et al. (2012) report a 19.0 magnitude unfiltered upper limit using a Celestron C14 telescope + Starlight X-Press SXVR H9 camera on 2012 May 14.9 UTC (), 2.6 days before discovery. The Starlight X-Press SXVR H9 camera’s efficiency peaks at 5400Å666https://www.sxccd.com/handbooks/SXVF-H9%20handbook.pdf, and Silverman et al. (2012) report this limit as band. Calibrating an unfiltered observation to a red filter is a conservative when placing constraints on a possible shock interaction because the interaction is expected to be stronger at shorter wavelengths.
(3) As part of the ongoing MASTER survey (Lipunov et al., 2010), we acquired an unfiltered prediscovery image on 2012 May 15.79 UTC (), 1.43 days before discovery. Lipunov & Krushinsky (2012) report a marginal detection of SN 2012cg at mag in this image.
In an attempt to verify the prediscovery MASTER detection, we reanalyze this prediscovery image. Typically, we would use image subtraction to remove the host galaxy light with images taken at the same location and instrument without the SN present. However, no additional images are available without SN 2012cg being present. Instead, we used GALFIT (Peng et al., 2002) to model the large-scale, 2-D light distribution of the galaxy. A nearby star served as a PSF model for the Sersic fit. Neighboring objects were also modeled and simultaneously fit, with initial guesses for the Sersic parameters obtained from SExtractor. The complex structure of the host galaxy warranted two Sersic components, especially given the large residuals from a single-component fit. Indeed, both components provided extended fits to the galaxy light distribution. Additionally, we masked the central region so that the fit would be driven by the smooth extended light at large radii around the SN. Figure 2 presents the SDSS archival -band image, the MASTER prediscovery image, and the GALFIT residual image.
We then performed aperture photometry at the location of SN 2012cg using the IRAF apphot package and calibrated the results to -band. Again, calibrating an unfiltered magnitude to a red filter is a conservative choice. There was no excess flux detected at the location of SN 2012cg, and we place a 3-sigma limit of mag. We note that the SDSS -band image reveals a point source near the location of SN 2012cg. To verify that this source has not substantially affected our limit, we performed aperture photometry on the SDSS -band image and found that this source has , which is significantly fainter than our upper limit. Finally, to verify that any flux from the SN is not impacting the GALFIT fit, we injected artificial sources at the location of the SN in the reduced image, ran GALFIT on the resulting image, and then attempted to recover the source. When injecting 18.5, 19.0 and 19.5 mag sources, we recover each source at , , and mag, respectively. These artificial source tests show that our method effectively removes the galaxy light while not significantly affecting the flux from point sources.
4.3. Early-Time Light Curve Fit
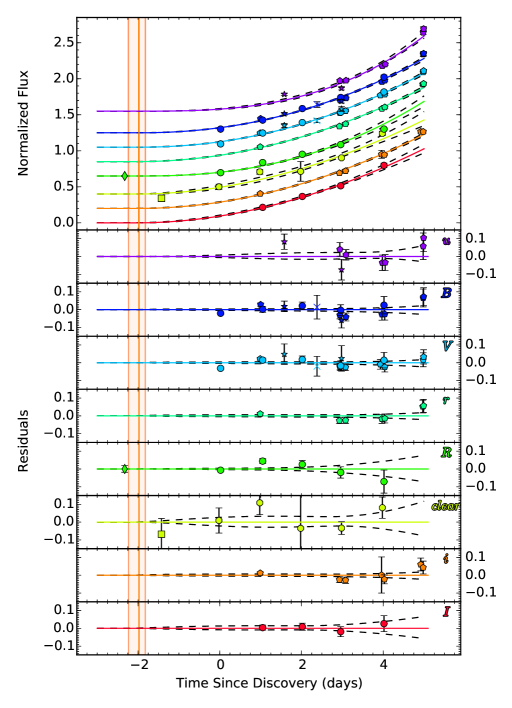
To determine , we followed the methods presented in Shappee et al. (2016). We modeled each band’s photometry as an independent power law with index () but forced all bands to have the same . This approach is motivated by (Piro & Morozova, 2016) who show in their Figure 2 that different band rise at different rates but begin to rise at the same time. We used the emcee package (Foreman-Mackey et al., 2013), a Python-based implementation of the affine-invariant ensemble sampler for Markov chain Monte Carlo (MCMC), to perform the fit to each light curve. As is done in Goobar et al. (2015) and Shappee et al. (2016), we fit the data in flux space (not logarithmic magnitudes) to allow the natural treatment of non-detections. We fit all observations obtained within days of discovery, but the resulting fits were statistically unsatisfactory, at least partially because the photometry reported in Marion et al. (2016) had underestimated errors. We first added 1% error to all the photometry reduce the fits sensitivity to -corrections required to translate between similar filters on different telescopes. This correction was not preformed in Marion et al. (2016) and is beyond the scope of this study. We then scaled the errors for each filter so that per degree of freedom was 1 for the best fit for that filter. Each filter was scaled by a factor of 3 or less, except for and which were scaled by 3 and 5, respectively. We then refit all the observations obtained within days of discovery. The best-fit power laws for each filter and their corresponding 1-sigma uncertainties are shown in Figure 4. We find that JD , implying that SN 2012cg was discovered days after and that days. The best-fit parameters for each band are presented in Table 4.3. We note that the original fit (before scaling errors) is contained within our reported parameter ranges and the main result of increasing the errors is to broaden our uncertainty on .
&
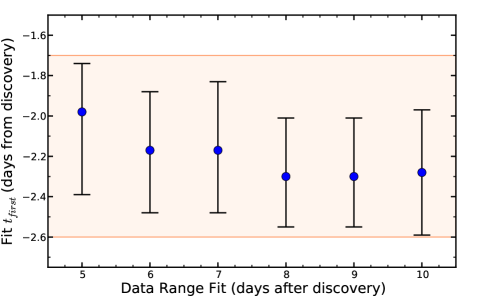
However, the choice in the range of data to fit is somewhat arbitrary. To estimate the systematic errors in our estimate of , we varied the data range and repeated our MCMC fit to the light curves. The resulting and 90% confidence intervals when fitting various data ranges are shown in Figure 5. To be conservative, we adopt the range to days from discovery for when placing progenitor constraints.
4.4. Progenitor System Constraints
To place constraints on the progenitor system of SN 2012cg, we first create absolute-magnitude light curves. As elsewhere in the manuscript, we assume a total reddening of (Amanullah et al., 2015), a ratio of total-to-selective absorption , and a distance of Mpc ( mag). We add the distance modulus errors in quadrature with the photometric errors.
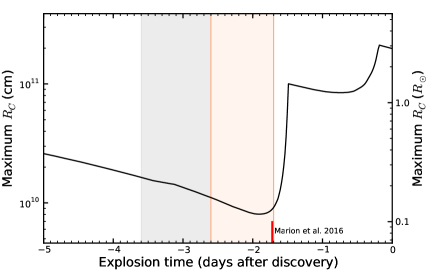
We constrain the radius of a possible non-degenerate companion by using the analytic models provided by Kasen (2010). We note that this is conservative because we are ignoring light from the SN itself and attributing all flux to an interaction with a companion. Because the time of explosion () is uncertain, we explore a variety of and their corresponding constraints on . The general procedure is to choose an and then find the maximum that is consistent with the early-time data, assuming the secondary filled its Roche lobe. This introduces a weak dependence on the mass ratio of the binary, and we simply assume the primary and companion masses of 1.4 and , respectively. The results are summarized in Figure 6, which shows that if is within our conservative estimate of . While and have sometimes been used interchangeably in the literature, differences arise because of a possible dark phase between the explosion and when the SN first starts to brighten (Hachinger et al., 2013; Piro & Nakar, 2014; Piro & Morozova, 2016). Piro & Morozova (2016) showed that even in extreme cases dark phases last days, and more realistically last 1 day. Thus, considering one day before our earliest estimate for is conservative and a possible companion must still be . These estimates assume a viewing angle of 15 degrees, which is more representative than the 0 degree viewing angle shown in the plots of Marion et al. (2016). However, as shown by Kasen (2010) and noted by Marion et al. (2016), the strengthen of the expected signature from a given companion can change by over an order of magnitude based on viewing angle, so a constraint on any given SN Ia needs to be carefully considered.
Although there are a broad range of potential progenitor scenarios, non-degenerate companions can roughly be broken into roughly three main classes: 1) red giant companions with that are similar to the observed binaries RS Oph and T CrB (e.g., Hachisu & Kato, 2001), 2) helium star companions with that are like the helium-nova system V445 Pup (e.g., Kato et al., 2008), or 3) main-sequence or subgiant companions with that are similar to U Sco (e.g., Thoroughgood et al., 2001). Our limits on rule all three of these for all but the most unfavorable viewing angles.
5. Conclusions
Even though SN 2012cg is one of the best-studied SNe Ia to date, the nature of its progenitor is still being debated as we discussed in the introduction. Specifically, it is difficult to reconcile the claimed early-time light curve detection of a main-sequence companion from Marion et al. (2016) with the Maguire et al. (2016) deep, late-time limit ( ) on the amount of low-velocity, solar-metallicity material (Liu & Stancliffe, 2016). In this study, we add a new late-time H constraints, a new X-ray constraint, and a new early-time light curve constraint using a timely prediscovery MASTER observation.
We obtained a high-signal-to-noise spectrum of SN 2012cg 286 days after using LBT/MODS. We then used the models of Mattila et al. (2005) to place an upper limit of on the amount of solar-abundance material in SN 2012cg. This limit agrees with the limit of reported by Maguire et al. (2016), although we view our limit as more conservative. Determining the expected late-time H emission in SNe Ia spectra requires difficult radiative transfer calculations, and theoretical questions remain. Most important, the excitation of H emission by gamma-ray deposition should be modeled as a function of time while varying the amount and velocity profile of stripped material. These issues notwithstanding, Maguire et al. (2016) and our mass limit pose a significant challenge to SD models, firmly ruling out MS and RG companions.
We analyzed Swift X-ray data for SN 2012cg and place limits on the mass-loss rate and wind velocity from its progenitor system. Because of X-ray emission from the host galaxy, our Swift/XRT limits are not very constraining, with (0.3-10 keV). For a wind-like CSM, this implies that for . For this limit, only a fraction of symbiotic progenitor systems are excluded, and we would not expect to detect X-ray signatures from MS or subgiant companions.
Finally, we carefully reanalyze a prediscovery MASTER observation in combination with published photometry (Silverman et al., 2012; Marion et al., 2016) to estimate . We then looked for the signature expected from an interaction between the SN ejecta and a possible SD companion. Assuming that is within our range for of to days from discovery, we constrain the radius of a companion to be . Additionally, Piro & Morozova (2016) recently showed that a dark phase between and would last less than 1 day is all but the most extreme models. If is with a day of our conservative estimate of , then our limit weakens but still constrains . These estimates assume a viewing angle of 15 degrees and rule out a red giant, a helium star, a main sequence, or a subgiant companion for all but the most unfavorable viewing angles.
Our limits on are in agreement with those presented in Silverman et al. (2012). However, they are in stark contrast with the Marion et al. (2016) claim of a blue early-time excess in the optical light curve consistent with the SN ejecta interacting with a main-sequence companion. While there are variations between our analyses, the main differences leading to this discrepancy are:
1) Marion et al. (2016) did not include the MASTER prediscovery observation from Lipunov & Krushinsky (2012). This observation proves to be extremely constraining.
2) In this study, we fit unfiltered observations as a separate “filter”. Marion et al. (2016) instead shifted the unfiltered ROTSE light curve to match a model fit to -band observations between 10 to 14 days before . However, if the ROTSE light curve rises less steeply than -band light curve, then using the ROTSE observations shifted to match at later times would lead to a spurious excess in flux at early times. These ”overluminous” ROTSE observations would then appear to support a main-sequence companion, exactly as seen in Figure 4 and 6 of Marion et al. (2016).
3) Marion et al. (2016) do not include the , , , and light curves when fitting and searching for a signature of a companion. We use these longer wavelength observations where there is no signature from a potential companion seen. Additionally, once removing the ROTSE points as argued in (2), the - and -band plots in upper two panels of Figure 6 in Marion et al. (2016) also both show no evidence of a large companion.
4) In Figures 4 and 6 of Marion et al. (2016), the first -band Swift observation appears to show excess flux. However, in Section 4.1 we caution the reader to be careful when interpreting the -band observations for two reasons. First, SNe Ia have strong Ca II H&K lines (3945 Å) that rapidly change which affect this this -band. Second, the Sloan and Swift are not the same band pass and a careful -correction is required to attempt to translate one into the other. This correction was not preformed in Marion et al. (2016) and is beyond the scope of this study.
5) In this study, we do not use the Swift UV observations because there are not enough early-time observations to robustly fit the rise. Figure 5 of Marion et al. (2016) shows that there is excess flux in the first two Swift UV epochs when compared to a power law. However, this power-law index was derived from the -band light curve, not the UV light curve. Shappee et al. (2016) found that and follow a significantly shallower power law than band for ASASSN-14lp. While SN 2012cg and ASASSN-14lp exhibit difference rise properties, if the UV is also intrinsically shallower for SN 2012cg, then fitting Swift UV observations with a steeper power law at later times would naturally cause a spurious excess flux at earlier times.
6) Marion et al. (2016) find that SN 2012cg rises slowly between the first two Swift UV epochs. However, the slope between the first and second Swift epochs appears to be inconsistent with the ground-based photometry at optical wavelengths, and this trend increases going to bluer wavelengths (see Figure 4). This might point to a problem with the first or second epochs of Swift observations. We reran the Swift photometry ourselves but found no obvious reason why the UV photometry should be wrong. However, in this study we have shown that the longer-wavelength light curves rule out the Kasen (2010) models for the shock interaction between the SN ejecta and a companion. Thus we are left with three possibilities:
i) There is significant diversity in the UV rise of SNe Ia intrinsic to their explosions. We have already seen extreme variability between SNe Ia in the UV near max (e.g., Brown et al., 2010; Wang et al., 2012; Brown et al., 2015; Foley et al., 2016 where theoretical studies predict metallicity to have a substantial affect (e.g., Lentz et al., 2000; Sauer et al., 2008; Walker et al., 2012). Thus, it would not be surprising if the same were true for the early-time UV properties of SNe Ia.
ii) Our understanding of the interaction between the SN ejecta and a companion is not complete.
iii) We are seeing the interaction between the SN ejecta and nearby material in a different geometry and/or distribution than a companion. Perhaps it is the debris from the WD-WD merger (Pakmor et al., 2012; Schwab et al., 2012; Shen et al., 2012; Piro & Morozova, 2016)?
7) Finally, in this study, instead of assuming a fixed , we estimate our uncertainty on and allow for the expected range of possible dark times between and when determining limits. This process allows us to quantify the effects of a possible dark phase.
The light curves of SNe Ia within days of explosion are sensitive tools that enable us to constrain the physical conditions present in the progenitor systems of SNe Ia immediately prior to explosion. However, there are multiple physical processes and geometries which potentially imprint themselves on these light curves. Additionally, careful radiation transfer calculations are needed to understand the detailed effects that a given set of physical conditions would have on the early time light curves. Thus, we should be careful not to over-interpret limited data, especially limited in wavelength, as evidence for one physical interpretation. Additionally, while this study, Silverman et al. (2012), and Marion et al. (2016) assume a power law rise for the early-time light curve of SN 2012cg, other studies have found that the early-light curve for some SNe Ia are more complicated (e.g., Zheng et al., 2013, 2014; Goobar et al., 2015; Im et al., 2015). Additional theoretical and observation work is needed to understand the diversity of behaviors that SNe Ia exhibit in their first few days.
In summary, we do not detect stripped hydrogen-rich material, and we place firm limits on the radius of a possible companion. When our constraints are combined with other studies of SN 2012cg’s progenitor system (e.g., Chomiuk et al., 2012a; Graur & Maoz, 2012; Silverman et al., 2012; Maguire et al., 2013; Chomiuk et al., 2016; Graur et al., 2016; Liu & Stancliffe, 2016; Maguire et al., 2016), the available observations strongly favor a DD progenitor for SN 2012cg.
In the last 7 years we have seen an explosion of companion constraints from nearby, bright SN that have been observed extremely early: SN 2009ig ( ; Foley et al., 2012), SN 2011fe ( ; Bloom et al., 2012; Goobar et al., 2015), KSN 2011a ( ; Olling et al., 2015), KSN 2011b ( ; Olling et al., 2015), SN 2012cg ( ; this paper), SN 2013dy ( ; Zheng et al., 2013), SN 2014J ( ; (Goobar et al., 2015; Siverd et al., 2015), ASASSN-14lp ( ; Shappee et al., 2016), and SN 2015F ( ; Im et al., 2015). These discoveries are a testament to large, nearby transient surveys (e.g., ASAS-SN, Shappee et al., 2014; LOSS, Filippenko et al., 2001; PTF, Law et al., 2009). Similar to Bianco et al. (2011), all these observations easily rule out of giant companions for Type Ia Supernovae. Additionally, there are 3 SNe (SN 2011fe, SN 2012cg, SN 2013dy) where the limits rule out main-sequence or subgiant companions and 2 SNe (SN 2011fe, SN 2012cg) where the limits are strong enough to rule out He star companions. And yet, the signatures of an interaction with a sizable companion star have not been unambiguously seen for any normal SN Ia. Assuming the 4 best-constrained SNe are representative of the entire population, the fraction of SNe Ia with is % is % with 1-sigma confidence and % with 2-sigma confidence. We will present a more thorough statistical analysis in a future work (Shappee et al., in prep.).
References
- Akerlof et al. (2003) Akerlof, C. W., et al. 2003, PASP, 115, 132
- Amanullah et al. (2015) Amanullah, R., et al. 2015, MNRAS, 453, 3300
- Antognini et al. (2014) Antognini, J. M., Shappee, B. J., Thompson, T. A., & Amaro-Seoane, P. 2014, MNRAS, 439, 1079
- Bianco et al. (2011) Bianco, F. B., et al. 2011, ApJ, 741, 20
- Bloom et al. (2012) Bloom, J. S., et al. 2012, ApJ, 744, L17
- Brown et al. (2015) Brown, P. J., Baron, E., Milne, P., Roming, P. W. A., & Wang, L. 2015, ApJ, 809, 37
- Brown et al. (2012) Brown, P. J., Dawson, K. S., Harris, D. W., Olmstead, M., Milne, P., & Roming, P. W. A. 2012, ApJ, 749, 18
- Brown et al. (2010) Brown, P. J., et al. 2010, ApJ, 721, 1608
- Brown et al. (2013) Brown, T. M., et al. 2013, PASP, 125, 1031
- Burrows et al. (2005) Burrows, D. N., et al. 2005, Space Sci. Rev., 120, 165
- Cenko et al. (2012) Cenko, S. B., et al. 2012, The Astronomer’s Telegram, 4115, 1
- Chevalier & Fransson (2006) Chevalier, R. A., & Fransson, C. 2006, ApJ, 651, 381
- Chomiuk et al. (2012a) Chomiuk, L., Soderberg, A., Simon, J., & Foley, R. 2012a, The Astronomer’s Telegram, 4453, 1
- Chomiuk et al. (2012b) Chomiuk, L., et al. 2012b, ApJ, 750, 164
- Chomiuk et al. (2016) —. 2016, ApJ, 821, 119
- Cortés et al. (2008) Cortés, J. R., Kenney, J. D. P., & Hardy, E. 2008, ApJ, 683, 78
- Cortini et al. (2012) Cortini, G., et al. 2012, Central Bureau Electronic Telegrams, 3111
- Filippenko et al. (2001) Filippenko, A. V., Li, W. D., Treffers, R. R., & Modjaz, M. 2001, in Astronomical Society of the Pacific Conference Series, Vol. 246, IAU Colloq. 183: Small Telescope Astronomy on Global Scales, ed. B. Paczynski, W.-P. Chen, & C. Lemme, 121
- Foley et al. (2012) Foley, R. J., et al. 2012, ApJ, 744, 38
- Foley et al. (2016) —. 2016, MNRAS, 461, 1308
- Foreman-Mackey et al. (2013) Foreman-Mackey, D., Hogg, D. W., Lang, D., & Goodman, J. 2013, PASP, 125, 306
- Gehrels et al. (2004) Gehrels, N., et al. 2004, ApJ, 611, 1005
- Goobar et al. (2015) Goobar, A., et al. 2015, ApJ, 799, 106
- Graur & Maoz (2012) Graur, O., & Maoz, D. 2012, The Astronomer’s Telegram, 4226, 1
- Graur et al. (2016) Graur, O., Zurek, D., Shara, M. M., Riess, A. G., Seitenzahl, I. R., & Rest, A. 2016, ApJ, 819, 31
- Hachinger et al. (2013) Hachinger, S., et al. 2013, MNRAS, 429, 2228
- Hachisu & Kato (2001) Hachisu, I., & Kato, M. 2001, ApJ, 558, 323
- Horesh et al. (2012) Horesh, A., et al. 2012, ApJ, 746, 21
- Hoyle & Fowler (1960) Hoyle, F., & Fowler, W. A. 1960, ApJ, 132, 565
- Iben & Tutukov (1984) Iben, Jr., I., & Tutukov, A. V. 1984, ApJS, 54, 335
- Im et al. (2015) Im, M., Choi, C., Yoon, S.-C., Kim, J.-W., Ehgamberdiev, S. A., Monard, L. A. G., & Sung, H.-I. 2015, ApJS, 221, 22
- Johansson et al. (2013) Johansson, J., Amanullah, R., & Goobar, A. 2013, MNRAS, L59
- Kalberla et al. (2005) Kalberla, P. M. W., Burton, W. B., Hartmann, D., Arnal, E. M., Bajaja, E., Morras, R., & Pöppel, W. G. L. 2005, A&A, 440, 775
- Kasen (2010) Kasen, D. 2010, ApJ, 708, 1025
- Kasen et al. (2009) Kasen, D., Röpke, F. K., & Woosley, S. E. 2009, Nature, 460, 869
- Kato et al. (2008) Kato, M., Hachisu, I., Kiyota, S., & Saio, H. 2008, ApJ, 684, 1366
- Katz & Dong (2012) Katz, B., & Dong, S. 2012, arXiv:astro-ph/1211.4584
- Kent et al. (2008) Kent, B. R., et al. 2008, AJ, 136, 713
- Law et al. (2009) Law, N. M., et al. 2009, PASP, 121, 1395
- Lentz et al. (2000) Lentz, E. J., Baron, E., Branch, D., Hauschildt, P. H., & Nugent, P. E. 2000, ApJ, 530, 966
- Leonard (2007) Leonard, D. C. 2007, ApJ, 670, 1275
- Li et al. (2011) Li, W., et al. 2011, Nature, 480, 348
- Lipunov & Krushinsky (2012) Lipunov, V., & Krushinsky, V. 2012, The Astronomer’s Telegram, 4138
- Lipunov et al. (2010) Lipunov, V., et al. 2010, Advances in Astronomy, 2010, 349171
- Lipunov et al. (2011) Lipunov, V. M., Panchenko, I. E., & Pruzhinskaya, M. V. 2011, New Astronomy, 16, 250
- Liu et al. (2012) Liu, Z. W., Pakmor, R., Röpke, F. K., Edelmann, P., Wang, B., Kromer, M., Hillebrandt, W., & Han, Z. W. 2012, A&A, 548, A2
- Liu & Stancliffe (2016) Liu, Z.-W., & Stancliffe, R. J. 2016, MNRAS, 459, 1781
- Maguire et al. (2016) Maguire, K., Taubenberger, S., Sullivan, M., & Mazzali, P. A. 2016, MNRAS, 457, 3254
- Maguire et al. (2013) Maguire, K., et al. 2013, MNRAS, 436, 222
- Margutti et al. (2014) Margutti, R., Parrent, J., Kamble, A., Soderberg, A. M., Foley, R. J., Milisavljevic, D., Drout, M. R., & Kirshner, R. 2014, ApJ, 790, 52
- Margutti & Soderberg (2012) Margutti, R., & Soderberg, A. 2012, The Astronomer’s Telegram, 4118
- Margutti et al. (2012) Margutti, R., et al. 2012, ApJ, 751, 134
- Marietta et al. (2000) Marietta, E., Burrows, A., & Fryxell, B. 2000, ApJS, 128, 615
- Marion et al. (2016) Marion, G. H., et al. 2016, ApJ, 820, 92
- Mattila et al. (2005) Mattila, S., Lundqvist, P., Sollerman, J., Kozma, C., Baron, E., Fransson, C., Leibundgut, B., & Nomoto, K. 2005, A&A, 443, 649
- Matzner & McKee (1999) Matzner, C. D., & McKee, C. F. 1999, ApJ, 510, 379
- Meng et al. (2007) Meng, X., Chen, X., & Han, Z. 2007, PASJ, 59, 835
- Munari et al. (2013) Munari, U., Henden, A., Belligoli, R., Castellani, F., Cherini, G., Righetti, G. L., & Vagnozzi, A. 2013, NewA, 20, 30
- Nomoto (1982) Nomoto, K. 1982, ApJ, 253, 798
- Nugent et al. (2011a) Nugent, P., Sullivan, M., Bersier, D., Howell, D. A., Thomas, R., & James, P. 2011a, The Astronomer’s Telegram, 3581, 1
- Nugent et al. (2011b) Nugent, P. E., et al. 2011b, Nature, 480, 344
- Olling et al. (2015) Olling, R. P., et al. 2015, Nature, 521, 332
- Pakmor et al. (2012) Pakmor, R., Kromer, M., Taubenberger, S., Sim, S. A., Röpke, F. K., & Hillebrandt, W. 2012, ApJ, 747, L10
- Pakmor et al. (2008) Pakmor, R., Röpke, F. K., Weiss, A., & Hillebrandt, W. 2008, A&A, 489, 943
- Pan et al. (2012a) Pan, K.-C., Ricker, P. M., & Taam, R. E. 2012a, ApJ, 760, 21
- Pan et al. (2012b) —. 2012b, ApJ, 750, 151
- Pejcha et al. (2013) Pejcha, O., Antognini, J. M., Shappee, B. J., & Thompson, T. A. 2013, MNRAS, 435, 943
- Peng et al. (2002) Peng, C. Y., Ho, L. C., Impey, C. D., & Rix, H.-W. 2002, AJ, 124, 266
- Piro et al. (2010) Piro, A. L., Chang, P., & Weinberg, N. N. 2010, ApJ, 708, 598
- Piro & Morozova (2016) Piro, A. L., & Morozova, V. S. 2016, ApJ, 826, 96
- Piro & Nakar (2014) Piro, A. L., & Nakar, E. 2014, ApJ, 784, 85
- Podsiadlowski (2003) Podsiadlowski, P. 2003, arXiv:astro-ph/0303660
- Pogge et al. (2010) Pogge, R. W., et al. 2010, in Society of Photo-Optical Instrumentation Engineers (SPIE) Conference Series, Vol. 7735, Society of Photo-Optical Instrumentation Engineers (SPIE) Conference Series
- Raskin & Kasen (2013) Raskin, C., & Kasen, D. 2013, ApJ, 772, 1
- Roming et al. (2005) Roming, P. W. A., et al. 2005, Space Sci. Rev., 120, 95
- Russell & Immler (2012) Russell, B. R., & Immler, S. 2012, ApJ, 748, L29
- Sauer et al. (2008) Sauer, D. N., et al. 2008, MNRAS, 391, 1605
- Schwab et al. (2012) Schwab, J., Shen, K. J., Quataert, E., Dan, M., & Rosswog, S. 2012, MNRAS, 427, 190
- Shappee et al. (2013a) Shappee, B. J., Kochanek, C. S., & Stanek, K. Z. 2013a, ApJ, 765, 150
- Shappee & Stanek (2011) Shappee, B. J., & Stanek, K. Z. 2011, ApJ, 733, 124
- Shappee et al. (2017) Shappee, B. J., Stanek, K. Z., Kochanek, C. S., & Garnavich, P. M. 2017, ApJ, 841, 48
- Shappee et al. (2013b) Shappee, B. J., Stanek, K. Z., Pogge, R. W., & Garnavich, P. M. 2013b, ApJ, 762, L5
- Shappee & Thompson (2013) Shappee, B. J., & Thompson, T. A. 2013, ApJ, 766, 64
- Shappee et al. (2014) Shappee, B. J., et al. 2014, ApJ, 788, 48
- Shappee et al. (2016) —. 2016, ApJ, 826, 144
- Shen et al. (2012) Shen, K. J., Bildsten, L., Kasen, D., & Quataert, E. 2012, ApJ, 748, 35
- Shen et al. (2013) Shen, K. J., Guillochon, J., & Foley, R. J. 2013, ApJ, 770, L35
- Silverman et al. (2012) Silverman, J. M., et al. 2012, ApJ, 756, L7
- Siverd et al. (2015) Siverd, R. J., Goobar, A., Stassun, K. G., & Pepper, J. 2015, ApJ, 799, 105
- Soderberg et al. (2006) Soderberg, A. M., et al. 2006, ApJ, 650, 261
- Thompson (2011) Thompson, T. A. 2011, ApJ, 741, 82
- Thoroughgood et al. (2001) Thoroughgood, T. D., Dhillon, V. S., Littlefair, S. P., Marsh, T. R., & Smith, D. A. 2001, MNRAS, 327, 1323
- Tutukov & Yungelson (1979) Tutukov, A. V., & Yungelson, L. R. 1979, Acta Astron., 29, 665
- Walker et al. (2012) Walker, E. S., Hachinger, S., Mazzali, P. A., Ellis, R. S., Sullivan, M., Gal Yam, A., & Howell, D. A. 2012, MNRAS, 427, 103
- Wang & Han (2012) Wang, B., & Han, Z. 2012, NewAR, 56, 122
- Wang et al. (2012) Wang, X., et al. 2012, ApJ, 749, 126
- Webbink (1984) Webbink, R. F. 1984, ApJ, 277, 355
- Wheeler et al. (1975) Wheeler, J. C., Lecar, M., & McKee, C. F. 1975, ApJ, 200, 145
- Whelan & Iben (1973) Whelan, J., & Iben, Jr., I. 1973, ApJ, 186, 1007
- Yamaguchi et al. (2015) Yamaguchi, H., et al. 2015, ApJ, 801, L31
- Yamanaka et al. (2014) Yamanaka, M., et al. 2014, ApJ, 782, L35
- Zheng et al. (2013) Zheng, W., et al. 2013, ApJ, 778, L15
- Zheng et al. (2014) —. 2014, ApJ, 783, L24