Towards Rock-paper-scissors patterns in the Optional Public Goods Game under random mobility
Abstract
Social dilemmas concern a natural conflict between cooperation and self interests among individuals in large populations. The emergence of cooperation and its maintenance is the key for the understanding of fundamental concepts about the evolution of species. In order to understand the mechanisms involved in this framework, here we study the Optional Public Good Games with focus on the effects of diffusive aspects in the emergent patterns of cyclic dominance between the strategies. Differently from other works, we showed that rock-paper-scissors (RPS) patterns occur by introducing a simple kind of random mobility in a lattice sparsely occupied. Such pattern has been revealed to be very important in the conservation of the species in ecological and social environments. The goal of this paper is to show that we do not need more elaborated schemes for construction of the neighbourhood in the game to observe RPS patterns as suggested in the literature. As an interesting additional result, in this contribution we also propose an alternative method to quantify the RPS density in a quantitative context of the game theory which becomes possible to perform a finite size scaling study. Such approach can be very interesting to be applied in other games generically.
1 Introduction
The evolution of cooperation, fairness, or pro-social behavior among non-related individuals is one of the fundamental problems in biology and social sciences [1]. Reciprocal altruism fails in providing a good solution if the iterations are not repeated. Some mechanisms as punishment can be effective, for example in the iterated ultimatum game (UG) where players reject offers far from fifty-fifty division [2, 3, 4, 5, 6]. However this mechanism, in the case of prisoner dilemma (PD) or even public goods games (PGG) requires that defectors must be identified as observed in ref. [7]. Optional participation in the PGG is a simple but effective mechanism that can avoid possible exploiters and overcome the social dilemma [8, 9], since the cooperators and defectors can coexist due to the abstention alternative. These works as well as many others (see for example [10, 11, 12]) consider a dynamics with many public games, where each one of them corresponds to a different neighbourhood and its central node, differently from some alternative works (not so explored in literature) that consider the dynamics of an only single and large public goods game with interacting players (see for example [13, 14]).
Therefore, the so called Optional Public Goods Game (OPGG) can provide an useful representation of many social conflicts which the cooperation plays an important role in the good operation of general public services. Voluntary participation in PGG may provide a way to keep stable and persistent levels of cooperation, without secondary mechanisms as punishment or reward [15]. In the stationary state of dynamics in OPGG the coexistence of the three strategies: cooperators, defectors, and loners, as well as dominance cycles of each one of these strategies in sequence, i.e., the so called rock-paper-scissors (RPS) regime, were reported as solutions of the mean field replicator dynamics [16], as well as for simulation in different topologies [11, 12, 17].
Other important aspects may influence the cooperation patterns in PD and PGG and among them, one has called the attention of physicists that study evolutionary game theory: the mobility of the players [18]. Mobility is an interesting mechanism to evaluate if a social or biological system preserve its environment or biodiversity by considering the different strategies in the population [19, 18], or by simply to change the critical rates in epidemiological systems simulated by cellular automata [20]. So, the investigation of RPS pattern which is an interesting case of emergence of cooperation, deserves more attention in OPGG and in this point we would asking for: Is the mobility an important ingredient to influence or even preserve the RPS patterns in OPGG? If yes, for which occupation this can happen?
In this paper we propose to study the effects of mobility in OPGG. We focus our investigation in three different contributions:
-
1.
First, we would like to answer about the connection between the mobility and RSP patterns observed in OPPG and in other game theory protocols;
-
2.
In square lattices, where each site can be occupied by only one player, we intend to explain how the occupation (density of occupied sites) and mobility characterized by a simple diffusion parameter , probability that a player moves to a empty site, randomly chosen among nearest neighbours, influence the RSP patterns;
-
3.
By following this investigation, we would like to propose a parameter to measure the density of RPS patterns in Game theory, more precisely in PD and PGG with voluntary participation, or even in other game theory protocols;
In this contribution we present an analysis, by means of Monte Carlo Simulations, looking for the coexistence of the two strategies in the steady states or in a more singular and rare case, the alternate dominance of each single strategy (RPS patterns) in the presence of mobility. We simultaneously analyse the effects of the multiplication factor () , the density of mobile agents in the lattice () and the mobility parameter (). It is important to notice that other studies considering mobility in OPGG reveal some features to maintain the cooperation but these results do not explore the existence of cyclic dominance of the strategies (see for example [10]). More precisely, we are interested in how these three important parameters of the game are able to modulate the emergence of spontaneous cooperation, looking simply for coexistence of strategies or cycles of the three possible strategies. In the next section we present the essential points about the model and how our simulations are implemented considering our Monte Carlo Simulations for OPGG with mobility of the players. In section 3 we present our main results.
2 The OPGG with Monte Carlo simulations considering mobility of the players
In this paper we consider a population of players randomly distributed over a square lattice of linear dimension , so and the density of players is defined by . Every player interacts only with its nearest neighbours, and each site in the lattice can contain a player or simply to be a vacancy (empty space). So if we include the vacancy with status of state, we have a four-state model, where each site can have four possible states: C (cooperator), D (defector), or L (loner) if there is a player occupying the site which represent the three possible strategies for a player and V (vacancy) otherwise. The OPGG with Mobility evolves according to steps of the following algorithm:
-
1.
An agent is randomly chosen.
-
2.
Each cooperator in its neighbourhood contributes to the common pool with a unit of wealth. Defectors participate, but without contribution (free-rider action), while loners stay out of game getting a fixed payoff , which we make equal to the unit, without loss of generality.
-
3.
Payoffs are then calculated for the three possible strategies:
(1) where is the multiplication factor of the public good, , and are the number of players with each corresponding strategy in the local configuration (neighbourhood). If we define for , for and for , we can reduce this formula to:
-
4.
An occupied site is randomly drawn. So a site in the neighbourhood of is also randomly drawn. If the site is a vacancy the player localized in jumps to site with probability . Otherwise, if then copy the strategy of . If this condition is not satisfied, so keeps its current strategy.
-
5.
The process is repeated times, i.e., we randomly choose players from the population, and so we replicate the process. In average each agent has the opportunity to change its state once per Monte Carlo time step;
So we present time evolution densities of the three kinds of strategies, . In all our simulations, the initial configuration is fixed but random, where the population is composed by 1/3 of the each one of the three strategies, in order to observe the survival of the strategies. Clearly, other situations should be biased to lead the system to the emergence of cooperators. However we opted by avoiding this possible bias. In the next section we present our main results. Basically, we define an interesting parameter to able to describe the density of RPS patterns in the time evolution of strategies, considering the system over different occupations and mobilities.
3 Results
In order to investigate the collective dynamical behaviour of the system, we measure the time evolution of fraction (or density) of individuals in the three possible strategies, , and , cooperators, defectors, and loners respectively, since is the number of players in the lattice.
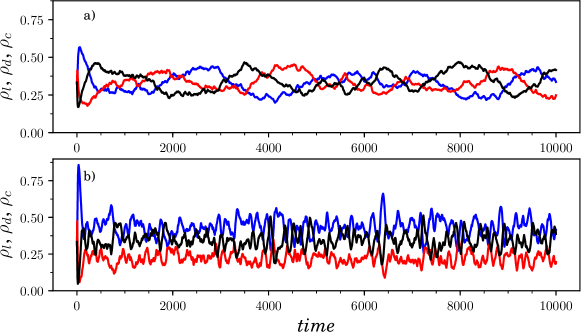
First, we start showing the time evolution of , , and considering Monte Carlo steps as can be observed in Fig. 1. We choose two particular situations: a) and b) , both considering and a low mobility: As previously reported, we start from an initial concentration of . This figure reveals two typical patterns in our analysis: In plot (a), the system reaches a configuration in which the three strategies coexist in a cyclic way while in plot (b), there is no cyclic dominance among the strategies, just coexistence where two strategies dominate one third. Now let us better explore the effects of the vacancies and mobility of the players in the emergence of cooperation or more precisely how this is related to the occurrence of RPS patterns.
Here the idea is very simple: by varying the occupation and a mobility parameters of the system we can find small fluctuations which leads to large and sustained oscillations, so a cyclic state appears in the global behaviour of the system, i.e., the fraction of each one must vary cyclically. However, an important question is how to measure the density of the occurrence of this pattern in the time evolution of these strategies in a simple way. In this paper we suggest a natural parameter: we measure how long is the length of all L-C-D (or C-D-L, or L-D-C…) sequences that appear during the evolutions. So we establish the following convention: the condition means , while means , and finally corresponds to the dominance of . For example, in the sequence with 40 terms:
| CCLLLCCDDDLCCCCCDLCCCCDDDDCCCLLCCCCDDCCC |
we have 4 LCD cycles, where the density is then equal to , since in a general evolution we define as
where denote the set of lengths of all sequences of LCD found in the whole series of size , where sure , which leads to .
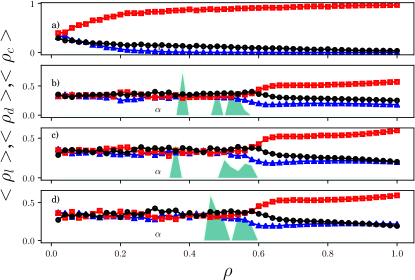
So we elaborate an interesting plot that shows , , and as function of , the multiplication factor of the OPPG as can be observed in Fig. 2. The averages were computed by:
where , or , and were computed considering MC steps to compose the averages.
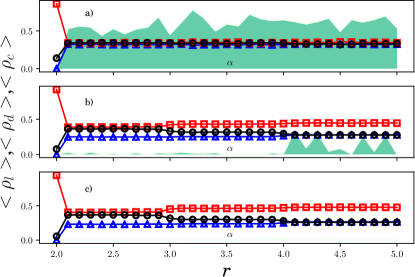
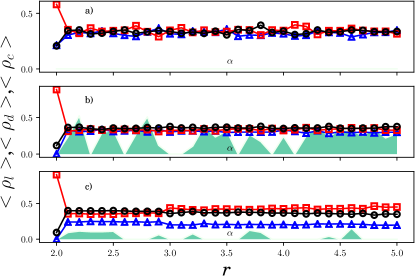
This figure qualitatively corroborates that there is a relation between occupation and mobility, however this relation must be more explored. So we perform a plot of , , and as function of as can be observed in Fig. 3.
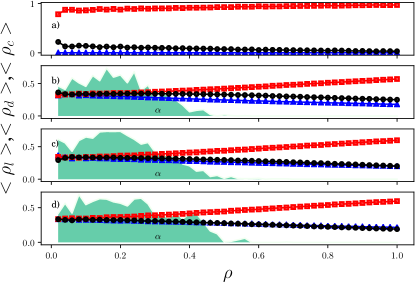
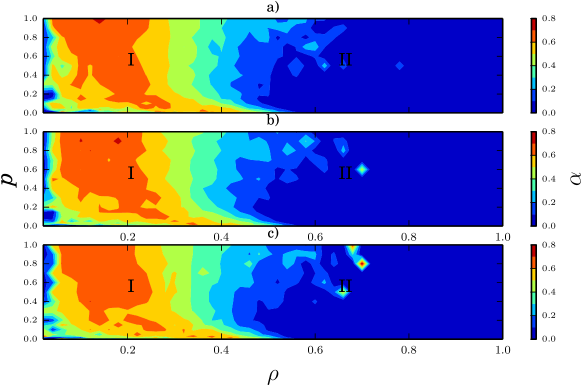
The idea of low density and high mobility promotes RPS behaviour seems to be qualitatively corroborated by this figure. This figure also shows that for the RPS patterns are not observed. However, an alternative to clear up this point is to observe the proportion to all pairs . So we elaborate color maps which show how this proportion changes in all combinations of occupation and mobility which can be observed in Fig. 4. We show 3 plots that correspond to the 3 different seeds respectively, by showing the robustness of the zones obtained for the different seeds, i.e., we can observe similar maps for the different seeds. For the sake of simplicity, we can qualitatively separate the region in two different regions: I which corresponds to zone with higher RPS probability (left) and II where just coexistence of two strategies is generally observed (right).
So, let us pick up two typical points in the two different zones by exploring their typical behaviour. For zone I we fix the parameters , and while in zone II we choose , and and so we built a figure (Fig. 5) that shows the time evolution of strategy densities for these two situations (first plot from up to bottom) and a corresponding sequence of snapshots by showing the spatial distribution of strategies in the lattice, for the first situation (medium plot) and for the second situation (lower plot).
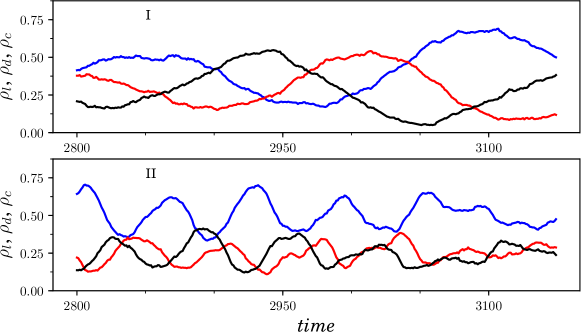
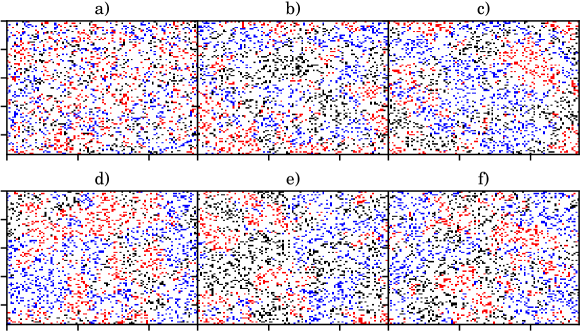
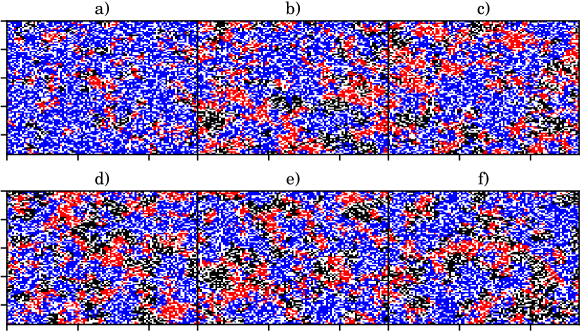
The snapshots corresponds to times a) b) , c) , d) e), and f) MC steps. We can clearly observe the RPS behaviour for the case chosen in region I while dominance of a strategy is observed for the case chosen in region II. So we can conclude that with a simple kind of mobility the RPS patterns can be observed in low occupation and high mobility, but the pattern occurs continuously.
Finally we studied the effects of on the density of RPS. So we plot as function of , for different sizes and which is shown in the main plot of the Fig. 6 in mono-log scale. It is important to notice that we can observe strong fluctuations for by considering different size systems. So, in order to perform a finite size scaling analysis, we propose to use the RPS integrated over the different values, which we define as RPS mass and calculated according to:
| (2) |
which is numerically obtained by Simpson’s rule formulae:
| (3) |
We know the numerical error in approximating Eq. 2 by Eq. 3 which is of order , however we obtained the plots of Fig. 6 by using five different seeds and we have the error bars for each , represented by standard error. So by discarding the numerical errors, and considering only the statistical errors as main sources, we have the uncertainty propagation formulae:
| (4) |
So we plot as function of which is shown in the lower inset plot in 6 with error bars calculated according to Eq. 4. We can see the strong dependence in the size system. The upper inset plot shows the case in linear scale just for observation.
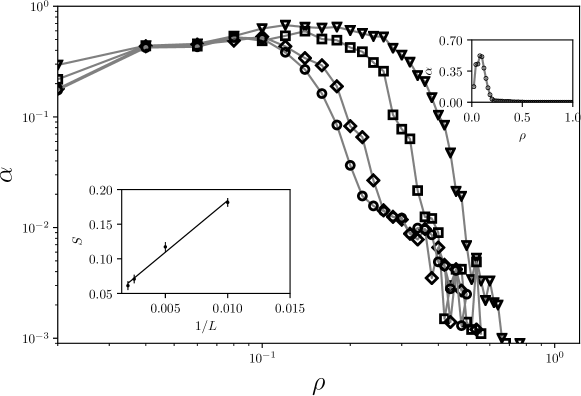
We can observe that RPS mass decreases as increases according to algebraic behaviour. So our conclusions leads to RPS occurrences in the OPGG can be observed in no percolation regime of occupation when mobility is incremented in the system. Our snapshots show such phenomena by showing that mobility possibilities encounters between players that starts the RPS process. The phenomena does not occur in highly occupied lattices and the process is continuous, i.e., the RPS regions has a preferential region in low occupation that changes slightly from seed to seed. Some sporadic RPS events can be found in percolation regime () but are not observed in all different color maps corresponding to the different seeds.
4 Conclusion
We have performed a thorough study about emergence of cooperation in OPGG, by showing the appearance of cycles of rock-paper-scissors patterns among the three possible strategies in an evolutionary Darwinian dynamics under diffusion effects in lattices with vacancies. We established color maps which show that more probable regions of RPS patterns occur in more sparsely lattices and intermediate mobilities while we have only coexistence domain in more occupied lattices where the RPS patterns are missing. We also explore the numerical relationship between the multiplicative factor of the OPGG and the RPS patterns. We also show that RPS mass, i.e., the integral of RPS over all possible occupations, decays as a power law as the size system enlarges. Our work quantifies RPS patterns emergent in diluted lattices, or only coexistence patterns, which occurs with simple mobility, differently from other works that explore more complex diffusion to stablish stable frequency of strategies in steady state (see for example [10]). Our work corroborates other results obtained in the context of rock-paper-scissors games which suggest that biodiversity is promoted by mobility (see for example [19]).
References
- [1] M. A. Nowak. Evolutionary Dynamics: Exploring the Equations of Life. Harvard University Press, Harvard, 1 edition, 2006.
- [2] W. Guth, R. Schmittberger, and B. Schwarze. An experimental analysis of ultimatum bargaining. J. Econ. Behav. Organ., 3(4):367 – 388, 1982.
- [3] R. da Silva, G. A. Kellermann, and L. C. Lamb. Statistical fluctuations in population bargaining in the ultimatum game: Static and evolutionary aspects. J. Theor. Biol., 258(2):208 – 218, 2009.
- [4] R. da Silva and G. A. Kellerman. Analyzing the payoff of a heterogeneous population in the ultimatum game. Braz. J. Phys., 37:1206 – 1211, 12 2007.
- [5] E. Almeida, R. da Silva, and A. Souto Martinez. Strategies generalization and payoff fluctuation optimization in the iterated ultimatum game. Physica A, 412:54 – 65, 2014.
- [6] R. da Silva, P. A. Valverde, and L. C. Lamb. Randomness and arbitrary coordination in the reactive ultimatum game. Commun.Nonlinear Sci, 36:419 – 430, 2016.
- [7] H. Brandt, C. Hauert, and K. Sigmund. Punishment and reputation in spatial public goods games. P. Roy. Soc. B-Biol. Sci., 270(1519):1099–1104, 2003.
- [8] C. Hauert, S. De Monte, J. Hofbauer, and K. Sigmund. Volunteering as red queen mechanism for cooperation in public good games. Science, 296:1129–1132, May 2002.
- [9] G. Szabó and C. Hauert. Phase Transitions and Volunteering in Spatial Public Goods Games. Phys. Rev. Lett., 89:118101, Aug 2002.
- [10] L.Zhong, W.Xu, Y.Shi, and T.Qiu. Coupled dynamics of mobility and pattern formation in optional public goods games. Chaos Soliton. Fract., 47:18 – 26, 2013.
- [11] C. Hauert and G. Szabó. Prisoner’s dilemma and public goods games in different geometries: Compulsory versus voluntary interactions. Complexity, 8(4):31–38, 2003.
- [12] C. Hauert and G. Szabó. Game Theory and Physics. Am. J. Phys., 73:405–414, May 2005.
- [13] R. da Silva, A.L.C. Bazzan, A.T. Baraviera, and S.R. Dahmen. Emerging collective behavior and local properties of financial dynamics in a public investment game. Physica A, 371(2):610 – 626, 2006.
- [14] R. da Silva. The public good game on graphs: can the pro-social behavior persist? Braz. J. Phys., 38:74 – 80, 03 2008.
- [15] C Hauert. Replicator dynamics of reward & reputation in public goods games. J. Theor. Biol., 267(1):22 – 28, 2010.
- [16] C. Hauert, S. De Monte, J. Hofbauer, and K. Sigmund. Replicator dynamics for optional public goods games. J. Theor. Biol., 218:187–194, Apr. 2002.
- [17] C. Hauert. Cooperation, Collectives Formation and Specialization. Adv. Complex Syst., 9(4), 2006.
- [18] M.H. Vainstein, A. Silva, and J. Arenzon. Does mobility decrease cooperation? J. Theor. Biol., 244(4):722 – 728, 2007.
- [19] T. Reichenbach, M. Mobilia, and E. Frey. Mobility promotes and jeopardizes biodiversity in rock-paper-scissors games. Nature, 448:1046 – 1049, 2007.
- [20] R. da Silva and H. A Fernandes. A study of the influence of the mobility on the phase transitions of the synchronous sir model. J. Stat. Mech-Theory E, 2015(6):P06011, 2015.