Extended skyrmion lattice scattering and long-time memory in the chiral magnet Fe1-xCoxSi
Abstract
Small angle neutron scattering measurements on a bulk single crystal of the doped chiral magnet Fe1-xCoxSi with =0.3 reveal a pronounced effect of the magnetic history and cooling rates on the magnetic phase diagram. The extracted phase diagrams are qualitatively different for zero and field cooling and reveal a metastable skyrmion lattice phase outside the -phase for the latter case. These thermodynamically metastable skyrmion lattice correlations coexist with the conical phase and can be enhanced by increasing the cooling rate. They appear in a wide region of the phase diagram at temperatures below the -phase but also at fields considerably smaller or higher than the fields required to stabilize the -phase.
pacs:
75.10.-b 75.30.Kz 75.25.-jI Introduction
Spin chirality generated by Dzyaloshinsky-Moriya (DM) interactions Dzyaloshinski (1958); Moriya (1960) is the focus of interest due to the emergence of chiral skyrmions Bogdanov and Yablonskii (1989); Bogdanov and Hubert (1994); Rößler et al. (2006); Mühlbauer et al. (2009); Yu et al. (2010); Münzer et al. (2010); Nagaosa and Tokura (2013), which are non-coplanar and topologically stable spin textures. These can form a unique type of long-range magnetic order, a skyrmion lattice (SkL), as observed in the isostructural B20 transition-metal silicides, TMSi (TM=Mn, Fe, Co), and germanides like FeGe by neutron scattering Mühlbauer et al. (2009); Münzer et al. (2010); Moskvin et al. (2013) and in real space by Lorentz transmission microscopy Yu et al. (2010, 2011). In these bulk cubic helimagnets, the SkL correlations appear spontaneously in the so called A-Phase, a small pocket in the magnetic field (), temperature () phase diagram slightly below the transition temperature Mühlbauer et al. (2009); Yu et al. (2010). In confined geometries such as thin films Yu et al. (2011) or nanowires Du et al. (2014), this narrow pocket expands and tends to cover a substantial part of the phase diagram below up to the lowest temperature.
Recent findings show that it is also possible in bulk MnSi to quench the thermodynamically stable SkL into a metastable state by rapid cooling down to low temperatures Oike et al. (2016). Additionally, short range order that may be associated with isolated skyrmions has been found outside the A-Phase in MnSi Grigoriev et al. (2014). Thus the experimentally observed stability limits of chiral skyrmions and SkL in the reference cubic helimagnets seem to be less well defined and established than assumed so far. On the other hand, it is theoretically established that metastable SkL and single skyrmions should exist over a broad range of the phase diagram Bogdanov and Hubert (1994); Wilson et al. (2014), as supported by recent findings on thin films Romming et al. (2015) or on the bulk polar magnetic semiconductor Kézsmárki et al. (2015).
The small angle neutron scattering (SANS) results presented below go further in this direction and show strong memory effects and very weak patterns with the characteristic SkL sixfold symmetry that coexist with the conical phase, indicating the stabilization of SkL outside the usual thermodynamic equilibrium limits in the bulk cubic helimagnet Fe1-xCoxSi, =0.3. The sample belongs to the semi-conducting system Fe1-xCoxSi, which is characterized by very long helix periods from nm to nm Beille et al. (1981); Ishida et al. (1985) and by a change of magnetic chirality from left to right handed as the amount of Co doping increases, triggered by the change of the chemical lattice chirality at Grigoriev et al. (2009). Fe0.7Co0.3Si has a right handed, or clockwise, chirality and the helices propagate along the [100] crystallographic directions.
Similar to chiral magnets of the same family, the ground state results from the competition between three terms in the Hamiltonian: a strong ferromagnetic exchange, a weaker DM interaction and a weakest anisotropyBak and Jensen (1980). Below the transition temperature a helical order sets in with proportional to the ratio of ferromagnetic exchange to DM interactions and with the helices fixed to the chemical lattice by anisotropy. This hierarchy is also found in the phase diagram, where a weak critical field is enough to overcome the anisotropy, unpin the helices from the chemical lattice and orient them along its direction leading to the conical phase. A higher magnetic field is subsequently required to overcome the DM interactions and ferromagnetically align the magnetic moments inducing the spin polarized phase. The -phase occurs in a narrow region below and for intermediate magnetic fields between and Beille et al. (1983); Ishimoto et al. (1995); Grigoriev et al. (2007); Takeda et al. (2009); Münzer et al. (2010).
A phase diagram depending on the magnetic history has already been found in Fe1-xCoxSi by neutron scattering Münzer et al. (2010) and specific heat or magnetic susceptibility measurementsBauer et al. (2016). We chose to systematically investigate this effect and cooled the sample through following three specific protocols: Zero Field Cooling (ZFC) and slow or fast Field Cooling (FC). Our results show a pronounced history effects and the existence of SkL correlations over a very extended region of the phase diagram when applying field cooling. These SkL correlation can be enhanced by increasing the cooling rate and do not only exist at temperatures below the -phase.
II Experimental Details
The experiments were performed on the Small Angle Neutron Scattering (SANS) instrument D33 of the ILL using a monochromatic neutron beam with a wavelength =0.6 nm and and on the same Fe0.7Co0.3Si single crystal () used in a previous investigationTakeda et al. (2009). The sample was oriented with the [10] axis vertical and the [001] axis parallel to , the incoming neutron beam wavevector. The data were normalized to standard monitor counts and a measurement at =60 K was used for the background correction. The magnetic field was applied parallel to a configuration, where only helical modulations that propagate perpendicularly to may fulfill the Bragg condition and give rise to scattering. The results are thus complementary to the previous investigationTakeda et al. (2009), where the magnetic field was applied perpendicular to the neutron beam and in the SANS detector plane. The magnetic field was applied following three specific protocols:
-
•
ZFC temperature scans: the sample was cooled down to 2 K under zero magnetic field, then a magnetic field was applied and the patterns were recorded by increasing the temperature in steps of 2 K every 6 min.
-
•
FC temperature scans: the magnetic field was applied at 60 K and the measurements were performed by decreasing the temperature in steps of 0.5 K every 10 min between 45 K and 42 K, in steps of 1 K every 5 min between 41 K and 30 K and between 30 K and 2 K in steps of 2 K every 5 min.
-
•
Fast FC temperature scans: the magnetic fields of 43 mT or 54 mT were applied at 60 K and the sample was immediately brought to 30 K at a cooling rate of 3 K/min. The measurements were subsequently performed by decreasing the temperature to 2 K in steps of 2 K every 5 min.
III Experimental Results
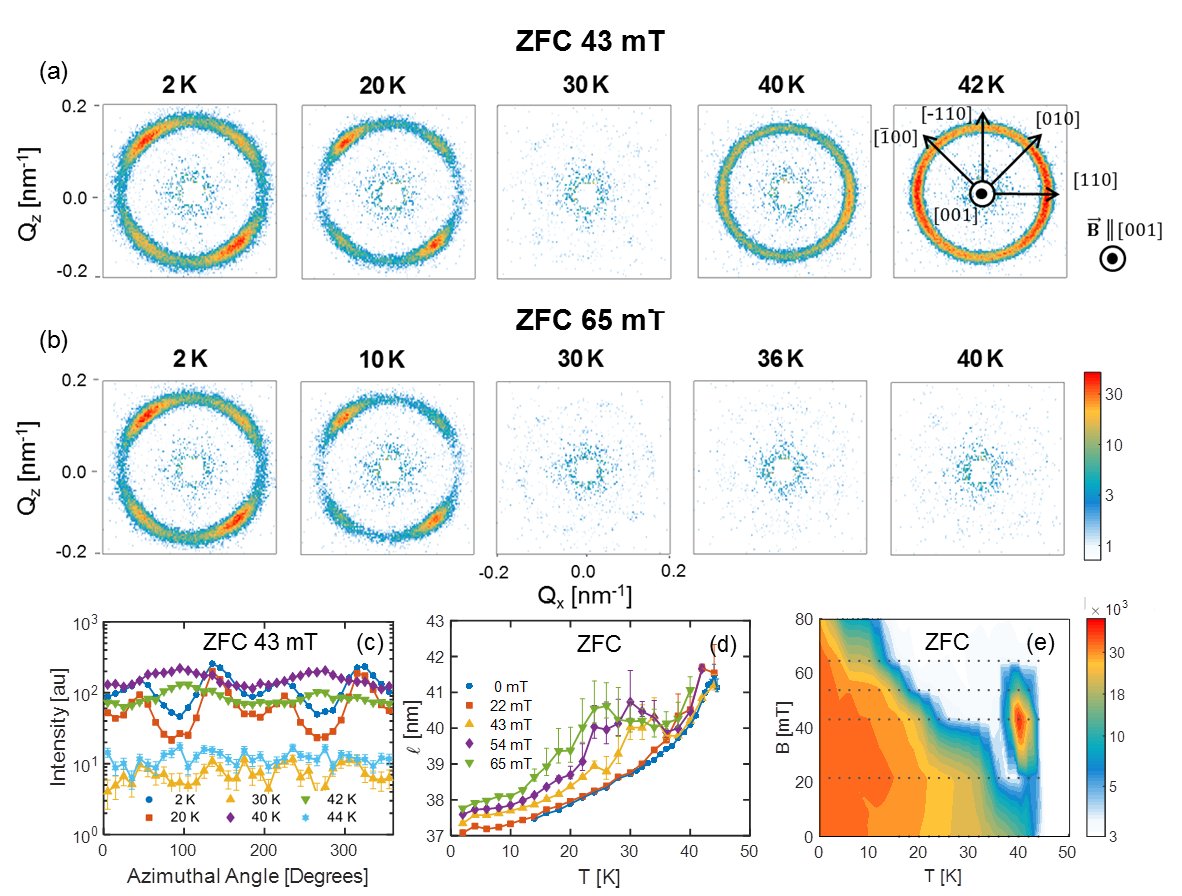
First, we present the ZFC results that are summarized in Fig. 1, which shows typical SANS patterns for (a) 43 mT and (b) 65 mT, azimuthally averaged intensity at 43 mT (c), the temperature and magnetic field dependence of (d) and finally a contour plot of the integrated SANS intensity illustrating the occurrence of the different phases (e). The patterns at low temperatures displayed in panels (a) and (b) show four broad peaks that are the fingerprint of the helical order along the crystallographic directions. By increasing the temperature the intensity almost vanishes at 30 K. This is the signature of the conical phase, where helices are aligned by the magnetic field and they do not fulfill the Bragg condition in the configuration of this experiment () and thus do not scatter neutrons. Additional information on this phase can be found in the previous workTakeda et al. (2009), where a complementary experimental set-up with was used.
By further increasing the temperature the scattered intensity increases for =43 mT and scattering patterns reappear for 38 K as shown in Fig. 1(a) for =40 K and 42 K. However, the observed pattern is not the six-fold SkL symmetry of MnSi Mühlbauer et al. (2009) but a ring as illustrated by the azimuthally averaged intensities shown in panel (c). This behavior is similar to Fe0.8Co0.2Si where such a ring-like pattern was found and was attributed to the combination of disorder, arising from the solution of Fe and Co in the chemical lattice, and magneto-crystalline anisotropyMünzer et al. (2010). The azimuthal intensity plots also show that the four helical peaks visible at low temperatures do not have exactly the same intensity, reflecting a slight misalignment of the sample as pointed out in the previous investigationTakeda et al. (2009).
Fig. 1(d) depicts the temperature dependence period of the helical modulations that has been derived from the momentum transfer where the scattered intensity is maximum: . As the temperature increases from 2 to 40 K, increases substantially by about 14 %, which suggests a weakening of the DM interaction with respect to the ferromagnetic exchange. In addition for mT, a non-monotonic temperature dependence is found with going through a minimum at the A-Phase and then through a maximum at a lower temperature which depends on the magnetic field.
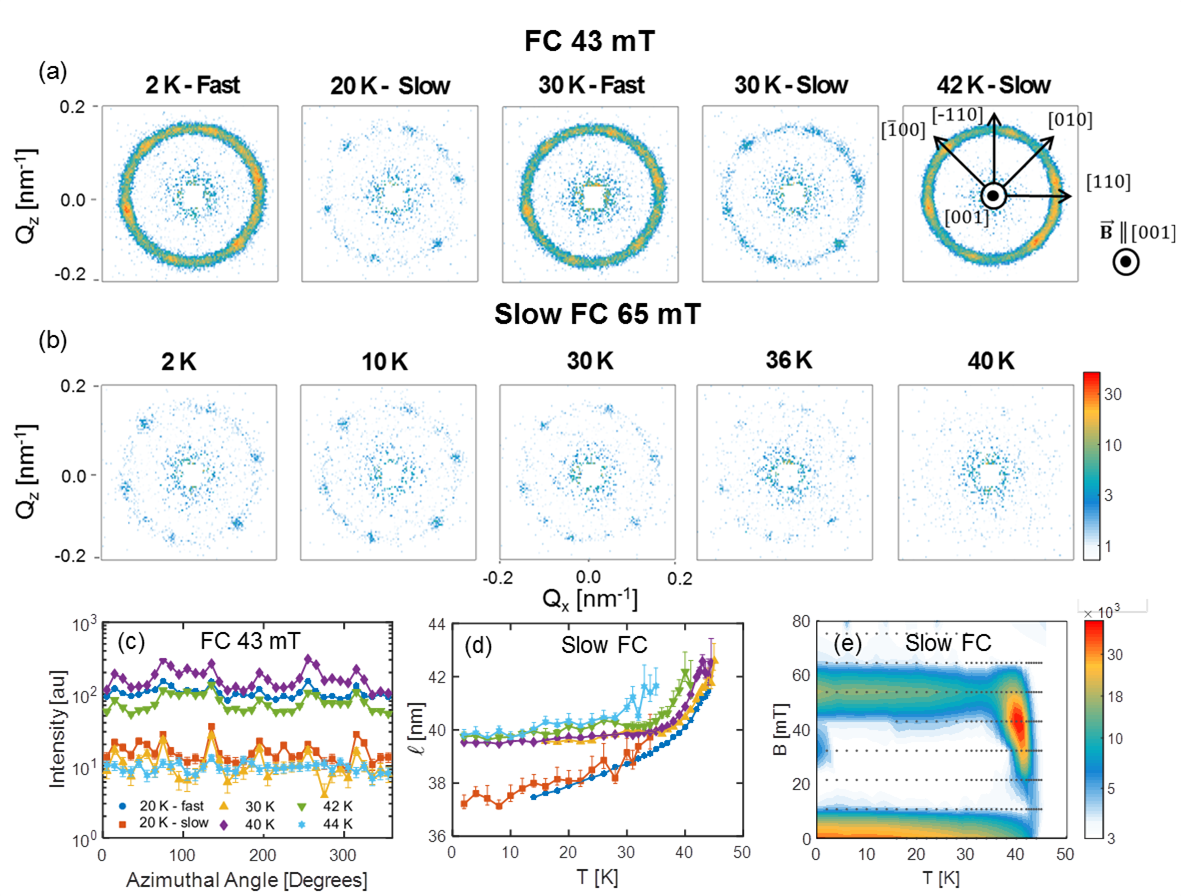
FC results are summarized in Fig. 2, which is complementary to Fig. 1: the patterns in panels (a) and (b) are given for the same magnetic fields as for ZFC and reveal substantial differences. In contrast to ZFC, the helical phase is confined to magnetic fields below 10 mT. In the -phase at 43 mT a ring-shaped scattering is found for 40 K and 42 K, shown in Fig. 2(a), but in contrast to ZFC the six-fold symmetry characteristic of the SkL phase is visible in the FC patterns as well as in the corresponding azimuthal plots shown in panel (c). This six-fold symmetry pattern remains, although weak, clearly visible, even when the temperature is further decreased below 38 K, which suggests the coexistence of a weak SkL with the conical phase. SkL correlations therefore seem to freeze by cooling the sample in a magnetic field, and this effect depends on the cooling rate through the -phase as shown by the different SANS patterns for slow and fast FC at 20 K and 30 K in Fig. 2(a). This freezing of the correlations is also seen in the evolution of in Fig. 2(d), which for >22 mT locks-in to the value at 38 K while cooling down, which is in sharp contrast with the ZFC behavior shown in Fig. 1(d).
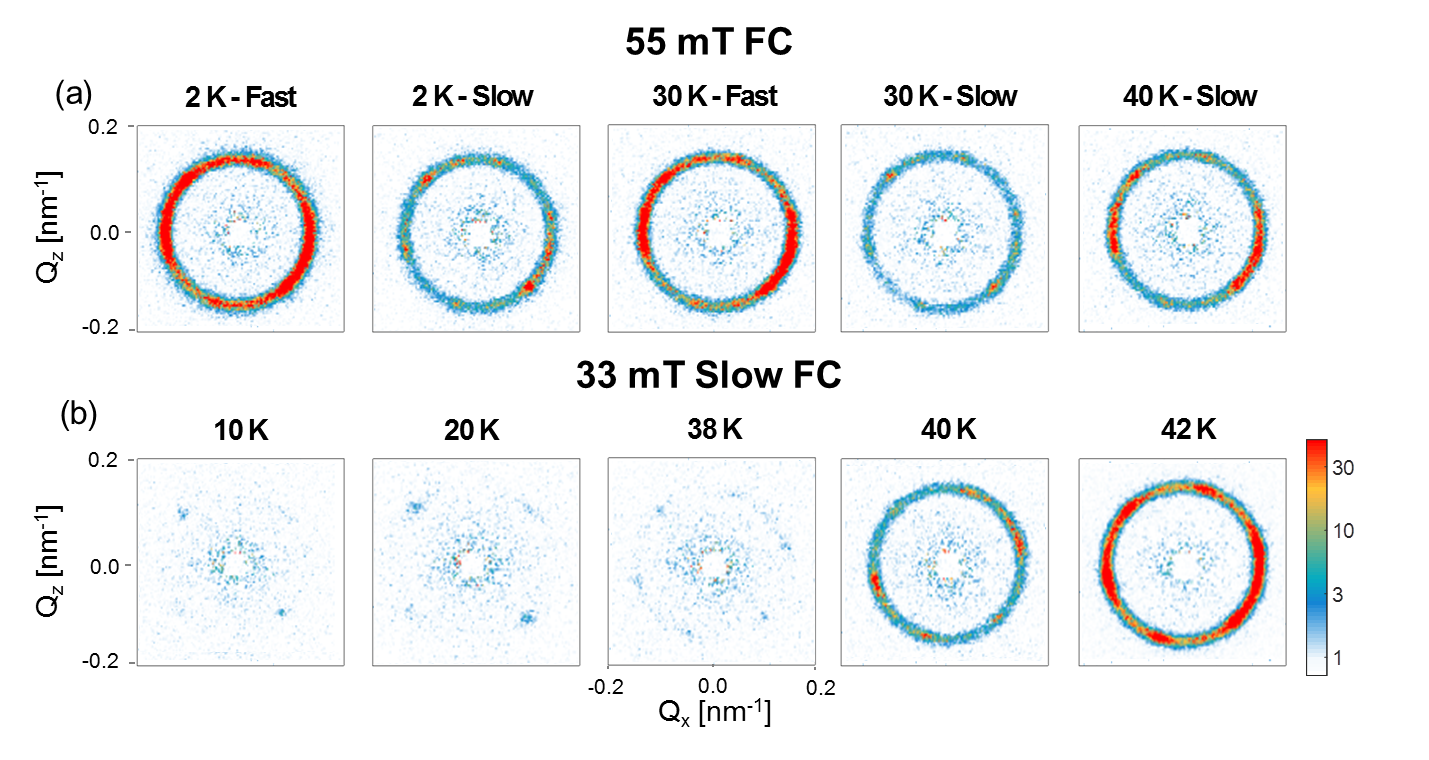
For the slightly higher magnetic field of 55 mT the patterns of Fig. 3 show that the -phase clearly extends down to 2 K. In this case, fast FC leads to higher scattered intensities than slow FC, although with the same symmetry and overall shape of the scattering patterns. The SANS intensity map in Fig. 2(e) illustrates the boundaries of the -phase, which extend to the lowest temperatures between 45 and 65 mT. However, outside this -phase region, weak six-fold symmetry patterns appear with an intensity about 100 times weaker than in the -phase, similarly to what is shown in Fig. 2 (a) and (b). In addition, at intermediate magnetic fields (10 < <35 mT) and for <30 K, weak four-fold symmetry patterns are found, also with intensities about 100 times weaker than for the ZFC case. They become stronger as the temperature decreases, resulting in a small pocket of a relatively low intensity in the contour plot of the scattered intensity of Fig. 2(e).
IV Discussion
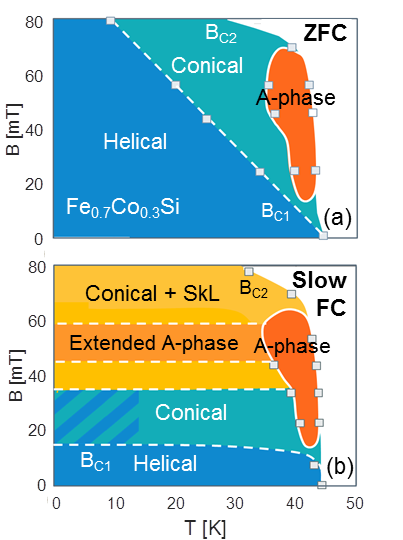
The results presented above lead to the phase diagrams of Fig. 4, which highlight the differences between ZFC and slow FC. The ZFC phase diagram reveals that the conical phase extends, as in the doped compound Mn1-xFexSi and Mn1-xCoxSiBauer et al. (2010) to much larger fields than in undoped compounds as MnSi and Cu2OSeO3 as well as that they reveal a temperature dependence of for ZFC. The conical phase is greatly suppressed for the FC case where there are regions where metastable SkL or helical correlations coexist with the conical phase under field cooling conditions.
These SkL correlations exist over a very extended region of the phase diagram until the lowest temperature and are not only found at temperatures below the thermodynamically stable -phase. The very low intensity, almost two orders of magnitude lower than at the -phase, could possible indicate surface or edge pinning Du et al. (2015); Rybakov et al. (2015) that may stabilize these chiral correlations in directions perpendicular to the applied magnetic field.
On the other hand, the existence of (isolated) biskyrmion and multiskyrmion states within the conical phase arising from an attractive interskyrmion potential has been established theoretically Leonov et al. (2016). However, the results presented here rather support lattices of skyrmions rather than isolated skyrmions and are as such more in agreement with the theoretical computations of Wilson et al. (2014). They predict the stabilization of metastable skyrmion lattices over a large fraction of the phase diagram below . These metastable skyrmion lattice are formed by cooling through the precursor region above where they are nucleated. A subsequent drop in temperature below turns the skyrmion lattices in metastable states of which the stability increases with decreasing Wilson et al. (2014).
These theoretical predictions are also inline with the differences observed between Fast and Field Cooling. During fast field cooling, the exposure of the skyrmion lattice to the region just below where the energy barrier heights are relatively small, is limited as compared to slow field cooling. This results in a smaller deterioration of the SkL correlations for the fast FC case and a stronger intensity at lower temperatures.
A recent experimental study showed that metastable SkL correlations can also be quenched by applying extremely high cooling rates of 700 Ks-1 in MnSi Oike et al. (2016). These high cooling rates are required to circumvent the unwinding of the SkL as observed in bulk Fe0.5Co0.5Si by Milde et al. (2013) with magnetic force microscopy. However, the cooling rates applied in this study are more than three orders of magnitude higher, suggesting that the unwinding of the Skl in Fe0.7Co0.3Si occurs at a totally different timescale than in MnSi. The observation of these metastable skyrmion lattice phase over macroscopic time scales in Fe0.7Co0.3Si may be attributed to the combination of quenched chemical disorder that is due to the solid solution of Fe and Co.
V Conclusion
To conclude, we observe a pronounced history and cooling-rate dependence of the magnetic phase diagram below in Fe0.7Co0.3Si. By cooling under field, metastable skyrmion lattice correlations are observed outside the thermodynamically stable -phase until the lowest temperature. These thermodynamic metastable skyrmion lattice correlations coexist with the conical phase and do not only appear at temperatures below the -phase but also at fields smaller or higher than the fields required to stabilize the -phase. The intensity of these skyrmion lattice correlations can be enhanced by increasing the cooling rate as the increased cooling limit possibly reduces the unwinding of the SkL in a region just below . The observation of these phenomena with the macroscopic cooling rates used in a neutron scattering experiment may be related to the quenched chemical disorder from the solid solution of Fe and Co.
Acknowledgements.
LB, FQ and CP thank Maxim Mostovoy for valuable discussions and comments. The work of LB is financially supported by The Netherlands Organisation for Scientific Research through the project 721.012.102. FQ acknowledges financial support from China Scholarship Council (CSC). FQ and CP acknowledge funding from the European Union Seventh Framework Program [FP7/2007-2013] under grant agreement Nr. 283883.References
- Dzyaloshinski (1958) I. E. Dzyaloshinski, J. Phys. Chem. Solids 4, 241 (1958).
- Moriya (1960) T. Moriya, Phys. Rev 120, 91 (1960).
- Bogdanov and Yablonskii (1989) A. Bogdanov and D. Yablonskii, Zh. Eksp. Teor. Fiz 95, 182 (1989).
- Bogdanov and Hubert (1994) A. Bogdanov and A. Hubert, J. Magn. Magn. Mater. 138, 255 (1994).
- Rößler et al. (2006) U. K. Rößler, A. N. Bogdanov, and C. Pfleiderer, Nature 442, 797 (2006).
- Mühlbauer et al. (2009) S. Mühlbauer, B. Binz, F. Jonietz, C. Pfleiderer, A. Rosch, A. Neubauer, R. Georgii, and P. Böni, Science 323, 915 (2009).
- Yu et al. (2010) X. Yu, Y. Onose, N. Kanazawa, J. Park, J. Han, Y. Matsui, N. Nagaosa, and Y. Tokura, Nature 465, 901 (2010).
- Münzer et al. (2010) W. Münzer, A. Neubauer, T. Adams, S. Mühlbauer, C. Franz, F. Jonietz, R. Georgii, P. Böni, B. Pedersen, M. Schmidt, et al., Phys. Rev. B 81, 041203 (2010).
- Nagaosa and Tokura (2013) N. Nagaosa and Y. Tokura, Nature Nanotechnology 8, 899 (2013).
- Moskvin et al. (2013) E. Moskvin, S. Grigoriev, V. Dyadkin, H. Eckerlebe, M. Baenitz, M. Schmidt, and H. Wilhelm, Phys. Rev. Lett. 110, 077207 (2013).
- Yu et al. (2011) X. Z. Yu, N. Kanazawa, Y. Onose, K. Kimoto, W. Z. Zhang, S. Ishiwata, Y. Matsui, and Y. Tokura, Nature Materials 10, 106 (2011).
- Du et al. (2014) H. Du, J. P. DeGrave, F. Xue, D. Liang, W. Ning, J. Yang, M. Tian, Y. Zhang, and S. Jin, Nano Letters 14, 2026 (2014).
- Oike et al. (2016) H. Oike, A. Kikkawa, N. Kanazawa, Y. Taguchi, M. Kawasaki, Y. Tokura, and F. Kagawa, Nature Physics 12, 62 (2016).
- Grigoriev et al. (2014) S. V. Grigoriev, N. M. Potapova, E. V. Moskvin, V. A. Dyadkin, C. Dewhurst, and S. V. Maleyev, JETP Letters 100, 216 (2014).
- Wilson et al. (2014) M. N. Wilson, A. B. Butenko, A. N. Bogdanov, and T. L. Monchesky, Physical Review B 89, 094411 (2014).
- Romming et al. (2015) N. Romming, A. Kubetzka, C. Hanneken, K. von Bergmann, and R. Wiesendanger, Physical Review Letters 114, 177203 (2015).
- Kézsmárki et al. (2015) I. Kézsmárki, S. Bordács, P. Milde, E. Neuber, L. M. Eng, J. S. White, H. M. Rønnow, C. D. Dewhurst, M. Mochizuki, K. Yanai, H. Nakamura, D. Ehlers, V. Tsurkan, and A. Loidl, Nature Materials 14, 1116 (2015).
- Beille et al. (1981) J. Beille, J. Voiron, F. Towfiq, M. Roth, and Z. Y. Zhang, Journal of Physics F: Metal Physics 11, 2153 (1981).
- Ishida et al. (1985) M. Ishida, Y. Endoh, S. Mitsuda, Y. Ishikawa, and M. Tanaka, J. Phys. Soc. Jpn. 54, 2975 (1985).
- Grigoriev et al. (2009) S. V. Grigoriev, D. Chernyshov, V. A. Dyadkin, V. Dmitriev, S. V. Maleyev, E. V. Moskvin, D. Menzel, J. Schoenes, and H. Eckerlebe, Phys. Rev. Lett. 102, 037204 (2009).
- Bak and Jensen (1980) P. Bak and M. H. Jensen, Journal of Physics C: Solid State Physics 13, L881 (1980).
- Beille et al. (1983) J. Beille, J. Voiron, and M. Roth, Solid State Comm. 47, 399 (1983).
- Ishimoto et al. (1995) K. Ishimoto, Y. Yamaguchi, J. Suzuki, M. Arai, M. Furusaka, and Y. Endoh, Physica B 213, 381 (1995).
- Grigoriev et al. (2007) S. Grigoriev, V. Dyadkin, D. Menzel, J. Schoenes, Y. O. Chetverikov, A. Okorokov, H. Eckerlebe, and S. Maleyev, Phys. Rev. B 76, 224424 (2007).
- Takeda et al. (2009) M. Takeda, Y. Endoh, K. Kakurai, Y. Onose, J. Suzuki, and Y. Tokura, J. Phys. Soc. Jpn. 78, 093704 (2009).
- Bauer et al. (2016) A. Bauer, M. Garst, and C. Pfleiderer, Physical Review B 93, 235144 (2016).
- Bauer et al. (2010) A. Bauer, A. Neubauer, C. Franz, W. Münzer, M. Garst, and C. Pfleiderer, Physical Review B 82, 064404 (2010).
- Du et al. (2015) H. Du, R. Che, L. Kong, X. Zhao, C. Jin, C. Wang, J. Yang, W. Ning, R. Li, C. Jin, X. Chen, J. Zang, Y. Zhang, and M. Tian, Nature Communications 6, 8504 (2015).
- Rybakov et al. (2015) F. N. Rybakov, A. B. Borisov, S. Blügel, and N. S. Kiselev, Physical Review Letters 115, 117201 (2015).
- Leonov et al. (2016) A. O. Leonov, T. L. Monchesky, J. C. Loudon, and A. N. Bogdanov, arXiv.org , arXiv:1602.02353 (2016), 1602.02353 .
- Milde et al. (2013) P. Milde, D. Köhler, J. Seidel, L. Eng, A. Bauer, A. Chacon, J. Kindervater, S. Mühlbauer, C. Pfleiderer, S. Buhrandt, et al., Science 340, 1076 (2013).