On the nature and correction of the spurious S-wise spiral galaxy winding bias in Galaxy Zoo 1
Abstract
The Galaxy Zoo 1 catalog displays a bias towards the S-wise winding direction in spiral galaxies which has yet to be explained. The lack of an explanation confounds our attempts to verify the Cosmological Principle, and has spurred some debate as to whether a bias exists in the real universe. The bias manifests not only in the obvious case of trying to decide if the universe as a whole has a winding bias, but also in the more insidious case of selecting which galaxies to include in a winding direction survey. While the former bias has been accounted for in a previous image-mirroring study, the latter has not. Furthermore, the bias has never been corrected in the GZ1 catalog, as only a small sample of the GZ1 catalog was re-examined during the mirror study. We show that the existing bias is a human selection effect rather than a human chirality bias. In effect, the excess S-wise votes are spuriously “stolen” from the elliptical and edge-on-disk categories, not the Z-wise category. Thus, when selecting a set of spiral galaxies by imposing a threshold so that or , we spuriously select more S-wise than Z-wise galaxies. We show that when a provably unbiased machine selects which galaxies are spirals independent of their chirality, the S-wise surplus vanishes, even if humans are still used to determine the chirality. Thus, when viewed across the entire GZ1 sample (and by implication, the Sloan catalog), the winding direction of arms in spiral galaxies as viewed from Earth is consistent with the flip of a fair coin.
1 Introduction
The Cosmological Principle is the assumption that at large scales the universe is homogeneous and isotropic. Homogeneity says that there is no special location in the Universe, and in particular that the Earth occupies no special location. Isotropy means that there is no preferred direction in the universe; for spiral galaxies, this means that the distribution of their spin axes should be spread uniformly at random on the celestial sphere. The two assumptions together imply that, as seen from the Earth, the distribution of observed arm winding directions of spiral galaxies should be statistically consistent with flips of a fair coin.
The Galaxy Zoo 1 (hereafter GZ1) project (Lintott et al., 2008, 2010) was a website where humans were presented with random galaxy images from the Sloan Digital Sky Survey (York et al., 2000). With each galaxy image they were given a choice of 6 “cartoon” galaxies and asked which cartoon most resembled the real galaxy. The GZ1 sample has almost 900,000 galaxies. After using SpArcFiRe (Davis and Hayes, 2014) to perform an ellipse fit of all GZ1 images, we concentrate on a subsample of 458,012 galaxies whose minor axis were larger than 14 pixels (semi-minor axis of 7 pixels), which we subjectively determined was the smallest sized disk on which spiral structure could be observed. For each galaxy, the number of votes for each of the 6 categories was converted into a fraction (Table 1).
| category | EL | EDGE | S-wise | Z-wise | MG | DK | total |
|---|---|---|---|---|---|---|---|
| Winner by 50% majority | 261700 | 53873 | 25102 | 23807 | 4431 | 755 | 369668 |
| Percentage | 57.14% | 11.76% | 5.48% | 5.20% | 0.97% | 0.16% | 80.71% |
| Winner by max vote | 309591 | 73009 | 33007 | 31340 | 8406 | 2659 | 458012 |
| Percentage | 67.59% | 15.94% | 7.21% | 6.84% | 1.84% | 0.58% | 100% |
As can be seen in Table 1, there is a significant excess of S-wise spiral galaxies, using either a majority-vote winner, or a less stringent “max vote” winner; similar surplusses of S-wise spirals are seen using other, more stringent criteria (Lintott et al., 2008; Land et al., 2008). In our case, using the 50% majority-wins criterion, there are galaxies with visible spiral structure, but there is an S-wise excess of (see Table 2) compared to 48909 coin flips; the “max vote” criterion shows an even stronger excess, with a statistical significance of . As we will see from Table 2 below, the effect gets smaller as we insist on higher human classification confidence, but never goes away even when 100% of humans agree on the chirality of a small set of galaxies. The statistical significance of this bias is detailed as a function of human confidence in the first quarter of Table 2, in which both the selection of galaxies, and their chirality, are chosen by GZ1 humans. As can be seen, the bias is detected at a level of somewhere between and , depending upon the human confidence level.
Whether this excess is real or not has been a matter of some debate. Lintott et al. (2008) and Land et al. (2008) show that the bias seems to disappear if galaxy images are flipped with 50% probability before being shown to humans, suggesting that somehow the humans are biased towards choosing S-wise galaxies. Whether the bias is a human cognitive bias, or perhaps due to website design or positioning of the buttons is unclear, and of little astronomical interest in any case. However, other studies (Longo, 2011; Shamir, 2012) have suggested that the bias is real rather than artifactual.
In this paper we put the problem to rest. We show below that the bias is almost certainly a human bias, and not a property of the actual GZ1 galaxies.
2 Nature of the bias
2.1 More S-wise than Z-wise spins for all values of “spirality”
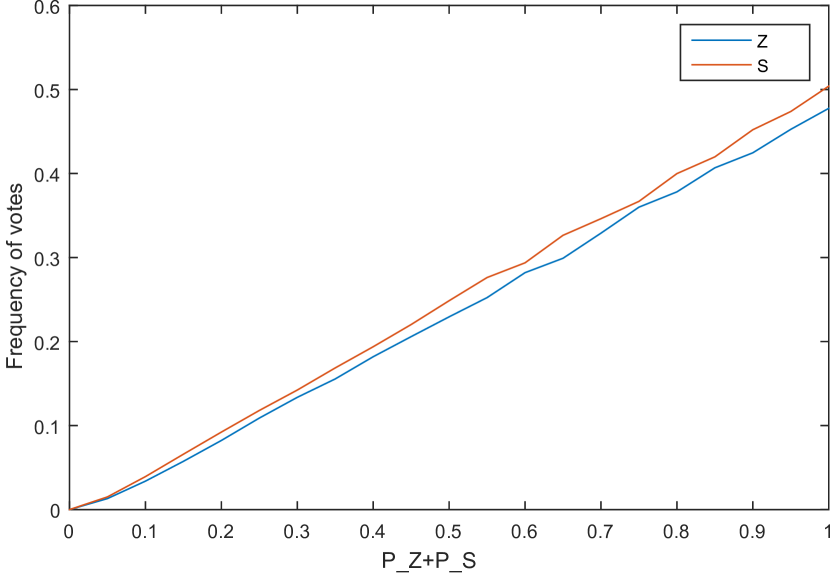
Figure 1 shows the frequencies of galaxies with the two winning chiralities, as voted by GZ1 humans, as a function of their sum . We refer to this sum as the spirality of a galaxy, and its value is meant to represent the probability that there exists any observable spiral structure.111As distinct from GZ1’s , which includes edge-on disks and represents if the galaxy, as seen from any direction, is a disk galaxy. As can be seen, the S-wise bias manifests across all values of spirality even down close to zero, where the galaxies are unlikely to be spiral at all. Furthermore, we note that if one chooses any cutoff in spirality (or similarly ) meant to isolate galaxies with visible spiral structure, then any such sample will automatically include more S-wise than Z-wise galaxies, because the S-wise curve is uniformly above the Z-wise one for all values of spirality. We shall demonstrate, as did Land et al. (2008) and Lintott et al. (2008), that this bias is spurious and not reprentative of the true chirality distribution.
2.2 Do humans actually disagree on chirality?
Land et al. (2008) briefly mentioned that there did not appear to be significant disagreement between humans about chirality. This statement seems at odds with Figure 1. Here we study that statement in detail, because understanding it may prove crucial to understanding where the bias comes from. To test the hypothesis that humans can disagree on the chirality of a galaxy, we introduce the idea of the opposing vote, which we define for any galaxy as the most popular vote other than the most popular chirality. Note that this is not quite the same as the second most popular vote, because if the most popular chirality is not the most popular vote overall, then the opposing vote is actually the winning vote overall. In other words,
-
1)
When one of the two chiralities is the winning vote, then the opposing vote is the second most popular vote.
-
2)
When neither of the two chiralities is the winning vote, the “opposing vote” is the winning vote for that galaxy.
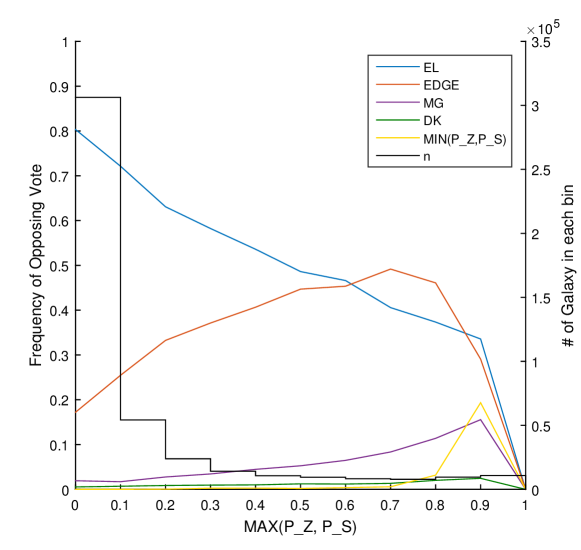
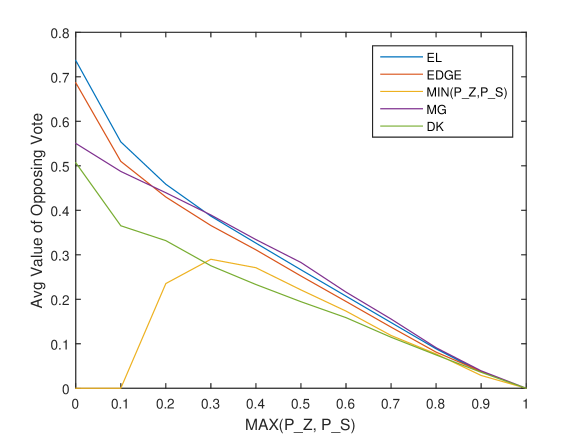
Figure 2 describes the distribution and structure of the opposing votes, as a function of the most popular chirality, which is just , even if that winning chirality is not the winning vote across all 6 votes. The top half of Figure 2 shows the frequency that each of the other 5 votes (which are the losing chirality plus EL, EDGE, MG, DK) occur as the opposing vote. The first observation is that the losing chirality, , is almost never the opposing vote, even for very small values of the winning vote. That is to say, humans virtually never disagree on the chirality of a galaxy; even when only a small percentage of people actually choose a chirality, they still agree on that chirality.
Instead, the top half of Figure 2 demonstrates that the opposing vote is almost always either EDGE or EL. This tells us that the selection effect in Figure 1 occurs when people are uncertain whether they see spiral structure at all; the galaxy may be an edge-on disk galaxy with indistinct spiral structure, or appear to be elliptical that has faint spiral structure, but those that choose a chirality in that case tend, for whatever reason, to be slightly more inclined to choose S-wise over Z-wise, but even in those cases the humans tend to agree with each other on the chirality chosen. In other words, to arrive at the S-wise bias, humans are “stealing” votes from EDGE and EL, not from Z-wise. This allows the bias to exist even though humans virtually never disagree on chirality. Another interesting observation of the top half of Figure 2 is that near the origin, the EL and EDGE curves correctly show that, among galaxies that have no visible spiral structure, about 80% are elliptical and just under 20% are edge-on—in rough agreement with Table 1.
The bottom half of Figure 2 shows the average value of the opposing vote—i.e., the fraction of people, per-galaxy, who cast the opposing vote. As expected, as the winning chirality approaches 1, the average value of the opposing vote approaches zero. Also of interest is the fact that the sum of the winning chirality and the opposing vote value tends, on average, to be above 70%, so that the top two votes take the lion’s share of the votes. We do see, however, that even though the losing chirality is rarely the opposing vote, it tends to be a strong second when it does occur; these are probably galaxies that have strong spiral structure but are somehow disrupted so as to make the chirality unclear; one may hazard a guess that they may in fact be advanced mergers.
Finally, again referring to Figure 2, the sharp peak of the losing chirality (yellow line) at in the top figure is not a problem because, as the lower figure shows, the value of that vote is tiny, as is the value of all the other non-winning votes (as they must be, since the winning chirality is taking 90% of the votes).
These graphs show that humnans do not significantly disagree with each other when determining chirality, which is an observation that is not at all obvious from any of the studies that have occurred to date. In fact it would be surprising if humans disagreed to any significant extent on winding direction, because in all but a very small number of cases, our own intuitive observation is that if there is a winding direction at all, it should be fairly obvious. These graphs strongly confirm this intuition. Together, Figures 1 and 2 demonstrate that the bias has nothing to do with humans disagreeing on winding direction. Instead, what is happening is that whenever there is uncertainty about whether or not there exists spiral structure of any chirality—that is, when a significant proportion of humans vote either edge-on or elliptical—then those that do vote for a chirality tend to vote for S-wise. The reason for this is still unknown, but the three obvious choices are (a) a human visual cortex bias; (b) something about the design of the web page for the GZ1 survey induces people to preferentially choose the S-wise button; or (c) there is a real chirality bias in the SDSS sample of galaxies.
3 Unbiased machine determination of winding direction
At this point we have two relevant observations: (1) galaxies voted S-wise significantly outnumber galaxies voted Z-wise, and (2) humans do not significantly disagree on chirality. In the absense of evidence for a human bias, this would directly imply that there is a real chirality bias in the universe. Land et al. (2008) convincingly demonstrated that this is not the case by having the GZ1 humans re-classify a subset of spiral galaxies while randomly left-right flipping each image with 50% probability. However, beyond demonstrating that the bias was human, they did not attempt to correct for it on a galaxy-by-galaxy basis.
SpArcFiRe222SPiral ARC FInder and REporter Davis and Hayes (2014) is an automated method that decomposes a spiral galaxy into its constituent arms. A very brief summary of how SpArcFiRe works is depicted in Figure 3. As described in Davis (2014); Davis and Hayes (2014), it was tested on a sample of 29,250 GZ galaxy images chosen by the leader of the Galaxy Zoo Project333Stephen Bamford, Personal Communication. The selection criteria were: OR AND AND .. Among many other things, one of SpArcFiRe’s outputs is a determination of the galaxy’s winding direction. Given a list of found spiral arcs in a galaxy image, there are many ways to determine a global winding direction for the entire galaxy. Some arcs are longer than others, some may wind in the opposite direction to the majority, and some “arcs” are actually just noise mistaken for an arc. We found that the most reliable measure of the winding direction of the galaxy was a length-weighted vote of the winding direction of all the discovered spiral arcs.
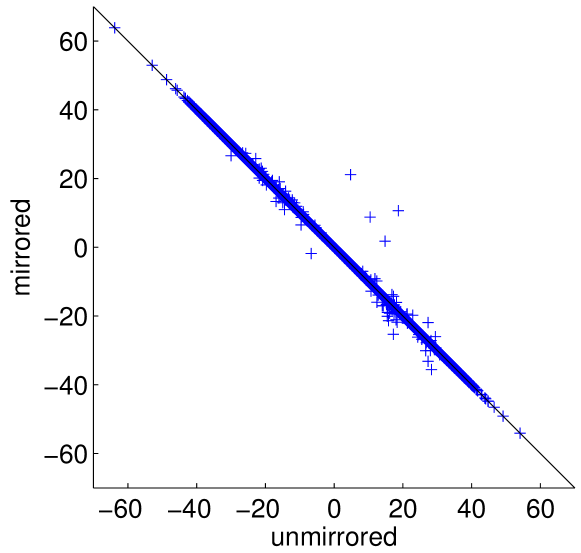
To demonstrate that this measure is unbiased with regard to spin direction, we refer to Figure 4, which shows a scatter plot of the left-to-right mirrored vs. unmirrored value of the galaxy’s pitch angle as measured by SpArcFiRe; in a perfect reversal, the two should be negatives of each other. We find that in 29,094 out of 29,250 cases (99.47% of cases), the two are negatives of each other to within degrees. Even more relevant to this paper, we find that in all but 5 cases (99.983% of cases), the chirality of the mirrored image is correctly flipped compared to the unmirrored case. Thus, the chirality determination of SpArcFiRe is unbiased, with respect to flipped images, to better than 2 parts it .
We then ran SpArcFiRe on the entire Galaxy Zoo sample of galaxies, in order to determine the chirality of galaxies in an unbiased manner. However, we still used the human GZ1 determination of to select which galaxies actually display spiral structure. The second quarter of Table 2 details the statistical significance of the winding direction bias, as a function of the human confidence in observed spiral structure, but when the chirality is determined by the unbiased SpArcFiRe algorithm. The statistical signifance of the S-wise bias is weaker than in the first quarter of Table 2, but surprisingly, the bias is still significant to somewhere between and .
4 Unbiased machine determination of spirality
Our goal in this section is to explain how we created a machine learning algorithm that was capable of reproducing the spirality , while being simultaneously unable to reproduce either nor alone. That is, we want to create a spirality measure for a galaxy that is provably independent of chirality.
4.1 Building a selector that is unbiased to chirality
As alluded to earlier, the problem is not in the actual determination of chiraltiy. Humans do not disagree with each other on chirality, and in fact the human determination of chirality agrees with the SpArcFiRe determination of chirality in between 95% and 98% of cases on the GZ1 clean sample, depending upon SpArcFiRe’s own determination of its certainty(Davis, 2014, tables 5.1 and 5.2, column “80”), and the cases of chirality disagreement between GZ1 humans and SpArcFiRe appear randomly distributed.
Figure 1 points to the problem: S-wise galaxies outnumber Z-wise ones for any set of galaxies selected using a criterion of either or greater than some threshold , and and are taken from the human GZ1 vote values. Thus, we must determine some method of determining if there is a selection bias and if so, try to eliminate it.
To do this, we need to create a sample of galaxies that have visible spiral structure (“spirality”), but selected in a way that is unbiased to winding direction. To do this we create a machine learning algorithm that is provided with attributes of the galaxy that are independent of winding direction, and tell it to attempt to reproduce . We then demonstrate that it can reproduce with reasonable accuracy and then show that it is unable to simultaneously reproduce winding direction to any level better than chance.
In order to create such an algorithm, we need to ensure that the features it uses (that is, the measurements of the galaxy) are features that are independent of chirality. This may not be trivial, as recent work has suggested that even photometric data may be able to recover winding diretion to a significant degree (Shamir, 2016). We choose our attributes to include some photometric attributes that were disjoint with those that Shamir (2016) found to be correlated with chirality, in addition to several SpArcFiRe outputs with all chirality information removed.
Our list of input attributes to our machine learning algorithm, assumed to be independent of chirality, are as follows. From the SDSS database, we allow parameters used by Banerji et al. (2010) (colors, de Vaucouleurs fit axial ratios, exponential fit axial ratios, exponential disk fit log likelihood, de Vaucouleurs fit log likelihood, star log likelihood, ratios of Petrosian radii, Adaptive shape measures, adaptive ellipticities, adaptive 4th moment, and a texture parameter), as well as absolute magnitudes and disk-to-bulge ratios. From SpArcFiRe (Davis and Hayes, 2014) we allow all numerical output parameters including pitch angles after having taken their absolute value. Such parameters include counts and lengths of spiral arcs, the absolute value of their pitch angles, and the number and length of arcs of agreeing and disagreeing chiralities (with the actual chirality replaced by ”majority” and ”minority”).
Finally, since it is known that machine learning algorithms tend to reproduce the input distribution of target values we trained our machine on a set of galaxies that were 50-50 S-wise and Z-wise according to the GZ1 humans.
We applied two filters to the data to build a dataset of high-confidence spiral galaxies. For S-wise the rule was ; which means that there are at least 60% of the votes for spirality, at least 50% of the final votes were for , and there is at least 30% more votes for than for . The first and second rules are effective in filtering out other types of objects and the third in making sure that the humans have a higher agreement not only in spirality but also in chirality. Similarly to build our Z-wise set the rule was . After this we sampled 19500 objects from each class, to assure we had a balanced dataset, totaling 39000 objects.
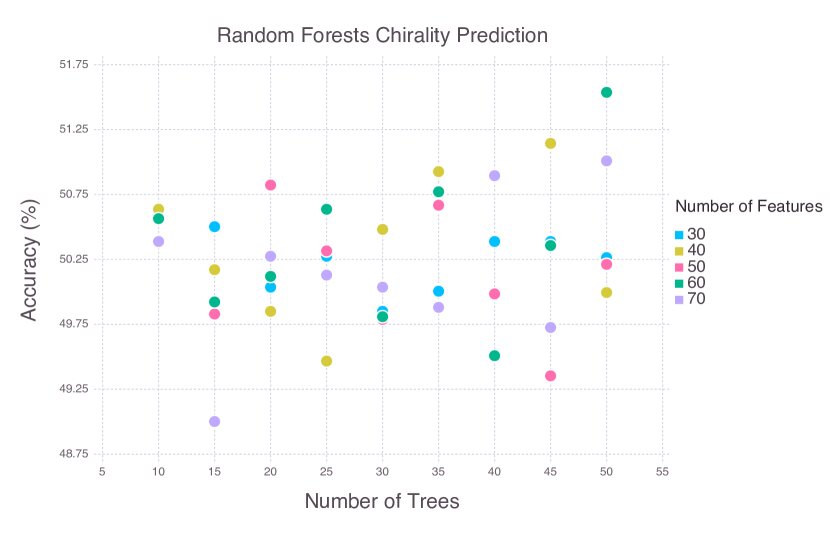
We built a random forest model to predict chirality. As it is common with these models, we performed what is called a “hyperparameter” search across possible machine configurations to decide what was the optimal number of trees per forest and the optimal number of features per tree. We built 45 models with number of trees varying on the interval {10,15,20,25,30,35,40,45,50} and number of features per tree from {30,40,50,60,70}. We used a Bernoulli distribution to sample 75% of the data for training the forests and the remaining 25% to test the models.
As mentioned above we expect not to be able to predict chirality with any level of confidence. The accuracy of the models range from from 49% to 51.25%, heavily centered around 50, as it is portrayed in Figure 5. Due to chance in data sampling and the way that Random Forests are built we expected this variability to occur. Notice that 15, or 1/3 of all the models built, have an accuracy below 50%, i.e they are worse than a coin flip for tracking chirality. To make sure that our models are not able to indeed predict chirality we decided to further investigate the 3 models that had at least 51% accuracy.
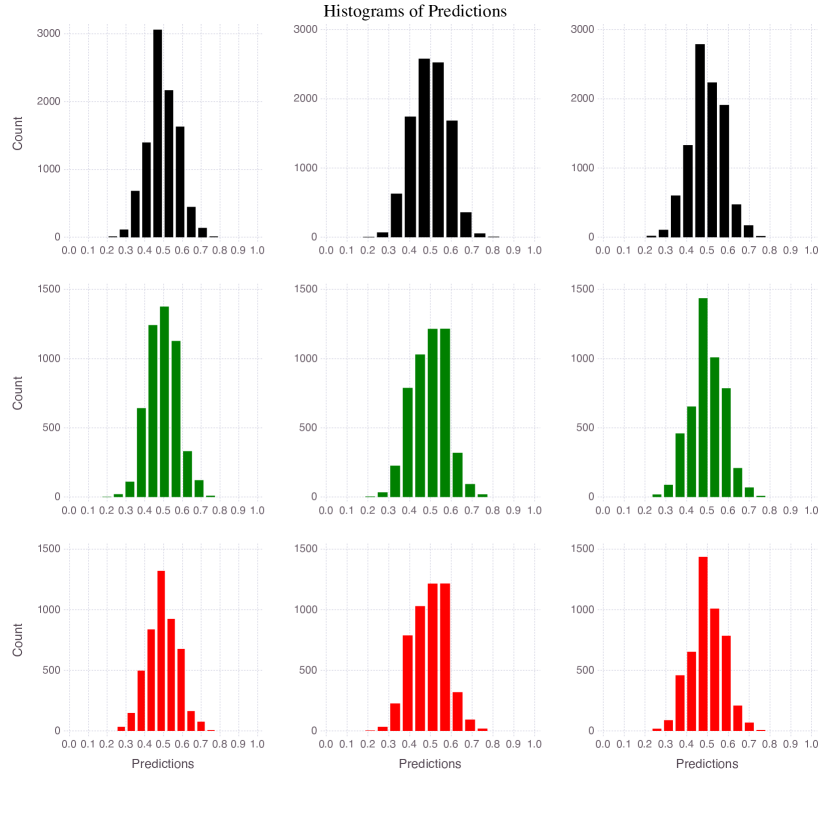
When performing a classification task in machine learning one can have a notion of how confident a model is. For our case we set up the target to be either 0, to predict , or 1, to predict . The model outputs a number P within this range: if we say the predicted class for that object was , if the predicted class is . The more confident a model is that an object belongs to either class the closer the output value will be to those limits (0 and 1). That means that when a model is not very confident of its output, the values predicted will fall mostly in the middle value of the range. To better visualize this distribution Figure 4 shows histograms from the 3 models that had at least 51% accuracy. As we had supposed, the distributions are heavily centered, indicating that the model has a very low level of confidence on its predictions. Also, from the 3 models at least 77% of the predictions were between 0.4 and 0.6, i.e., the model had less than 20% of confidence on the output for at least 77% of the objects.
To ensure once and for all that these models performance was due to chance we rebuilt those three models using the same data,the same Bernoulli distribution and the same split for test and training and at the end we got different accuracy values for the 3 models that were previously at least 51%. The best out of the 3 now has an accuracy of 50.23%.
We conclude that with these models, given these attributes we are unable to retain any information that correlates in any way to chirality of spiral galaxies.
4.2 Using the same machine to predict spirality
Now that we have a list of attributes and a machine that is unable to predict chirality in the form of either or alone, we use a machine with the same input attributes and hyperparameters to reproduce the sum , which we term the spirality of a galaxy.
Given a list of human spirality votes for each galaxy, we train the machine on 75% of the galaxies and test it on the remaining 25%; we do this four times, for four non-overlapping 25% subsets. The concatenation of these four 25% test subsets constitute our database of machine-determined spiralities that are independent of chirality. Given a particular galaxy, the difference between the human value and our predicted spirality is the error for that galaxy. The root mean squared error across all galaxies is a typical measure used to assess the accuracy of a predicted model. In our case, we were able to produce a machine with an RMSE of 0.137 across our sample of 450,012 galaxies. This is quite a bit larger than what other machines have done; for example the Kaggle winner was able to produce an RMSE of just 0.07 (Dieleman et al., 2015). However, they made no effort to remove human bias, and thus it is not surprising that they are able to reproduce exactly how the humans voted better than we can.
5 Results
| spirality | chirality | spirality | sigma | |||
|---|---|---|---|---|---|---|
| selector | determination | cutoff | S-wise | Z-wise | value | -value |
| GZ1 | GZ1 | 0.4 | 32016 | 30619 | 5.58 | |
| humans | humans | 0.5 | 25625 | 24572 | 4.70 | |
| 0.6 | 20952 | 20093 | 4.24 | |||
| 0.7 | 16631 | 16004 | 3.47 | 0.0002 | ||
| 0.8 | 12444 | 11932 | 3.28 | 0.0004 | ||
| 0.9 | 7774 | 7435 | 2.75 | 0.0030 | ||
| GZ1 | SpArcFiRe | 0.4 | 31633 | 31002 | 2.52 | 0.006 |
| humans | 0.5 | 25417 | 24780 | 2.84 | 0.002 | |
| 0.6 | 20774 | 20271 | 2.48 | 0.007 | ||
| 0.7 | 16533 | 16102 | 2.39 | 0.010 | ||
| 0.8 | 12339 | 12037 | 1.93 | 0.030 | ||
| 0.9 | 7708 | 7501 | 1.68 | 0.050 | ||
| unbiased | GZ1 | 0.4 | 29979 | 30184 | 0.84 | 0.250 |
| machine | humans | 0.5 | 19829 | 19743 | 0.43 | 0.130 |
| 0.6 | 13130 | 13093 | 0.23 | 0.400 | ||
| 0.7 | 8510 | 8371 | 1.07 | 0.150 | ||
| 0.8 | 5028 | 4895 | 1.34 | 0.100 | ||
| 0.9 | 2231 | 2119 | 1.70 | 0.040 | ||
| unbiased | SpArcFiRe | 0.4 | 30103 | 30060 | 0.18 | 0.40 |
| machine | 0.5 | 19800 | 19772 | 0.14 | 0.45 | |
| 0.6 | 13063 | 13160 | 0.60 | 0.30 | ||
| 0.7 | 8371 | 8510 | 1.07 | 0.15 | ||
| 0.8 | 4895 | 5028 | 1.34 | 0.09 | ||
| 0.9 | 2121 | 2229 | 1.64 | 0.05 |
The bottom half of Table 2 shows the results of our chirality bias study when our unbiased machine (§4) selects galaxies based on predicted spirality. As can be seen, using this machine to perform selection virtually eliminates the chirality bias, even if humans still choose the chirality. This confirms our statement earlier that the GZ1 humans have a selection bias, not a chirality bias. In fact there is no significant difference between the two subtables in the lower half of Table 2: as long as our machine learning algorithm performs the selection based on unbiased spirality, it doesn’t matter if the winding direction is determined by humans, or by SpArcFiRe. In either case, the S-wise bias is either vastly reduced, or reversed, apparently at random.
6 Discussion
Ideally we would like to integrate our new catalog into the GZ1 catalog so as to publish a “corrected” vote catalog in which the chirality bias has been removed. However, this is not as simple as rescaling the and values to our values. Recall that the S-wise votes are “stolen” from the edge-on and elliptical categories. Thus, we would need to re-scale all the vote values on a galaxy-by-galaxy basis, not just the two chirality votes, in order to fully correct the bias. Furthermore, we would like to do this in a way that only minimally changes the values of the human votes. Creating a machine algorithm that simultaneously removes the bias, and also minimizes the change in human vote values, is non-trivial, and left for future work.
Acknowledgements
PS was supported by CAPES (Coordination for the Improvement of Higher Education Personnel - Brazil) through the Science Without Borders fellowship for PhD Studies. We thank Leon Cao for an early version of the classifier, and Tina Yang for plotting the Figures describing the GZ1 human handedness bias.
References
- Banerji et al. (2010) Banerji, M., O. Lahav, C. J. Lintott, F. B. Abdalla, K. Schawinski, S. P. Bamford, D. Andreescu, P. Murray, M. J. Raddick, A. Slosar, et al. (2010). Galaxy zoo: reproducing galaxy morphologies via machine learning. Monthly Notices of the Royal Astronomical Society 406(1), 342–353.
- Davis (2014) Davis, D. R. (2014). Fast Approximate Quantification of Arbitrary Arm-Segment Structure in Spiral Galaxies. Phd thesis, University of California, Irvine.
- Davis and Hayes (2014) Davis, D. R. and W. B. Hayes (2014). Sparcfire: Scalable automated detection of spiral galaxy arm segments. The Astrophysical Journal 790(2), 87.
- Dieleman et al. (2015) Dieleman, S., K. W. Willett, and J. Dambre (2015). Rotation-invariant convolutional neural networks for galaxy morphology prediction. Monthly notices of the royal astronomical society 450(2), 1441–1459.
- Land et al. (2008) Land et al., K. (2008, August). Galaxy Zoo: the large-scale spin statistics of spiral galaxies in the Sloan Digital Sky Survey. MNRAS 388(4), 1686–1692.
- Lintott et al. (2010) Lintott et al., C. (2010). Galaxy Zoo 1: Data release of morphological classifications for nearly 900,000 galaxies. MNRAS 14(1), 1–14.
- Lintott et al. (2008) Lintott et al., C. J. (2008). Galaxy Zoo: Morphologies derived from visual inspection of galaxies from the Sloan Digital Sky Survey. MNRAS 389, 1179–1189.
- Longo (2011) Longo, M. J. (2011, May). Detection of a dipole in the handedness of spiral galaxies with redshifts z ~ 0.04. Phys. Lett. B 699(4), 224–229.
- Shamir (2012) Shamir, L. (2012). Handedness asymmetry of spiral galaxies with z¡ 0.3 shows cosmic parity violation and a dipole axis. Physics Letters B 715(1), 25–29.
- Shamir (2016) Shamir, L. (2016). Asymmetry between galaxies with clockwise and counterclockwise handedness. arXiv preprint arXiv:1601.04424.
- York et al. (2000) York et al., D. (2000). The Sloan Digital Sky Survey: Technical summary. Astron. J. 120, 1579–1587.