Harmonic Sum-based Method for Heart Rate Estimation using PPG Signals Affected with Motion Artifacts
Abstract
Wearable photoplethysmography (WPPG) has recently become a common technology in heart rate (HR) monitoring. General observation is that the motion artifacts change the statistics of the acquired PPG signal. Consequently, estimation of HR from such a corrupted PPG signal is challenging. However, if an accelerometer is also used to acquire the acceleration signal simultaneously, it can provide helpful information that can be used to reduce the motion artifacts in the PPG signal. By dint of repetitive movements of the subject’s hands while running, the accelerometer signal is found to be quasi-periodic. Over short-time intervals, it can be modeled by a finite harmonic sum (HSUM). Using the harmonic sum (HSUM) model, we obtain an estimate of the instantaneous fundamental frequency of the accelerometer signal. Since the PPG signal is a composite of the heart rate information (that is also quasi-periodic) and the motion artifact, we fit a joint harmonic sum (HSUM) model to the PPG signal. One of the harmonic sums corresponds to the heart-beat component in PPG and the other models the motion artifact. However, the fundamental frequency of the motion artifact has already been determined from the accelerometer signal. Subsequently, the HR is estimated from the joint HSUM model. The mean absolute error in HR estimates was 0.7359 beats per minute (BPM) with a standard deviation of 0.8328 BPM for 2015 IEEE Signal Processing (SP) cup data. The ground-truth HR was obtained from the simultaneously acquired ECG for validating the accuracy of the proposed method. The proposed method is compared with four methods that were recently developed and evaluated on the same dataset.
Keywords:
Wearable Photoplethysmography (WPPG) Heart Rate (HR) Biomedical Signal ProcessingMotion Artifact Physical Activities Body Sensor Networks Wearable Biosensors Fitness Tracking.1 Introduction
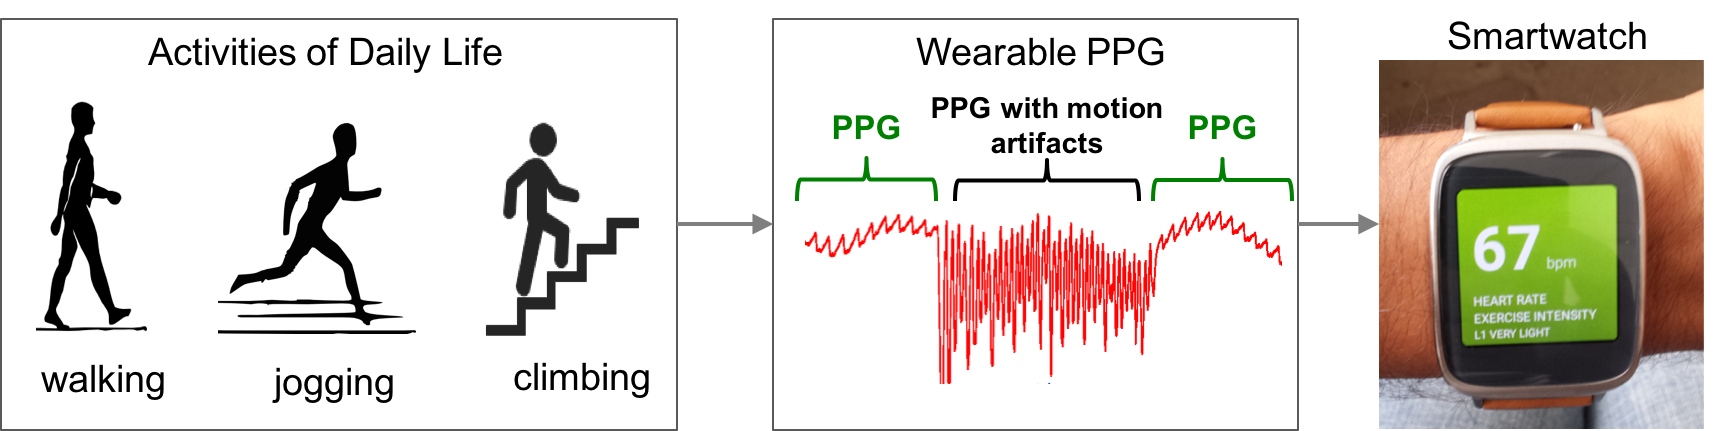
Use of wearable sensors such as wrist-bands and smartwatches for monitoring vitals stats of the patients and/or healthy individual is a common trend in recent years (Dubey et al, 2015b, c, a; Monteiro et al, 2016; Dubey et al, 2016b). Wearable body sensors are trending for telemonitoring of personalized health parameters such as heart rate (HR), activity, sleep quality, steps, and calories burned. Wearable sensors have been used in education sector such as analysis of peer-led team learning groups (Dubey et al, 2016c, a). Even though, the design of personalized wearable devices is becoming more elegant and user-friendly, their performance is questionable with respect to data reliability. For example, Spierer et al. (Spierer et al, 2015) reported that commercial wearable sensors under performed significantly in monitoring HR during daily life activities such as walking, biking, and stair climbing. They used commercial, wearable photoplethysmography (WPPG) sensors that are nowadays found in smartwatches and wristbands (Mendelson et al, 2006). The WPPG is a non-invasive technology to capture the cardiac rhythm and hence could be used for continuous HR monitoring. The WPPG technology is an alternative to electrocardiogram (ECG) for continuous real-time HR monitoring (Mendelson et al, 2006)-(Challoner, 1979). As reported in (Spierer et al, 2015), WPPG is significantly affected by the body movements during various activities of daily life. In general, the motion artifacts corrupt the signal components of heart rate or PPG signal. Therefore, HR estimation from wearable PPG signal is a challenging problem faced by the researchers in academia and industry.
In this article, we demonstrate our approach of using harmonic sum (HSUM) models in reducing the impact of motion artifacts and in extracting HR accurately from a WPPG signal. We outline the basic principle of a WPPG and related works in Section 2. The motivation and proposed method are described in Section 3, followed by a discussion on evaluation results in Section 4. Our results demonstrate that the HSUM models are suitable for estimating heart rate (HR) from PPG signals that are severely affected with motion artifacts.
2 Related Works
2.1 Wearable PPG System
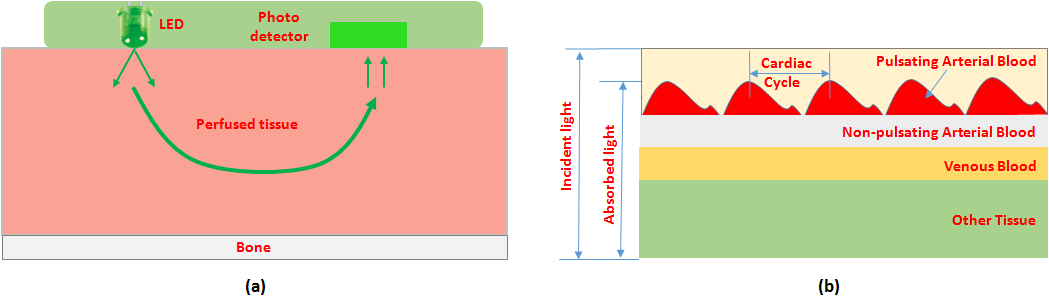
A wearable PPG system can be either of transmittance-type or reflectance-type. It consists of a light source and a detector packed with supporting hardware into a wristband or earring. The transmittance-type detects the light transmitted through the tissues by a photodiode kept opposite to the light source. The reflectance-type detects the intensity of reflected light using a photodiode kept on the same side as the light source. It works on the change in light intensity upon reflection from the tissue or blood vessels (Tamura et al, 2014). Using PPG sensors on fingertips facilitates a good quality PPG signal with transmittance-type PPG, though it interferes with various activities of daily life. The reflectance-type wristband PPG is often preferred, as it provides least hindrance during different activities and can be incorporated in a smartwatch. Red, infrared or green light-emitting diodes are common light sources in WPPG systems. Figure 2 shows the principle of reflectance-type PPG. The combination of a light source and a light detector is kept together close to the skin surface. The light-emitting diode (source) illuminates the skin that transmits the light. Subsequent tissues partly absorb and partly transmit the light passed through the skin surface. Finally, transmitted light is reflected by the subcutaneous tissue. The photodiode (sink) is activated by reflected light generating a voltage signal. The voltage signal produced by the photodiode is acquired and filtered by a hardware circuit. The voltage thus acquired is the PPG signal. It is quantitatively related to changes in blood volume in the microvascular tissues. Since it is related to the cardiac rhythm, it can be used for estimation of heart rate (HR). Modern smartwatches are equipped with a PPG sensor and various other geometric sensors such as an accelerometer, a gyroscope, and a magnetometer. An accelerometer sensor is commonly found in such smart wristband devices to record the acceleration signal that helps monitor motion artifacts. The DC component of the frequency transformed PPG signal corresponds to light absorption from skin, tissues, bones and vascular elements (non-pulsating arterial blood and venous blood). However, the AC component results from pulsating arterial blood flow that is related to cardiac rhythm (systole and diastole). The heart rate can be extracted from the AC component of PPG signal as it is related to the cardiac cycle (Tamura et al, 2014).
2.2 Motion-Artifacts and Distortions in a PPG Signal
Figure 1 shows the typical scenario for application of commercial wearable PPG sensors. A PPG signal is corrupted by the influence of external factors such as ambient light, ambient temperature and pressure in addition to movements caused by the day to day physical activities. Motion-artifacts (MAs) and pressure disturbances are the most significant distortions in a PPG system that lead to inaccurate measurement of the physiological parameters (Dresher, 2006). Pressure disturbances arise from the contact between PPG sensor and skin/body area where PPG sensor is deployed (Dresher, 2006). The arterial geometry of measurement site is changed due to pressure applied to the skin by the sensor cabinet. The pressure applied to the skin due to the placement of PPG sensor lead to undesirable changes in AC component of the reflected PPG signal (Dresher, 2006). Accurate estimation of heart rate from PPG signal corrupted by motion-artifacts has been a challenging task using time-domain as well as frequency-domain algorithms (Zhang et al, 2015b). The impact of various environmental distortions on a PPG signal quality is well studied in (Maeda et al, 2011) for infrared, red and green LEDs. The HR estimates obtained from green LED was found to be more accurate than those found with infrared and red light. The location of PPG sensor also impacts the detection quality due to the fact that the body’s sweat rate and temperature vary at various locations. The contact between the skin and the sensor, movement in wearer’s body part with the sensor, breathing, and physical activity degrade the quality of acquired PPG signal (Constant et al, 2015).
2.3 Motion-Artifact Reduction in Wearable PPG Signal
Many techniques have been proposed for reducing the motion-artifacts
in a PPG signal. Use of time-domain and frequency-domain independent component analysis (ICA) has been suggested, but it has two disadvantages. Firstly, the assumption of statistical independence between the PPG signal, and the motion-artifact does not hold in all cases. ICA required two acquisitions of motion corrupted PPG signals that provides additional burden on wearable PPG devices. Consequently, it requires multiple PPG sensors that might not be suitable for small wearable devices (Zhang et al, 2015b), (Kim and Yoo, 2006). Various adaptive signal processing techniques have been developed that use a reference signal to reduce the motion-artifacts. These techniques are not useful for everyday activities due to difficulty in estimating the appropriate reference signal for such cases (Zhang et al, 2015b).
Typically, the wristband systems such as smartwatches and fitness bands have an accelerometer that simultaneously records the acceleration signal (Inc., 2016). Other techniques being used for the motion-artifact and distortion reduction in PPG signal include the spectrum subtraction (subtracts the spectrum of the acceleration signal from the spectrum of the PPG signal) (Fukushima et al, 2012), adaptive filtering (Ram et al, 2012), higher-order statistics (Krishnan et al, 2008), wavelet transforms (Foo, 2006), empirical mode decomposition (Zhang et al, 2015a), time-frequency method described in (Yan et al, 2005), and the Kalman filtering (Lee et al, 2010). These methods are experimentally found to be effective only for small movements such as slow walking (Zhang et al, 2015b). Authors in (Zhang et al, 2015b) suggested a generic and flexible framework, TROIKA, that is signal decomposiTion for denoising, sparse signal RecOnstructIon for high-resolution spectrum estimation, and spectral peaK trAcking with verification. TROIKA was validated for HR estimation using wrist-type PPG signals while wearer runs at various speeds on a treadmill. Author proposed JOSS, that is, JOint Sparse Spectrum reconstruction for accurate HR estimation using wrist-type PPG signal (Zhang, 2015). It jointly estimated the spectra of the PPG signal and the acceleration signals. It is based on the multiple measurement vector (MMV) model for sparse signal recovery. A common sparsity constraint on the spectral coefficients helps in identification and removal of the spectral peaks corresponding to the motion-artifacts in the PPG spectrum. JOSS uses MMV model for sparse reconstruction, unlike TROIKA based on the single measurement vector (SMV) model (Zhang et al, 2015b). The JOSS (Zhang, 2015) exploits the common structures present in the spectrum of PPG signal and the spectrum of the acceleration signal and had shown better performance than the TROIKA algorithm (Zhang et al, 2015b). A method for HR estimation based on Wiener Filtering and the Phase Vocoder (WFPV) was proposed in (Temko, 2015). Authors evaluated WFPV and concluded that it performed better than JOSS on average. The WFPV algorithm uses the accelerometer signal to estimate the motion-artifacts and later use a Wiener filer to attenuate the components of motion-artifacts in the corrupted PPG signal. The phase vocoder improved the resolution of estimation of dominant frequencies. Authors developed a method consisting of four stages namely, wavelet-based denoising, acceleration-based denoising, frequency-based heart rate estimation and finally a post-processing stage. This method was found to be robust to motion-artifacts that occur during sports and rehabilitation (Mullan et al, 2015). An algorithm based on time-varying spectral filtering (named SpaMA) was proposed for accurate estimation of heart rate from PPG signals corrupted with motion-artifacts. Authors tested this approach over various datasets that were collected during various activities of daily life using wrist-band type PPG system (Salehizadeh et al, 2015).
3 Materials and Methods
In this section, we will describe the dataset, and discuss the motivation for development of harmonic sum (HSUM) models for HR estimation. Later, we will describe the mathematical derivations of the harmonic sum (HSUM) models based algorithm for HR estimation. We proposed a harmonic sum (HSUM) model for the measured acceleration signal and a joint HSUM model for the PPG signal corrupted with motion-artifacts. First, we perform an exploratory analysis of the signals that motivated the development of proposed algorithm. We evaluated the performance of HSUM algorithm on IEEE SP cup dataset. Later, we did a comparative analysis of HSUM with four methods that were recently developed namely TROIKA (Zhang et al, 2015b), JOSS (Zhang, 2015), WFPV (Temko, 2015), and SpaMA (Salehizadeh et al, 2015).
3.1 Datasets
The scenarios used for acquisition of the IEEE SP cup data is described in (Zhang et al, 2015b). The dataset consists of 12 motion affected PPG signals obtained from individuals while running on treadmill. It had dual-channel PPG signal along with simultaneously acquired ECG signal and three-axis acceleration signals. We found that for the proposed method using just one of the PPG channels was sufficient for heart rate extraction. We used the second channel for results discussed in this paper. The data was collected using a wrist-type PPG sensor while the wearer ran on a treadmill with increasing and decreasing speed for 5 minutes. The PPG signal, the accelerometer signal, and the ECG signal were simultaneously recorded from 12 male subjects in the age range of 15-18 years. The wristband had a pulse oximeter with a green LED of wavelength 515 nm along with embedded accelerometers for acquisition of the PPG and the accelerometer signal. Wet ECG sensors were used to simultaneously collect the ECG data from the chest. The PPG, ECG and the accelerometer signals were sampled at 125 Hz. The acquired signals were sent to a nearby computer using Bluetooth. The data were collected while the subjects walked or ran on a treadmill starting from rest to high speed before coming to rest again. Starting at a speed of 1-2 km/hour (kmph) for 30 seconds, the speed was increased to 6-8 kmph for one minute followed by doubling the rate to 12-15 kmph for another one minute. For next two minutes, the same cycle is repeated, i.e., starting at speed of 6-8 kmph followed by 12-15 kmph. Finally, the subject walks at a speed of 1-2 kmph for 30 seconds before coming to rest.
The ground-truth heart rate manually computed using the ECG signal were shipped with the dataset. The ground-truth HR for each overlapping time-window was computed by counting the number of cardiac cycles (H) and the duration (D) in seconds (Zhang et al, 2015b). The heart rate in beats per minute (BPM) is given by
| (1) |
We did not use any algorithm for the estimation of heart rate (HR) from the ECG signal as it may cause estimation errors. We just used the provided ground-truth. The average absolute error in HR estimates over N time-windows is defined as
| (2) |
where and were the ground-truth and estimated HR value for the i-th time-window, respectively.
3.2 Motivations
The signal acquired using a wrist-band worn by a person running on treadmill or similar intense physical exercise is severely corrupted with motion-artifacts. Estimating the heart rate from such a PPG signal is challenging due to two facts. Firstly, the motion-artifacts are stronger than the heart-beat component in the PPG signal at several instances. Secondly, the spectrum of the heart-beat signal is close to the frequency range of the motion-artifact complicating the matter further.
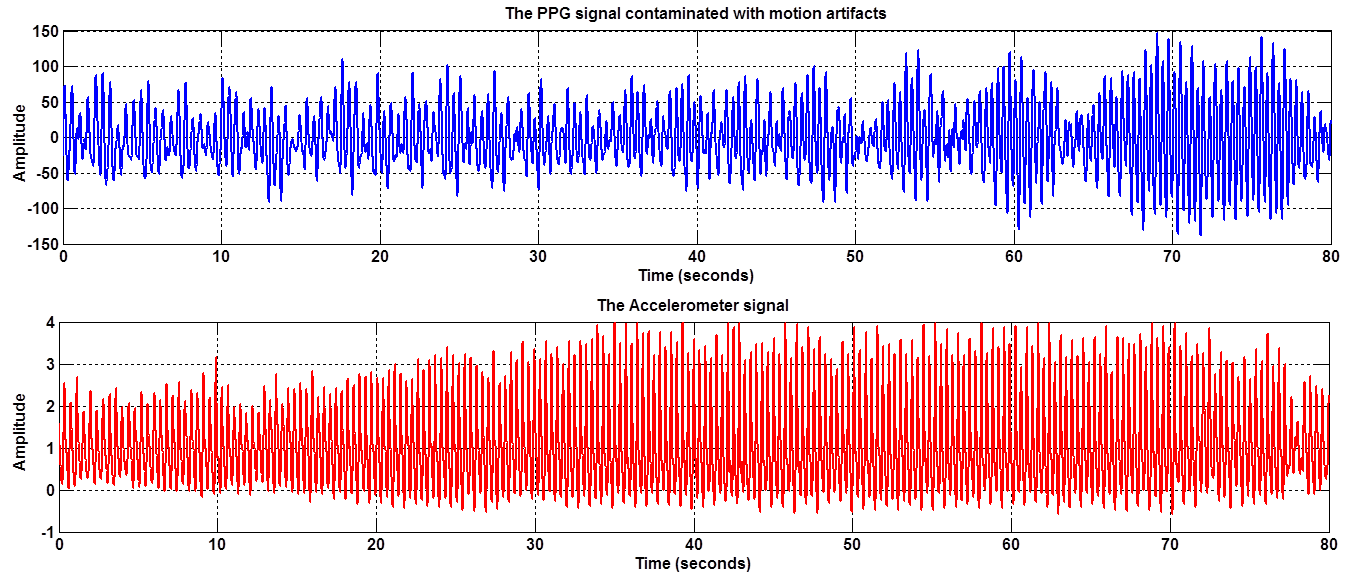
Figure 4 shows an example of a PPG signal corrupted by the motion-artifacts and a simultaneously measured accelerometer signal. The quasi-periodicity in the accelerometer signal, shown in the bottom panel of the Figure 4, is quite evident. It contained the information about the motion-artifacts. Figure 5 shows the Short-time Fourier Transform (STFT) of the accelerometer signal. The STFT (also known as a spectrogram) was obtained by 2048-point FFTs computed over 8-second time-windows with 6-second overlap between successive windows. The STFT shows a strong fundamental frequency component around 1 Hz along with several higher harmonics of moderate intensity.
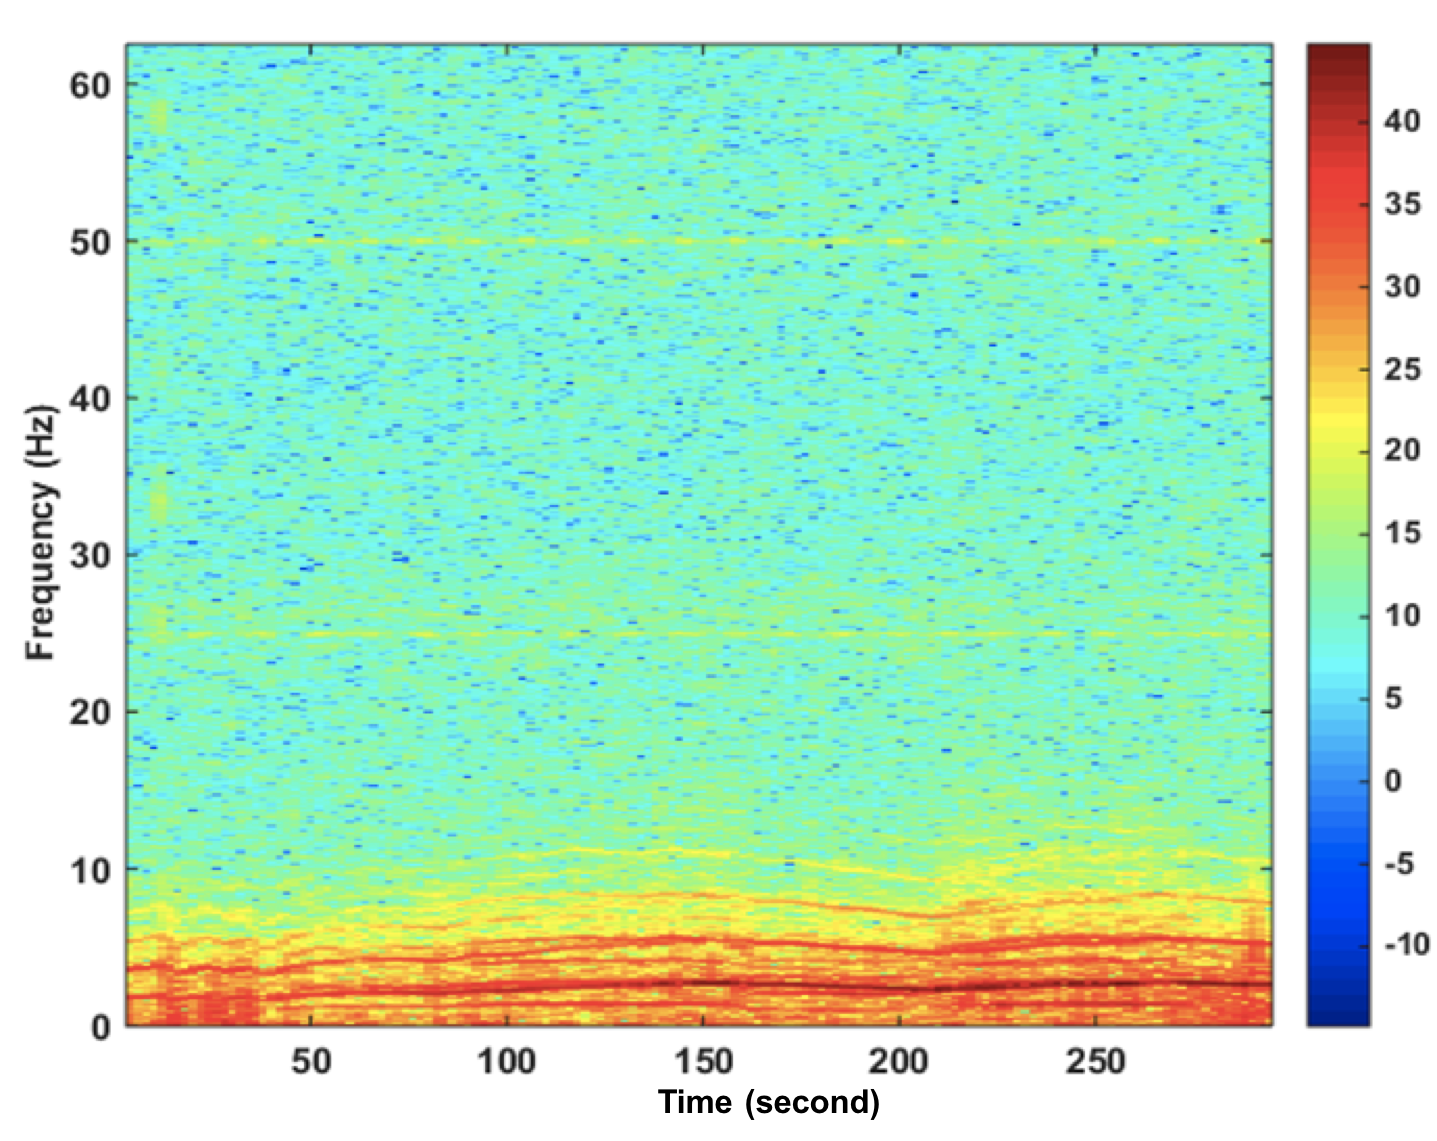
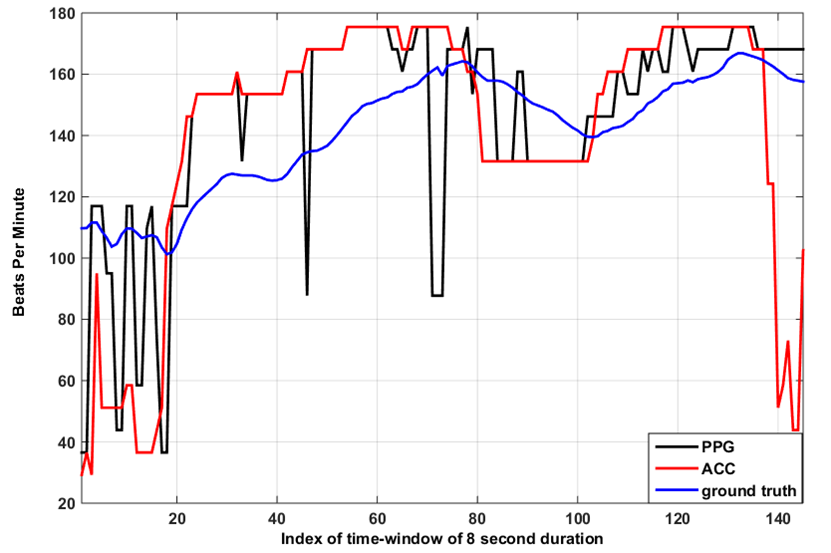
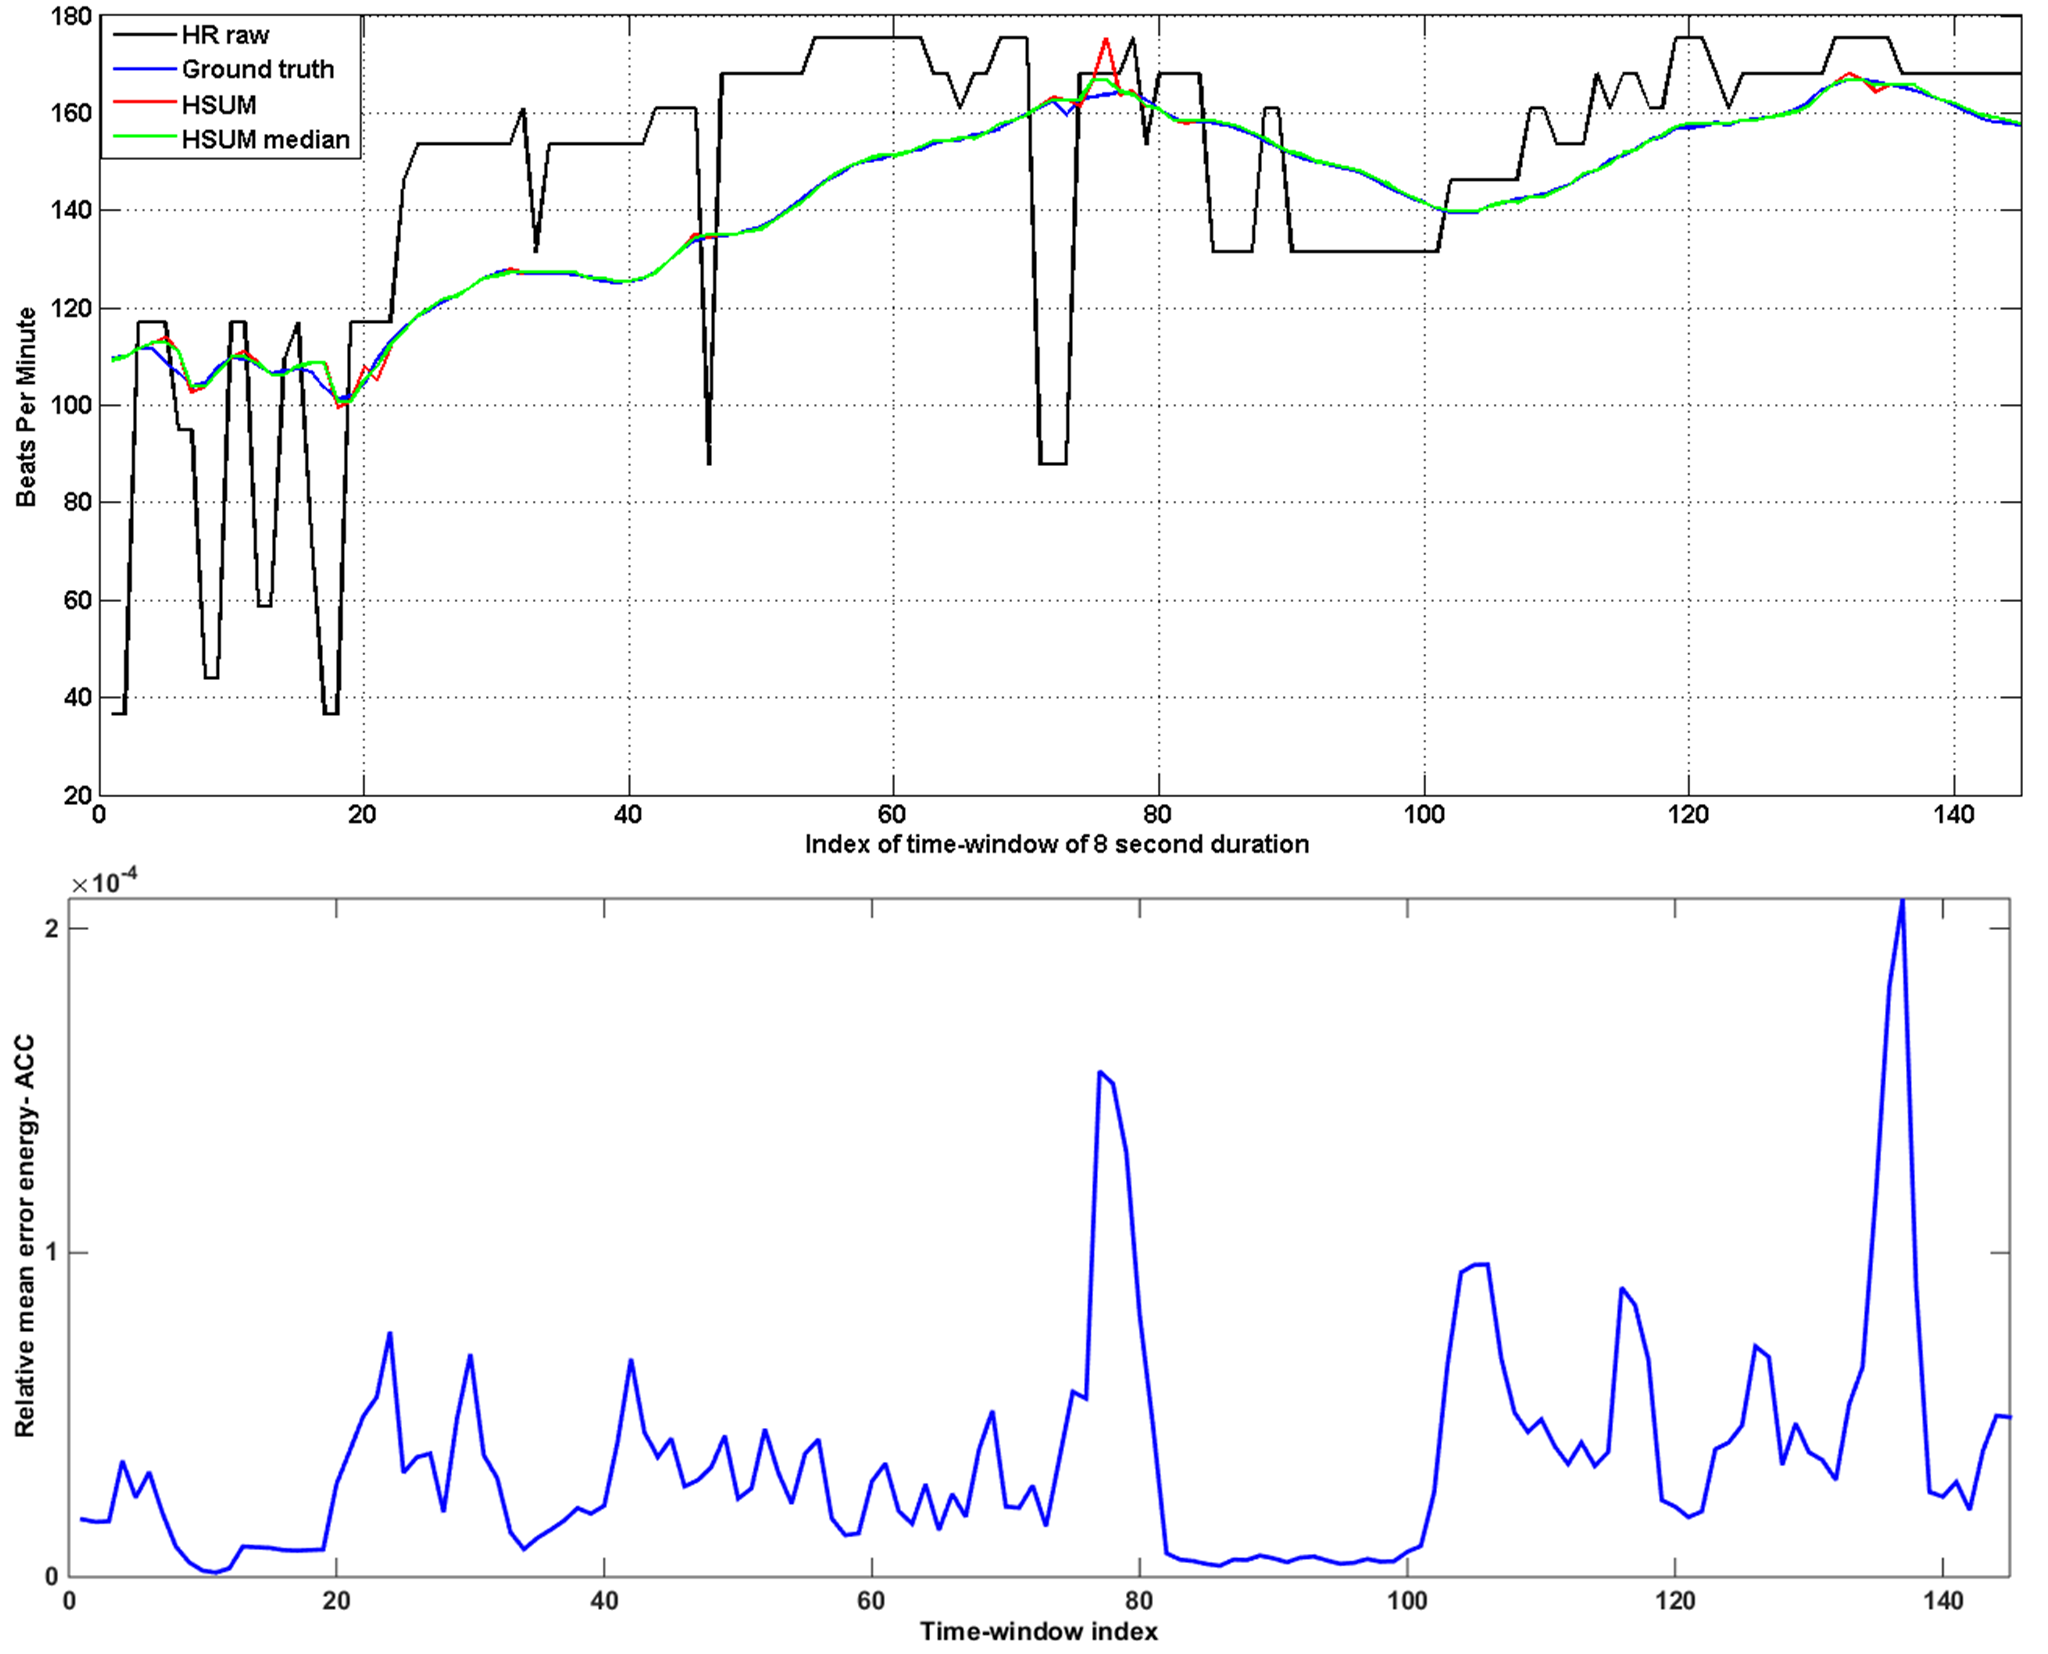
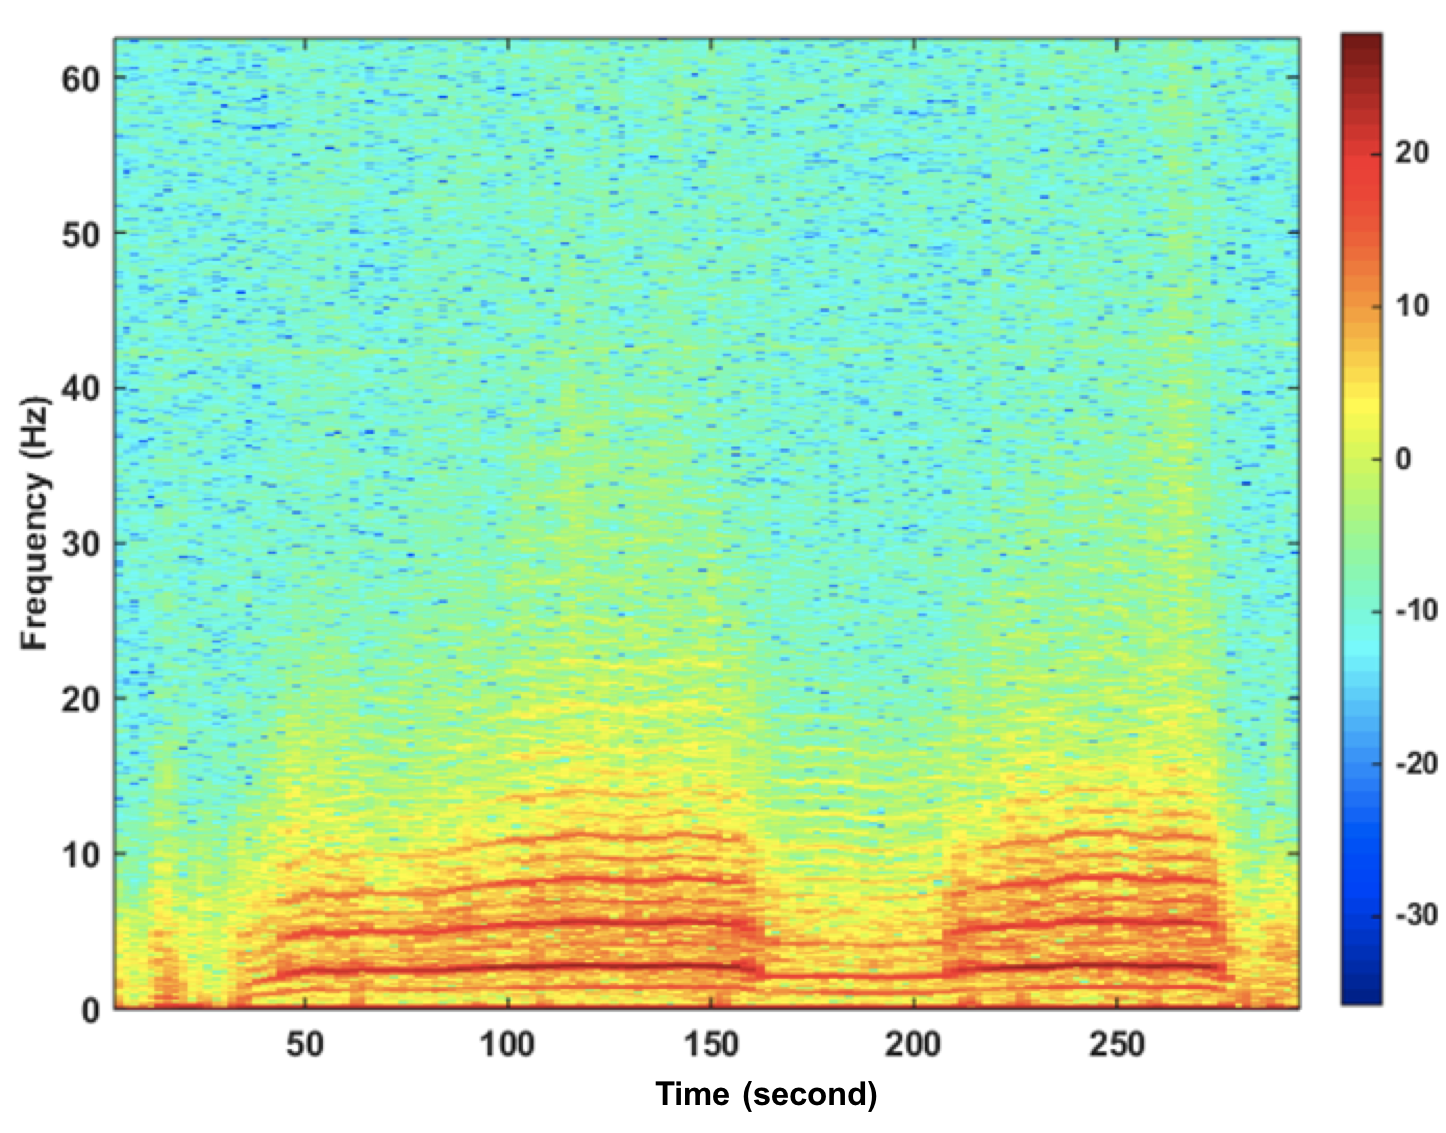
Figure 4 (top panel) shows the PPG signal. Clearly the PPG signal shows significant envelope fluctuations. A cursory examination of the waveform shows that the envelope fluctuations have a frequency of roughly 0.2 to 0.4 Hz. This is due to the fact that the harmonic components of the heart rhythm interacting with the harmonic components of the motion related signal, i.e., dominant components of the two periodic signals are quite close to each other in frequency thereby producing a ’beat signal’ envelope. The Figure 6 shows the STFT of the PPG signal computed using the same parameters as in Figure 5. The PPG signal has less number of significant harmonics when compared to the accelerometer signal. Further, in the STFT, we notice that in the low frequency region there is significant interaction between the two quasi-periodic signals. Hence unlike the STFT for the accelerometer signal, the frequency tracks are somewhat jumbled. Thus, it is not possible to resolve the individual harmonic components of the two periodic signals using standard Fourier transform unless the time window is made wider or sampling rate is increased. However, the time window can not be made much wider because then the heart rhythm signal and the motion-artifact related signal might change their rates within that wider window thereby smearing the frequency tracks. This is a classical problem in time-frequency analysis methods like the STFT. To increase resolution of the STFT, the sampling rate could also be increased.
Figure 7 shows the problems with estimating the heart rate from the locations of the peaks in the Short-Time Fourier Transform(STFT) of the PPG signal. As an exploratory step, we computed the heart rates from the STFT magnitude of the motion-artifact corrupted PPG signal. The PPG signal was divided into overlapping windows of 8-second duration with 6-second overlap between successive windows. Each of the (Hanning) windowed segment of PPG signal was processed with a 2048-point fast Fourier transform (FFT). The frequency location of the largest peak in the magnitude of the STFT was used to obtain the heart rate estimate for each window. This frequency location in Hz is multiplied by 60 to get the heart rate in beats per minute (BPM). This heart rate obtained for the PPG signal is plotted for each time window in Figure 7 (solid black line). The ground-truth heart rate obtained from the simultaneously acquired ECG signal is shown by the blue line. As can be seen, the heart rate estimates obtained from the PPG signal’s STFT-magnitude peaks’ locations wildly fluctuate and also significantly deviate from the ground-truth. Also shown for comparison purposes, are the frequency locations of the magnitude peak of the STFT (converted to BPM) of the accelerometer signal (red line). Notice that in many time windows, the estimates given by the PPG signal (black line) and the BPM values corresponding to the peak-magnitude locations of the accelerometer signal (red line) coincide. This shows that often the motion-artifacts are much stronger than the heart-beat component in the PPG signal. In other words, the motion-artifacts often dominate the PPG signal, and so they need to be some how suppressed to the extent possible from the measured PPG signal before heart rate estimation. To overcome some of the above mentioned problems, we propose a novel approach. Since both the heart rhythm signal and the motion-artifact related signal appear to be quasi periodic in nature, we propose to use a truncated Fourier series to model these signals over short time windows. Such models have been previously used, for example, in processing voiced speech sounds (vowels) (Kumaresan et al, 1992). We propose the following strategy. First model the accelerometer signal using a truncated Fourier series (HSUM), and estimate its fundamental frequency. Then, since the PPG signal is a composite of the heart rate signal and the motion-artifact related signal, we fit a sum of two different truncated Fourier series models (joint HSUM) to the PPG signal. One of the harmonic sums corresponds to the heart-beat component in PPG and the other models the motion-artifact. However, the fundamental frequency of the motion-artifact has already been determined from the accelerometer signal in the first step. Using this estimate, in the next step we estimate the fundamental frequency of the other periodic component that obtains the heart rate.
3.3 Harmonic Sum (HSUM) for the Accelerometer Signal
Let us first consider the simpler problem of modeling the accelerometer signal, since it is assumed to consist of only one quasi-periodic signal. Let us assume that we have samples of the accelerometer signal. It is modeled as a sum of a DC component and sines and cosines with frequencies that are integer multiples of the fundamental frequency Hz. The amplitudes are denoted by and . This HSUM model is denoted by .
| (3) |
The unknown amplitudes and fundamental frequency in the above equation are estimated by minimizing the squared error (SE) between original signal and the model ,
| (4) |
We can vectorize Equations 3 and 4 by writing
| (5) |
| (6) |
| (7) |
and a matrix defined as follows.
| (8) |
where stands for the element of the matrix. The Equation 3 can be rewritten in vectorized form as
| (9) |
The Equation 4 can then be rewritten in vector form as
| (10) |
Minimizing SE by choosing the unknown parameters is a bi-linear least squares problem, since both matrix and are unknown. But it can be simplified as follows. The squared error in Equation 10 can be minimized by a standard least squares method (See for example, (Kumaresan et al, 1992)) if the frequency (and hence ) is known. For a given frequency , we can form the matrix as per Equation 8. Then the amplitude vector that minimizes the squared error is given by (Kumaresan et al, 1992)
| (11) |
Substituting the above expression for back in Equation 10, we can rewrite the squared error (SE) as
| (12) |
We shall define a projection matrix , as follows
| (13) |
By noting that the matrices, and are idempotent, we can rewrite the squared error in Equation 12 as follows (Kumaresan et al, 1992).
| (14) |
Note that the squared error, SE, explicitly depends only on the unknown frequency . We can either minimize the expression in Equation 14, or equivalently, maximize by picking the best . Minimization of SE can be achieved by searching over a grid covering the range of expected frequency values of . Since we know that the accelerometer signal has a fundamental frequency in the range of 1 to 3 Hz, we can use a grid search over this range of frequencies with a step size of, say, 0.01 Hz. By minimizing the SE (Equation 14) we estimate the fundamental frequency of the HSUM model for each overlapping window. In our processing algorithms we used overlapping windows of 8-second duration with 6-second overlap between successive windows. Equation 11 can then be used to compute the amplitudes of all harmonics for each window. The optimum frequency estimate computed here is used for estimating the parameters of a joint HSUM model for the PPG signal as described in the next section.
3.4 Joint Harmonic Sum (HSUM) model for the PPG Signal
The PPG signal acquired during daily activities is composed of the heart-beat signal and dominant motion-artifacts induced by the physical movements of the user. Unfortunately, we do not know how exactly the physical movements of the subject affect the PPG signal. Although in the previous subsection we obtained a model fit to the accelerometer data and estimated the fundamental frequency and the amplitudes we are uncertain as to how the individual harmonic’s amplitudes affect the PPG data. But we may hypothesize that the artifacts induced by physical movements in the PPG signal have the same fundamental frequency as that of the accelerometer signal. If this were true, then we can use the fundamental frequency estimate obtained in the previous subsection (but not the amplitudes ) to help mitigate the effects of the motion-artifacts on the PPG signal. Our experimental results below seem to validate this hypothesis. The harmonic sum (HSUM) model for the PPG signal consists of a sum of two truncated harmonic series with different fundamental frequencies, for the motion-artifact component, and for the heart-beat component. The value for that gives minimum squared error (SE) for accelerometer signal fit is taken as the optimum fundamental frequency of the motion-artifact (and renamed as for ease of use). The signal model for the PPG signal is then given by the Equation,
| (15) |
The model represented by the Equation 15 can be vectorized as in the previous subsection as follows.
| (16) |
where the weight matrix, , and the amplitude vector of the heart-beat component of the PPG signal, are defined as follows.
| (17) |
and
| (18) |
respectively. Here, stands for the element of the matrix. The known fundamental frequency is used to synthesize the optimum weight matrix, , for the acceleration signal using Equation 8 (i.e., substituting in place of ). The amplitudes of motion-artifact component, are specified in vector form as follows.
| (19) |
The combined amplitude vector of both motion-artifact component and heart-beat component of the PPG signal is given by
| (20) |
Similarly, by concatenating the weight matrices corresponding to heart-beat component, and the motion-artifact related signal , we get the combined weight matrix, , as
| (21) |
Now, analogous to Equation 10, we can write the squared error for the PPG signal as follows.
| (22) |
where stands for the observed PPG signal vector. Following the same steps as in the case of accelerometer modeling, the combined amplitude vector that minimizes for a given is given by
| (23) |
The projection matrix for joint HSUM model for PPG signal is given by
| (24) |
The corresponding squared error, , in vector form is written as
| (25) |
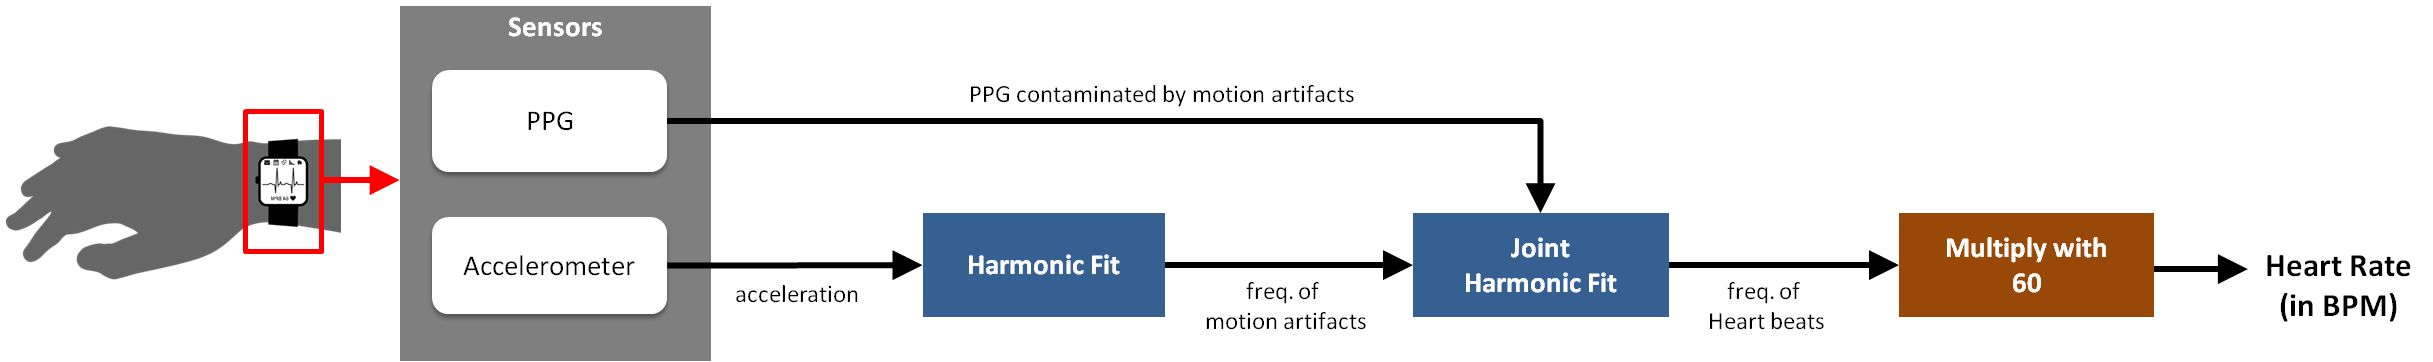
The frequency, , that gives the minimum is the heart rate in Hz. We multiply it by 60 to get the heart rate in beats per minute (BPM) as indicated in Figure 3. For finding the best (called ), we used a grid search in the range of 0.5 to 3 Hz (in steps of 0.01 Hz). For each frequency in the grid, we compute corresponding weight matrix, with a different order . is of course fixed. Once is determined, then all the optimal amplitudes can be estimated using the expression in Equation 23. Using the joint HSUM model, we can now suppress the motion-artifacts present in the PPG signal leaving behind the heart-beat component of the PPG signal. We can reconstruct the heart-beat related signal component using the expression,
| (26) |
where and are the optimum amplitude estimates obtained from Equation 23. Similarly, we can reconstruct the motion-artifact component of the PPG signal using the following expression,
| (27) |
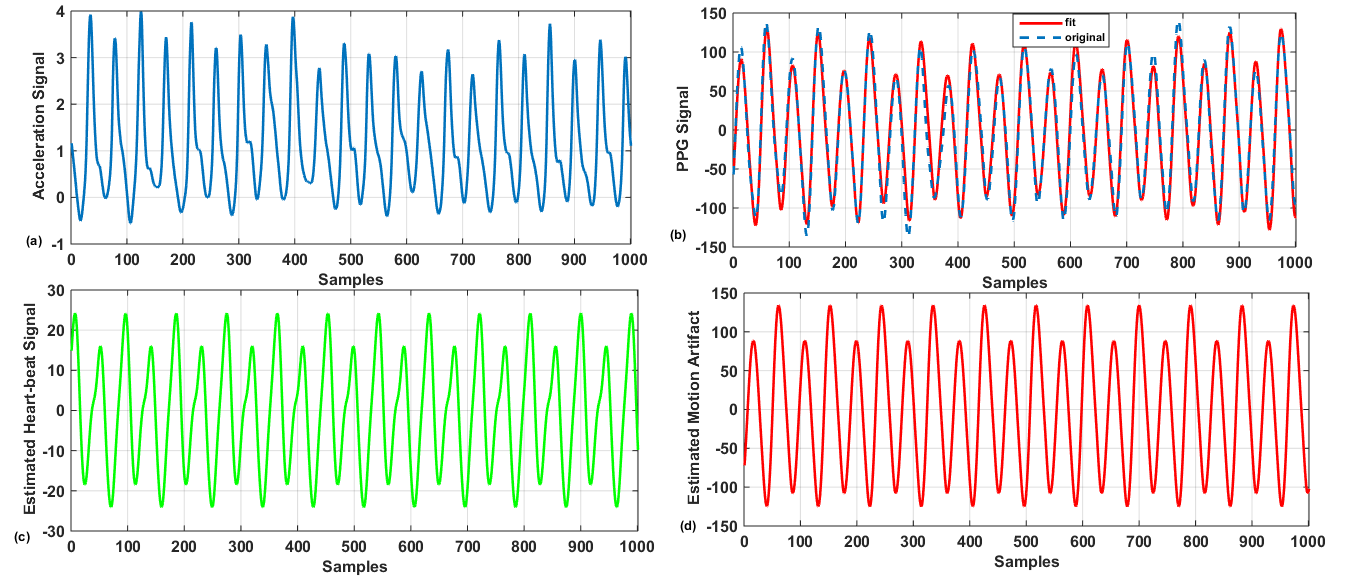
where and are the optimum amplitude estimates obtained from Equation 23. Figure 9 shows the application of HSUM to a 8-second time-window of the PPG signal and the accelerometer signal. The figure 9 (a) shows the time-domain accelerometer signal for 8-second duration (1000 samples at sampling rate of 125 Hz). The quasi-periodic structure in the time-domain acceleration signal is evident from this figure. The Figure 9 (b) shows the PPG signal and its joint HSUM model fit for the same time-window. We can see that the joint HSUM model closely follows the PPG signal. Finally, Figure 9(c) and 9(d) shows the heart beat component of the PPG signal computed using Equation 26, and the motion-artifact component of the PPG signal obtained using Equation 27. We can see that the amplitude of the heart-beat component of the PPG signal is significantly lower than amplitude of the motion-artifact component. The beauty of the harmonic sum (HSUM) model lies in the fact that it fit the frequency of both components, the heart-beat and motion-artifact, using the joint HSUM model. We can summarize the proposed algorithm as follows. We first process the accelerometer data over a short time window using the HSUM model in Equation 3. We minimize the squared error in Equation 4 by finding the optimum fundamental frequency valid over that time window. Then we process the PPG data over the same time window using the joint HSUM model in Equation 15. We minimize the squared error in Equation 25 by finding the optimum fundamental frequency while making use of the value obtained in the first step. The is finally converted to a heart rate estimate valid over that time window. We then repeat this process for each overlapping time-window. We now describe the results of applying this algorithm on IEEE SP cup data.
4 Results and Discussions
This section describes the experiments conducted to validate the efficacy of the proposed HSUM model for estimation of HR from the PPG signal corrupted with motion-artifacts.
4.1 Results
| S1 | S2 | S3 | S4 | S5 | S6 | S7 | S8 | S9 | S10 | S11 | S12 | |
| HSUM | ||||||||||||
| median | 0.614 | 0.762 | 0.649 | 0.592 | 0.534 | 0.522 | 0.592 | 0.512 | 0.412 | 0.583 | 1.484 | 1.576 |
| SpaMA | ||||||||||||
| (Salehizadeh et al, 2015) | 1.23 | 1.59 | 0.57 | 0.44 | 0.47 | 0.61 | 0.54 | 0.40 | 0.40 | 2.63 | 0.64 | 1.20 |
| WFPV | ||||||||||||
| (Temko, 2015) | 1.23 | 1.26 | 0.72 | 0.98 | 0.75 | 0.91 | 0.67 | 0.91 | 0.54 | 2.61 | 0.94 | 0.98 |
| JOSS | ||||||||||||
| (Zhang, 2015) | 1.33 | 1.75 | 1.47 | 1.48 | 0.69 | 1.32 | 0.71 | 0.56 | 0.49 | 3.81 | 0.78 | 1.04 |
| TROIKA | ||||||||||||
| (Zhang et al, 2015b) | 2.87 | 2.75 | 1.91 | 2.25 | 1.69 | 3.16 | 1.72 | 1.83 | 1.58 | 4.00 | 1.96 | 3.33 |
| HSUM | 0.756 | 0.917 | 0.948 | 1.185 | 0.697 | 0.609 | 0.873 | 0.594 | 0.525 | 0.754 | 1.495 | 2.469 |
| Short-time | ||||||||||||
| Spectrum | ||||||||||||
| Median | 49.158 | 42.563 | 41.419 | 28.521 | 10.559 | 15.972 | 8.327 | 18.748 | 7.534 | 53.276 | 14.608 | 22.381 |
| Short-time | ||||||||||||
| Spectrum | 49.154 | 43.730 | 42.664 | 30.762 | 12.106 | 17.100 | 10.100 | 19.487 | 7.927 | 55.569 | 15.690 | 25.892 |
| S1 | S2 | S3 | S4 | S5 | S6 | S7 | S8 | S9 | S10 | S11 | S12 | |
|---|---|---|---|---|---|---|---|---|---|---|---|---|
| HSUM | ||||||||||||
| median | 0.500 | 0.966 | 0.710 | 0.636 | 0.777 | 0.979 | 0.796 | 0.470 | 0.372 | 0.401 | 1.865 | 1.522 |
| HSUM | 0.604 | 1.201 | 1.326 | 1.735 | 1.274 | 1.133 | 1.307 | 0.623 | 0.671 | 0.522 | 1.840 | 1.767 |
| Short-time | ||||||||||||
| Spectrum | ||||||||||||
| median | 45.121 | 29.640 | 32.538 | 39.154 | 15.528 | 24.145 | 7.550 | 22.518 | 2.172 | 46.245 | 16.417 | 15.378 |
| Short-time | ||||||||||||
| Spectrum | 44.469 | 30.404 | 32.654 | 41.3033 | 20.292 | 25.484 | 14.167 | 22.601 | 4.404 | 48.669 | 19.183 | 23.484 |
Figure 8 compares the heart rate estimates obtained using the HSUM model, the HSUM followed by 3-point median filtering, frequency locations of the peak of the STFT magnitude of the PPG signal with the ground-truth. The time-windows of 8-second duration with 6-second overlap between successive windows were used. It shows that the heart rate estimates obtained using the HSUM model are almost the same as the ground-truth heart rate(HR) estimates except at a few points. The mean absolute error was 0.6970 beats per minute (BPM) for the dataset, DATA05TYPE02 (from (Zhang et al, 2015b)). We used a 17-th order HSUM model () for accelerometer signal and 7-th order HSUM model () for the heart-beat component of the PPG signal. We used a 3-point median filter to refine the HR estimates obtained from the HSUM model. The 3-point median filter incorporates HR estimates from previous and next windows. Clearly, maximum refinement of HR estimates is seen at the point of highest deviation from the ground-truth 8. Average absolute error in HR estimates with HSUM model was 0.9852 BPM with standard deviation of 1.1670 BPM for the complete dataset. On using 3-point median filter, we got an average absolute error of 0.7359 BPM with standard deviation of 0.8328 BPM. On an online scheme where we the future frame (next 2 second) of PPG and acceleration signals are not available, the median filtering can be skipped. It is to be noted that HSUM is effective in accurate modeling of PPG and acceleration signals over short overlapping windows. HSUM gives accurate heart rates without median filtering. However, authors include median filtering for cases where we can have access to next 2 seconds of signals (or equivalently we are in a offline scheme where short delays are acceptable). With 2 second delay, we can refine the HR estimates by incorporating the context (that is done by median filtering). On the other hand, average absolute error in HR estimates obtained from STFT is 27.5152 BPM with standard deviation of 27.2596 BPM. Using median filter on HR estimates from short-time spectrum we get average absolute error of 26.0886 BPM with standard deviation of 24.7005 BPM. The error in HR estimates obtained from the STFT is very large because motion-artifacts have corrupted the PPG signal significantly due to considerable motion of the subject’s hand while running on the treadmill. The Figure 7 shows the HR estimates obtained from the STFT magnitude of the PPG signal as well as the accelerometer signal. Large error in HR estimates is evident from this figure.
Table 1 depicts the average absolute error (in beats per minute) in HR estimates obtained from the HSUM model, the HSUM model with 3-point median filtering compared with the HR estimates obtained from the STFT of the PPG signal, and using 3-point median filtering on HR estimates obtained from the STFT of the PPG signal. Also, the average absolute error (in BPM) using other four recently developed algorithms namely SpaMA (Salehizadeh et al, 2015), WFPV (Temko, 2015), JOSS (Zhang, 2015), and TROIKA (Zhang et al, 2015b) is also given for comparison. We can see that HSUM gives an improvement over these algorithms. On the other hand, Table 2 shows the standard deviation in error (in BPM) for HR estimates obtained from the HSUM model, HSUM model with 3-point median filtering compared with the HR estimates obtained from the STFT of the PPG signal, and using 3-point median filtering on HR estimates obtained from the STFT of the PPG signal.
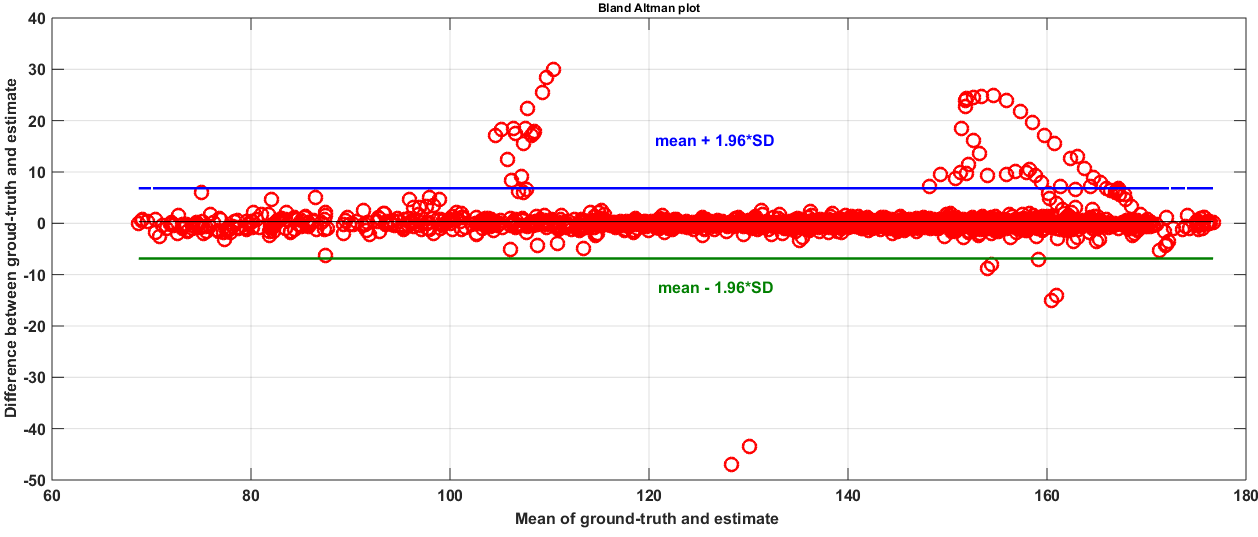
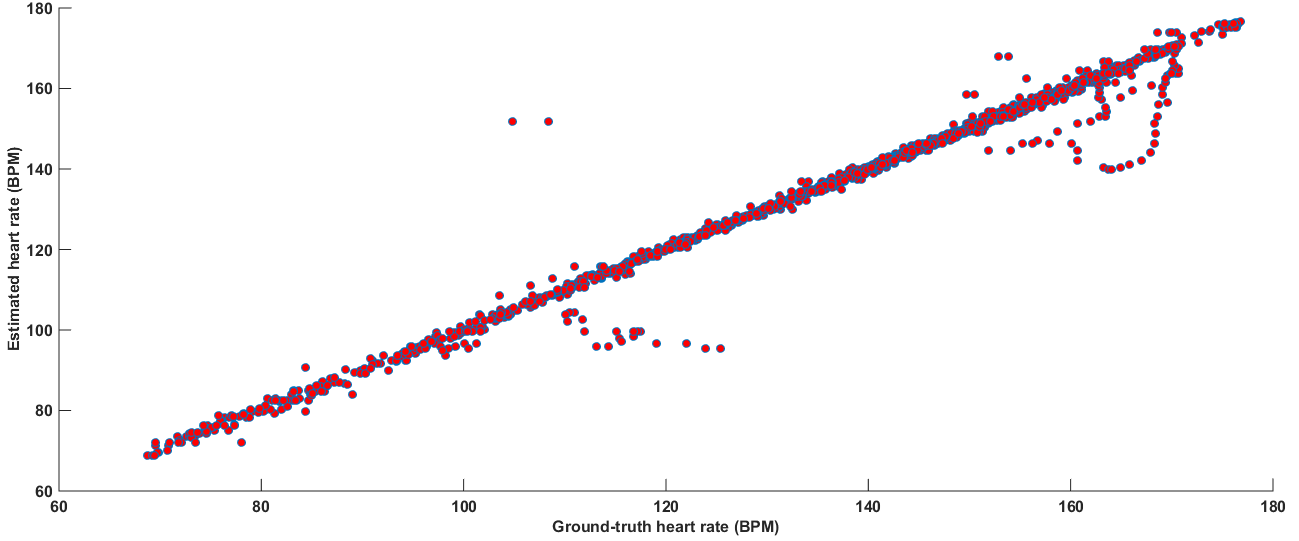
The Bland-Altman plot (Bland and Altman, 1986)for all 12 data-sets is shown in Figure 10. The Bland-Altman plot was used for validating the agreement between the estimated HR values obtained using the HSUM model with the ground-truth HR obtained from the ECG signal (Bland and Altman, 1986). The 95 percent limit of agreement (LOA) is [-6.7086, 6.7086] BPM in Bland-Altman plot (Bland and Altman, 1986). Figure 11 shows the scatter plot of HR estimates with respect to the corresponding ground-truth. The Pearson’s coefficient between the HR estimates and the ground-truth is 0.9974. The heart rate estimated using the HSUM model is in agreement with the ground-truth as depicted by the Bland-Altman plot in Figure 10. However, since the estimated HR, as well as ground-truth, are non-normal, Pearson’s correlation is not a suitable metric (Mukaka, 2012). In this paper, we computed Spearman’s rank correlation between the HR estimates and the ground-truth as it is applicable for non-normal distributions and is robust to outliers unlike Pearson’s correlation (Spearman, 1904). The Spearman’s rank correlation for all 12 data-sets comes out to be 0.9978 for the HSUM model that shows almost perfect agreement between the HR estimates and the ground-truth.
5 Conclusions
We have developed a harmonic sum-based method for estimation of heart rate (HR) using a PPG signal that had been corrupted by motion-artifacts during running on a treadmill. An auxiliary accelerometer is used to acquire information about the physical movements of the user. The quasi-periodic accelerometer signal is first modeled using a harmonic sum (HSUM) that estimates the fundamental frequency of the acceleration signal over short time-windows. The fundamental frequency of the acceleration signal is then used to model the PPG signal containing information about the heart rate and the motion-artifacts. We extract the heart rate (HR) using a joint HSUM model for the PPG signal. The method is suitable for wearable devices such as PPG wristbands used for real-time HR monitoring.
Acknowledgment
Authors would like to thank anonymous reviewers and editor for helpful comments and valuable suggestion that helped in improving the quality of this paper.
References
- Bland and Altman (1986) Bland JM, Altman D (1986) Statistical methods for assessing agreement between two methods of clinical measurement. The lancet 327(8476):307–310
- Challoner (1979) Challoner A (1979) Photoelectric plethysmography for estimating cutaneous blood flow. Non-invasive physiological measurements 1:125–151
- Constant et al (2015) Constant N, Douglas-Prawl O, Johnson S, Mankodiya K (2015) Pulseglasses: An unobtrusive, wearable hr monitor with internet-of things functionality. In: In Wearable and Implantable Body Sensor Networks (BSN), 2015 12th International Conference on, IEEE
- Dresher (2006) Dresher R (2006) Wearable forehead pulse oximetry: Minimization of motion and pressure artifacts. PhD thesis, Worcester Polytechnic Institute
- Dubey et al (2015a) Dubey H, Goldberg JC, Abtahi M, Mahler L, Mankodiya K (2015a) EchoWear: smartwatch technology for voice and speech treatments of patients with parkinson’s disease. In: Proceedings of the conference on Wireless Health, ACM, p 15
- Dubey et al (2015b) Dubey H, Goldberg JC, Makodiya K, Mahler L (2015b) A multi-smartwatch system for assessing speech characteristics of people with dysarthria in group settings. In: Proceedings e-Health Networking, Applications and Services (Healthcom), 2015 IEEE 17th International Conference on, Boston, USA
- Dubey et al (2015c) Dubey H, Yang J, Constant N, Amiri AM, Yang Q, Makodiya K (2015c) Fog Data: enhancing telehealth big data through fog computing. In: Proceedings of the ASE BigData & SocialInformatics 2015, ACM, p 14
- Dubey et al (2016a) Dubey H, Kaushik L, Sangwan A, Hansen JHL (2016a) A speaker diarization system for studying peer-led team learning groups. In: INTERSPEECH, ISCA
- Dubey et al (2016b) Dubey H, Monteiro A, Mahler L, Akbar U, Sun Y, Yang Q, Mankodiya K (2016b) FogCare: fog-assisted internet of things for smart telemedicine. Future Generation Computer Systems
- Dubey et al (2016c) Dubey H, Sangwan A, Hansen JHL (2016c) A robust diarization system for measuring dominance in peer-led team learning groups. In: IEEE Workshop on Spoken Language Technology, December, 2016, San Diego, California, USA, IEEE
- Foo (2006) Foo JYA (2006) Comparison of wavelet transformation and adaptive filtering in restoring artefact-induced time-related measurement. Biomedical signal processing and control 1(1):93–98
- Fukushima et al (2012) Fukushima H, Kawanaka H, Bhuiyan MS, Oguri K (2012) Estimating heart rate using wrist-type photoplethysmography and acceleration sensor while running. In: Engineering in Medicine and Biology Society (EMBC), 2012 Annual International Conference of the IEEE, IEEE, pp 2901–2904
- Inc. (2016) Inc V (2016) Devices that have an accelerometer, http://vandrico.com/wearables/device-categories/components/accelerometer
- Kim and Yoo (2006) Kim B, Yoo S (2006) Motion artifact reduction in photoplethysmography using independent component analysis. IEEE Transactions on Biomedical Engineering 53(3):566–568
- Krishnan et al (2008) Krishnan R, Natarajan B, Warren S (2008) Analysis and detection of motion artifact in photoplethysmographic data using higher order statistics. In: Acoustics, Speech and Signal Processing, 2008. ICASSP 2008. IEEE International Conference on, IEEE, pp 613–616
- Kumaresan et al (1992) Kumaresan R, Ramalingam C, Sadasiv A (1992) On accurately tracking the harmonic components’ parameters in voiced-speech segments and subsequent modeling by a transfer function. In: Signals, Systems and Computers, 1992. 1992 Conference Record of The Twenty-Sixth Asilomar Conference on, IEEE, pp 472–476
- Lee et al (2010) Lee B, Han J, Baek HJ, Shin JH, Park KS, Yi WJ (2010) Improved elimination of motion artifacts from a photoplethysmographic signal using a kalman smoother with simultaneous accelerometry. Physiological Measurement 31(12):1585–1603
- Maeda et al (2011) Maeda Y, Sekine M, Tamura T (2011) The advantages of wearable green reflected photoplethysmography. Journal of medical systems 35(5):829–834
- Mendelson et al (2006) Mendelson Y, Duckworth R, Comtois G (2006) A wearable reflectance pulse oximeter for remote physiological monitoring. In: Engineering in Medicine and Biology Society, 2006. EMBS’06. 28th Annual International Conference of the IEEE, IEEE, pp 912–915
- Monteiro et al (2016) Monteiro A, Dubey H, Mahler L, Yang Q, Mankodiya K (2016) FIT: a fog computing device for speech teletreatments. In: 2nd IEEE International Conference on Smart Computing (SMARTCOMP 2016), At Missouri, USA, IEEE
- Mukaka (2012) Mukaka M (2012) A guide to appropriate use of correlation coefficient in medical research. Malawi Medical Journal 24(3):69–71
- Mullan et al (2015) Mullan P, Kanzler CM, Lorch B, Schroeder L, Winkler L, Laich L, Riedel F, Richer R, Luckner C, Leutheuser H, et al (2015) Unobtrusive heart rate estimation during physical exercise using photoplethysmographic and acceleration data. In: Engineering in Medicine and Biology Society (EMBC), 2015 37th Annual International Conference of the IEEE, IEEE, pp 6114–6117
- Ram et al (2012) Ram MR, Madhav KV, Krishna EH, Komalla NR, Reddy KA (2012) A novel approach for motion artifact reduction in ppg signals based on as-lms adaptive filter. Instrumentation and Measurement, IEEE Transactions on 61(5):1445–1457
- Salehizadeh et al (2015) Salehizadeh S, Dao D, Bolkhovsky J, Cho C, Mendelson Y, Chon KH (2015) A novel time-varying spectral filtering algorithm for reconstruction of motion artifact corrupted heart rate signals during intense physical activities using a wearable photoplethysmogram sensor. Sensors 16(1):10
- Spearman (1904) Spearman C (1904) The proof and measurement of association between two things. The American journal of psychology 15(1):72–101
- Spierer et al (2015) Spierer DK, Rosen Z, Litman LL, Fujii K (2015) Validation of photoplethysmography as a method to detect heart rate during rest and exercise. Journal of Medical Engineering & Technology 39(5):264–271
- Tamura et al (2014) Tamura T, Maeda Y, Sekine M, Yoshida M (2014) Wearable photoplethysmographic sensors—past and present. Electronics 3(2):282–302
- Temko (2015) Temko A (2015) Estimation of heart rate from photoplethysmography during physical exercise using wiener filtering and the phase vocoder. In: Engineering in Medicine and Biology Society (EMBC), 2015 37th Annual International Conference of the IEEE, IEEE, pp 1500–1503
- Webster (1997) Webster JG (1997) Design of Pulse Oximeters. CRC Press
- Yan et al (2005) Yan Ys, Poon C, Zhang Yt (2005) Reduction of motion artifact in pulse oximetry by smoothed pseudo wigner-ville distribution. Journal of NeuroEngineering and Rehabilitation 2(1):3
- Zhang et al (2015a) Zhang Y, Liu B, Zhang Z (2015a) Combining ensemble empirical mode decomposition with spectrum subtraction technique for heart rate monitoring using wrist-type photoplethysmography. Biomedical Signal Processing and Control 21:119–125
- Zhang (2015) Zhang Z (2015) Photoplethysmography-based heart rate monitoring in physical activities via joint sparse spectrum reconstruction. Biomedical Engineering, IEEE Transactions on 62(8):1902–1910
- Zhang et al (2015b) Zhang Z, Pi Z, Liu B (2015b) TROIKA: A general framework for heart rate monitoring using wrist-type photoplethysmographic signals during intensive physical exercise. IEEE Transactions on Biomedical Engineering 62(2):522–531