NEOS Collaboration
Measurement of Fast Neutron Rate for NEOS Experiment
Abstract
The fast neutron rate is measured at the site of NEOS experiment, a short baseline neutrino experiment located in a tendon gallery of a commercial nuclear power plant, using a 0.78-liter liquid scintillator detector. A pulse shape discrimination technique is used to identify neutron signals. The measurements are performed during the nuclear reactor-on and off periods and found to be per day for both periods. The fast neutron rate is also measured at an overground site with a negligible overburden and is found to be times higher than that at the NEOS experiment site.
pacs:
68.37.Ef, 82.20.-w, 68.43.-hI INTRODUCTION
Short baseline reactor neutrino experiments such as NEOS (Neutrino Experiment Oscillation Short baseline) experiment are designed to search for the possible existence of sterile neutrinos Bowden:2016ntq . One of the motivations for these experiments is so called “reactor anomaly” Mention:2011rk and it is observed by other reactor based neutrino experiments An:2015nua ; RENO:2015ksa . The electron antineutrinos from the reactor can be detected by the inverse beta decay (IBD), . In a liquid scintillator (LS) doped with Gd, which is typically used for reactor based neutrino experiments, the positron produces light signal immediately giving the prompt signal and the neutron gets thermalized and then captured by either H or Gd. Subsequently, a delayed signal, a 2.2 MeV photon signal from H captured event or MeV from Gd captured event, follows the prompt signal by on the order of tens of microseconds. The existence of the sterile neutrinos can be probed by examining the rate of IBD events.
To maximize the sensitivity to the existence of the sterile neutrinos in the reactor based neutrino experiments, the detectors need to be placed as close to the reactor as possible, on the order of tens of meters or less. However, it is often hard to find a space to install the detector at such a close range to the reactor with adequate shielding from the cosmogenic backgrounds as well as the reactor originated neutrons to a lesser extent. The fast neutrons can mimic the IBD signal; the neutron elastic scattering produces a recoiling proton that can be misidentified as a prompt signal and then captured by H or Gd to produce a delayed signal. Therefore, finding a suitable location to place the detector with enough overburden and shielding is important.
Table 1 lists the recent short baseline neutrino experiments. DANSS and NEOS experiments use commercial nuclear power plant reactors, whereas the remaining experiments use research reactors. Generally a commercial reactor based experiment is provided with a larger neutrino flux and a better shielding against neutrons due to heavy structures the reactor complex is required to have. While there is more space available for installing the detector at research reactor facilities for a better sensitivity, the research reactors have a small neutrino flux than that of the commercial reactor based experiment. Also, the research reactor facilities usually have a negligible overburden and they are primarily used as a neutron source. In fact, the NUCIFER experiment has observed a significant difference in the neutron rate between the reactor-on and off periods Boireau:2015dda . Therefore, it is important to measure the neutron rates at the possible experiment sites.
| Experiment | Reactor Thermal Power | Baseline | Location |
|---|---|---|---|
| NUCIFER Boireau:2015dda | 70 MW | m | France |
| PROSEPCT Ashenfelter:2015aaa | 85 MW | 7-10 m (near)/15-19 m (far) | US |
| STEREO Zsoldos:2016bkr | 57 MW | 9-11 m | France |
| CHANDLER Bowden:2016ntq | 60 MW | m | Belgium |
| NEOS Bowden:2016ntq | 2.8 GW | 24 m | Korea |
| DANSS Alekseev:2016llm | 3.0 GW | 11-13 m | Russia |
We present measurements of the fast neutron rate using a pulse shape discrimination (PSD) technique at the NEOS experiment site, which is located in a tendon gallery of Hanbit nuclear power plant complex, and an overground site with a negligible overburden to emulate the measurements at research reactor sites. The measurements were performed before the site selection. Based on many criteria, especially on the fast neutron rate among others, a site at Hanbit nuclear power plant was chosen over a research reactor facility. The NEOS experiment took data for an 8-month period ending in 2016.
II Neutron Detector and Pulse Shape Discrimination
The neutron detector used in this work is a small volume LS detector. The neutrons identification against dominant background is done using a pulse shape discrimination (PSD) technique. The schematic drawing of the detector is shown in Fig. 1.
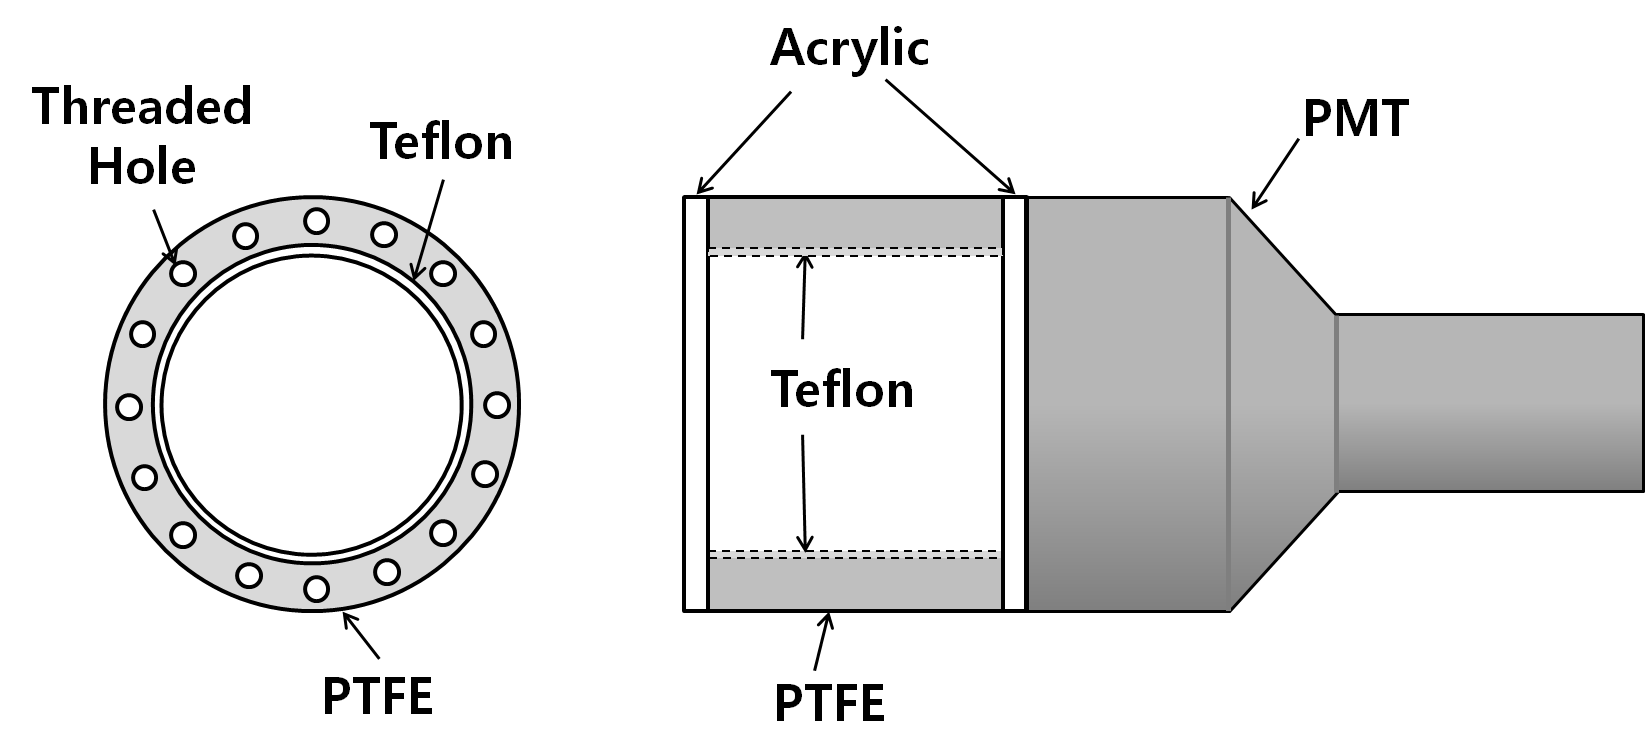
The detector uses a commercially available di-isopropylnaphtalene (DIN, C16H20) based LS, the Ultima Gold FTM (PerkinElmer Inc.), for its high light yield with a good energy resolution and a good PSD performance. No diluent is used in LS. The PSD performance of the Ultima Gold F-based LS mixture has been studied in Ref. Kim:2015pba . The LS container vessel is made of a 10 cm long PTFE cylindrical pipe with an inner diameter of 10 cm and a transparent cast acrylics plate on each end. The inner surface of the PTFE cylinder is lined with a Teflon sheet for an enhanced optical photon reflectivity. The vessel holds 0.78 liters of LS. A Hamamatsu R877-100 5-inch photomultiplier tube (PMT) is attached to one of the acrylic plates. The whole detector assembly is then wrapped by black sheet to shield from external optical photons. The signal from the PMT is pulse height triggered and digitized by a 12-bit FADC with a 500 MS/s sampling rate. A 400 ns delay is applied for the pedestal calculation and the time window for the charge integration is set to be 1 s. The PMT high voltage is set to yield pC/MeV.
The PSD technique uses the difference in the shape of the signal pulse due to the different fluorescence characteristics of LS to different types of particles. The organic scintillators produce prompt and delayed fluorescence which decay times are on the order of nanoseconds for the prompt and hundreds of nanoseconds for the delayed. The majority of light is produced by the prompt decay but the amount of the delayed decay varies depending on the type of particles causing the excitation. The neutron produced protons have a short range and generate high concentration of triplet states that decay by delayed fluorescence, whereas electrons scattered by ’s have a longer range than protons and more likely to produce singlet states which decay by prompt fluorescence. Here the amount of delayed fluorescence is used to distinguish between the photons and neutrons.
The parameters used in the PSD method used here is illustrated in Fig. 2.
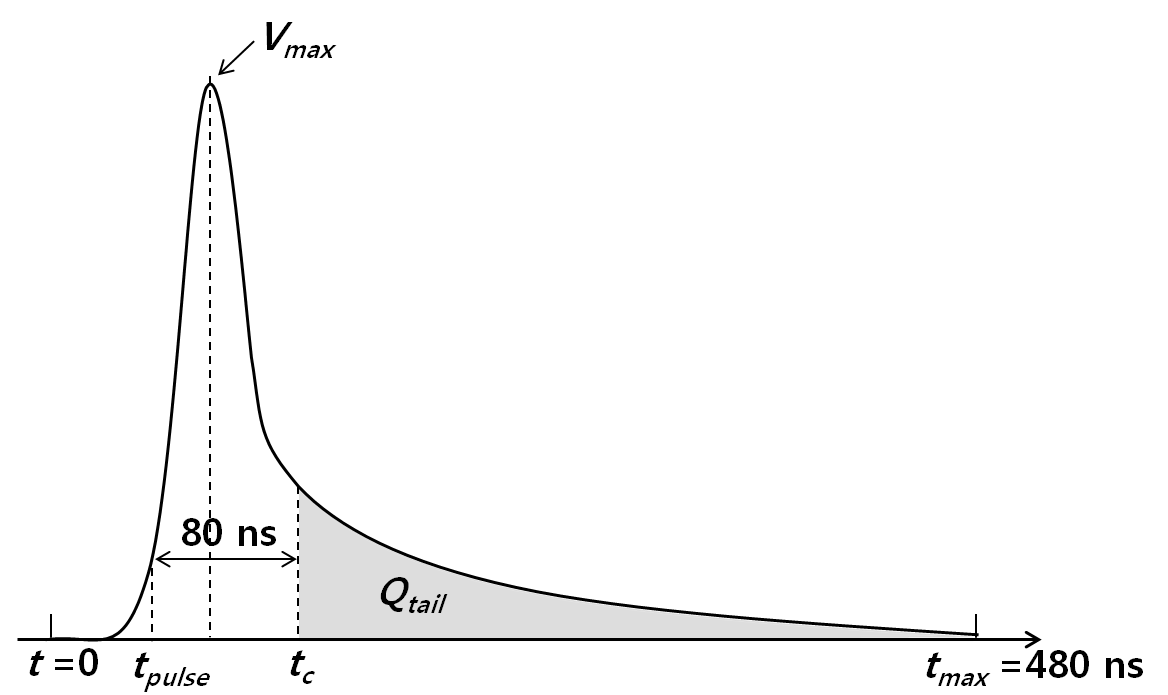
The tail charge is defined as
| (1) |
where is the height of the signal in voltage at time , is the voltage-to-current conversion constant, is the signal gate duration time (480 ns), and is the time defining the start of the tail section of the pulse, which is optimized for the neutron- separation power. From the source calibrations described below, is determined to be 80 ns after the pulse threshold time, , that is defined by
| (2) |
where and are parameters to be determined by the pulse shape of each signal. The rising part of the pulse is fit with
| (3) |
where is the maximum voltage in a pulse and is the time where the maximum pulse height occurs. The total charge is obtained by integrating the pulse over the time range of ns. The ratio of the charge in the tail to the total, , is used as the PSD discriminant parameter.
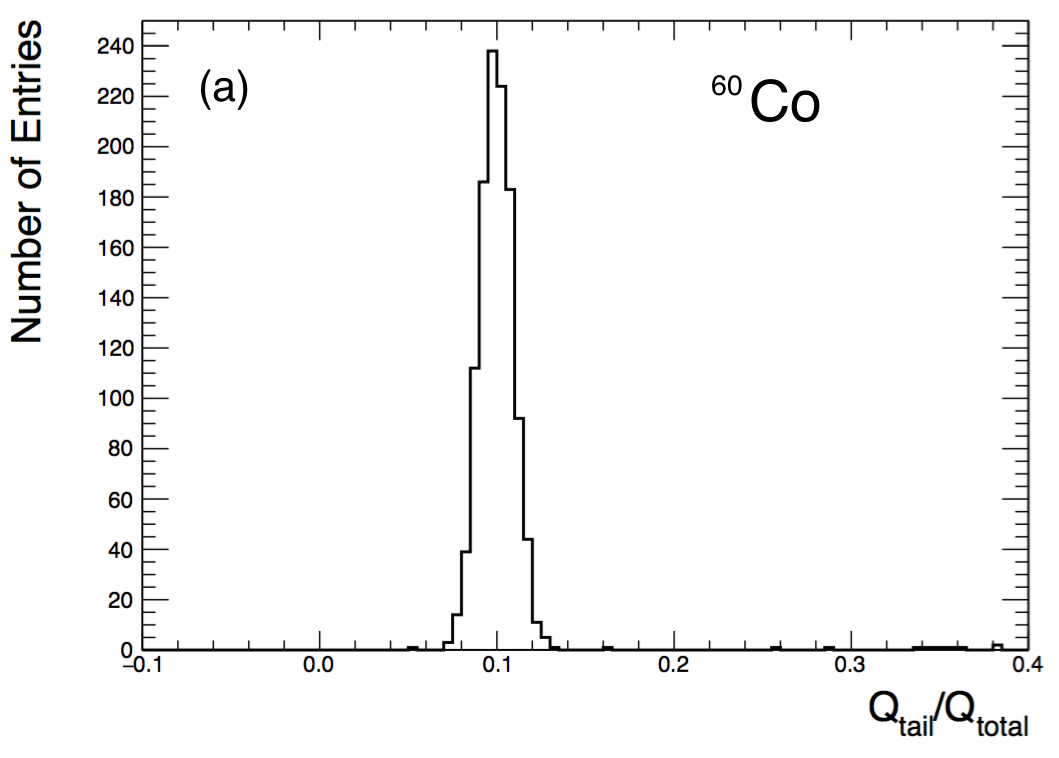
To test the performance of the detector, 60Co and 252Cf radioactive sources are used. The 60Co source emits two ’s with 1.17 MeV and 1.33 MeV. The 252Cf source emits an average of 3.7 neutrons per spontaneous fission with an energy range of MeV and the mean energy of MeV. Figure 3 shows the distributions of data taken with 60Co and 252Cf sources. It shows a single peak at for 60Co and two peaks at and for 252Cf indicating ’s and neutrons from the 252Cf source. The figure of merit for the power of separation is defined as
| (4) |
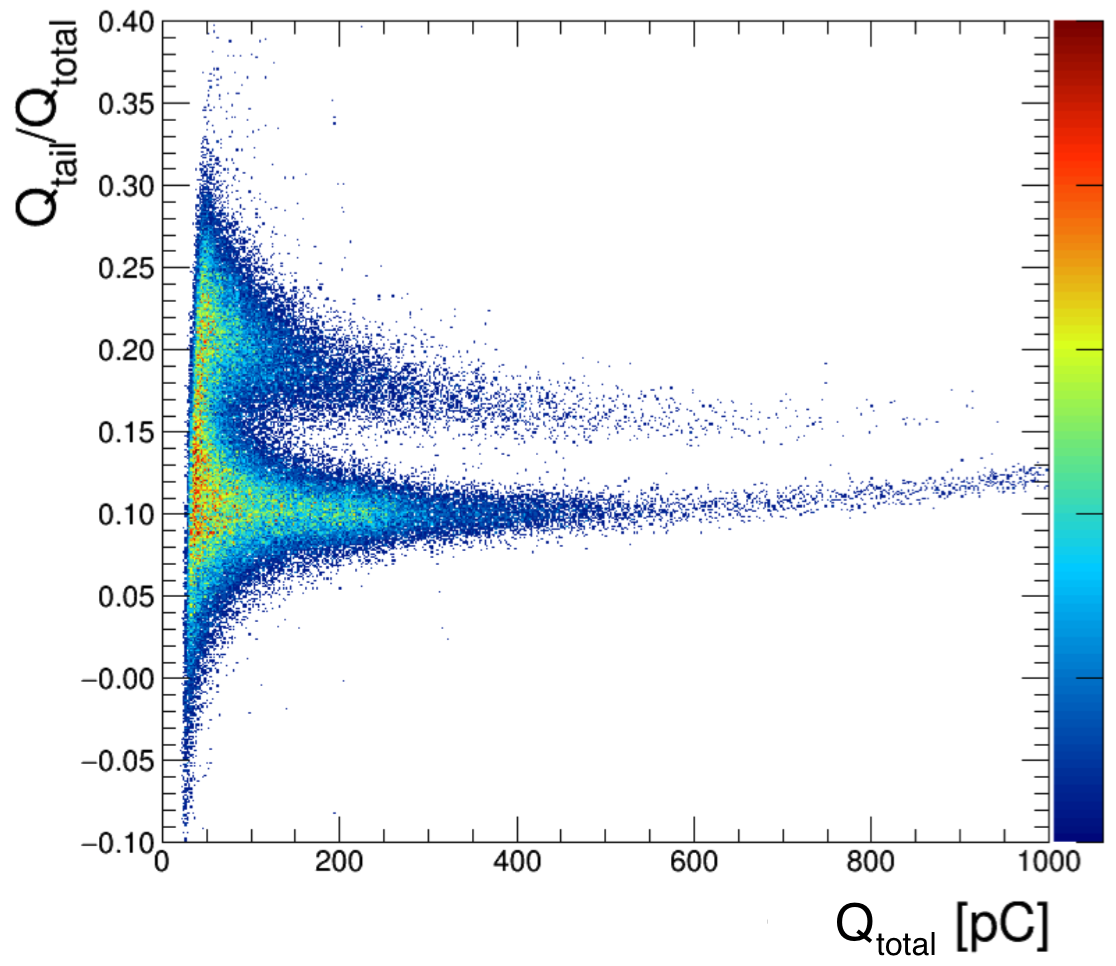
where and are the mean values and and are the widths of the two Gaussian functions fit to the distribution. The parameter is obtained from maximizing . Figure 4 the scatter plot of vs . A clear separation is seen over pC.
III Neutron Rate Measurements
The neutron rates are measured at two sites; the tendon gallery of the Hanbit nuclear power plant reactor unit 5 complex in Yeonggwang where the NEOS detector is placed and a site known as the KT1 laboratory in Daejeon, both in Korea. The tendon gallery of the reactor complex is located 10 m below the surface and has an overburden of about 20 m water equivalent. The KT1 laboratory has a negligible amount of overburden as is the case for many research reactor facilities.
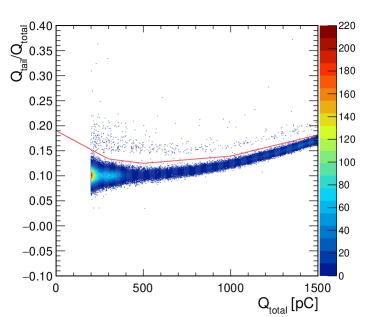
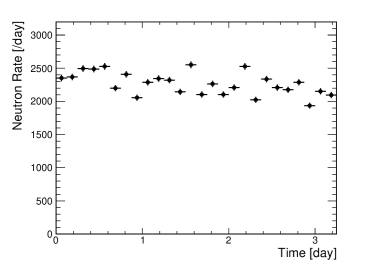
The data is taken with the detector for three days at the KT1 laboratory with a 5 cm thick lead shielding to reduce the external ’s. Figure 5 shows the scatter plot of vs for a set of data taken for about two hours at KT1 laboratory. A separation between neutrons and ’s can be seen along . The red line shown in the plot separates the neutrons from ’s, which is determined for each data set. The events in pC are counted. The measured neutron rate is about per day as shown in Fig. 6.
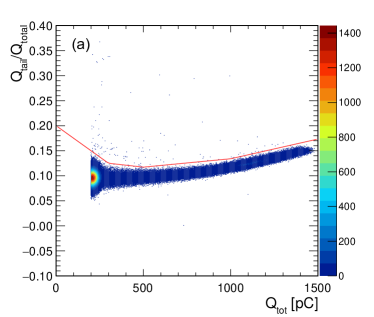
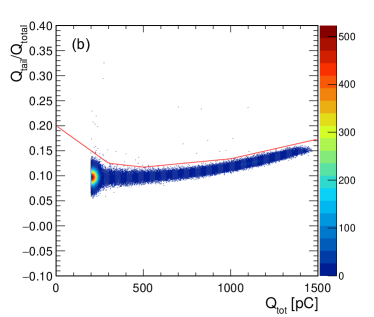
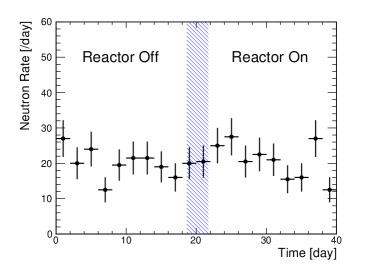
The measurements is made at the tendon gallery of Hanbit nuclear power plant complex for a period of about 40 days, which includes periods of reactor-off and on as well as ramping up. Figure 7 shows the scatter plots of vs during the reactor-on and off periods. The fast neutron rates are measured to be and per day for the reactor-off and on periods, respectively. No significant difference is observed between reactor-on and off periods indicating that there is enough shielding against neutrons originating from the reactor at the tendon gallery. Figure 8 shows the fast neutron rates during the reactor-on, off, and ramping up periods. The results are summarized in Table 2. The variations in the neutron selection cut in is accounted for as a systematic uncertainty.
| Live Time [days] | Neutron Event Rate [/day] | |
|---|---|---|
| KT1 Laboratory | ||
| Tendon Gallery (off) | ||
| Tendon Gallery (on) |
IV Conclusion
The fast neutron rate is measured with a small LS detector using the PSD technique. The fast neutron rate at the tendon gallery of Hanbit nuclear power plant where the NEOS experiment is performed is measured to be of that of the overground facility with a negligible overburden. It is also found that the reactor operation does not affect the fast neutron rate at the NEOS experiment site.
Acknowledgements.
This work is supported by IBS-R016-D1 and 2012M2B2A6029111 from National Research Foundation (NRF). We appreciate the assistance from the Korea Hydro and Nuclear Power (KHNP) company, especially acknowledge the Safety and Engineering Support Team of Hanbit-3 Nuclear Power Plant.References
- (1) N. S. Bowden, K. M. Heeger, P. Huber, C. Mariani, and R. B. Vogelaar, arXiv:1602.04759 [hep-ex].
- (2) G. Mention, M. Fechner, T. Lasserre, T. A. Mueller, D. Lhuillier, M. Cribier, and A. Letourneau, Phys. Rev. D 83, 073006 (2011).
- (3) F. P. An et al. (Daya Bay Collaboration), Phys. Rev. Lett. 116, no. 6, 061801 (2016).
- (4) J. H. Choi et al. (RENO Collaboration), Phys. Rev. Lett. 116, no. 21, 211801 (2016).
- (5) G. Boireau et al. (NUCIFER Collaboration), Phys. Rev. D 93, no. 11, 112006 (2016).
- (6) J. Ashenfelter et al. (PROSPECT Collaboration), JINST 10, no. 11, P11004 (2015).
- (7) S. Zsoldos, arXiv:1602.00568 [physics.ins-det].
- (8) I. Alekseev et al., arXiv:1606.02896 [physics.ins-det].
- (9) B. R. Kim et al., Phys. Scripta 90, no. 5, 055302 (2015).