Controlling mechanical properties of a polymeric glass
Abstract
In this work we use molecular simulations to examine methods of controlling mechanical properties of polymeric glass materials such as elastic moduli, mechanical heterogeneity as well as their glass transition temperature. We study filled and unfilled polymers and examine the effect of particle size, volume fraction and polymer-particle interactions. We identify a relationship between mobility and dynamic heterogeneity with elastic moduli and glass transition temperature.
I Introduction
A series of experiments have recently found evidence of dynamical heterogeneities Ediger (2000); Tracht et al. (1998); Sillescu (1999) in amorphous glassy systems. Additionally, recent, simulation studies have proposed the existence of mechanical heterogeneities in such materials Léonforte et al. (2005a); Papakonstantopoulos et al. (2005, 2007, 2008). Polymeric glasses have been found to exhibit domains of several nanometers whose elastic moduli can vary appreciably et al. (2004, 2002). These mechanical heterogeneities have been found to be connected to the failure of these materials upon deformation Papakonstantopoulos et al. (2007, 2008). It is obvious that it is of great importance to identify methods of controlling these mechanical heterogeneities, especially when the material is used for the creation of nanostructures.
Particulate fillers are used extensively in the polymer industry to alter material properties of polymeric material. The addition of particles can lead to the strengthening of polymers extending considerably their range of applicability. Understanding the molecular mechanisms that lead to such modifications in the properties of nanocomposites is essential for the design of materials that have a desirable behavior.
Polymer nanocomposites can exhibit an increase on the values of the mechanical properties Vollenberg and Heikens (1989); Ou et al. (1998); Berriot et al. (2002) or a decrease Ash et al. (2004); Narayanan et al. (2006), depending on the nature of nanoparticle-polymer specific interactions. Some of the parameters that affect the properties of a composite are the particle size, the volume fraction and the extent of agglomeration. Experiments suggest that as the size of the particle decreases, the changes in mechanical properties become more pronounced Ash et al. (2004); Vollenberg and Heikens (1989); Vieweg et al. (1998).
Simulations provide a valuable tool for the study of nanocomposite systems. They can offer useful insights into the spatial and structural arrangement of the particles in the polymer matrix. In this work, we use uniaxial deformations on a three-dimensional amorphous polymeric system. We show that, consistent with previous calculations, nanoparticles can be used to alter the elastic modulus and the glass transition of a material. Additionally, the mechanical heterogeneity of polymers can be controlled with addition of nanoparticles. Finally, we show that a relationship exists between mobility and “dynamic heterogeneity” with elastic moduli and glass transition.
II Methodology
II.1 Model and Simulations methodology
In our simulations, the segments of the polymer molecules interact via a pairwise, 12-6 Lennard-Jones truncated potential energy function, shifted at the cutoff ,
| (1) |
where and are the Lennard-Jones parameters for energy and length, respectively, and is the distance between two interaction sites. The bonding energy between two consecutive monomers in the same chain is given by
| (2) |
with bond constant . Nanoparticle-polymer segment interactions are described through a potential energy of the form Doxastakis et al. (2004)
where is the radius of a nanoparticle and . The polymer-particle types of interactions considered, are “strongly attractive” ( and ), are “attractive” ( and ), and “neutral” ( and ). As can be seen from the form of the potential in Eq. 3, the interaction between a particle and a monomer is taken at a distance (the radius of the filler) from the center of the particle. In that way the interactions are accounted for from the surface of the nanofiller.
The systems considered in this work consist of, on average, 450 chains of beads. Simulations are performed in the ensemble. The pressure in all simulations is kept constant at = 0.0. All quantities are reported in LJ units, reduced with respect to the monomer and . All configurations are equilibrated at a temperature = 1.2. Then the configurations are cooled down to = 0.0001 for a period of 1.2 million steps. The timestep is =0.001. At the temperature = 0.0001 we perform an NVT calculation of steps. We calculate a local mean-square displacement of each atom around its average position which is a measure of mobility.
A Monte Carlo method is used to equilibrate the systems of interest in this work. Trial particle displacements include random monomer and nanoparticle translations. Reptation moves are also attempted, implemented within a configurational-bias scheme to increase performance de Pablo et al. (1992). To further enhance sampling we implement double-bridging trial moves Banaszak and de Pablo (2003); Karayiannis et al. (2002). These moves consist of a simultaneous exchange of distinct parts of two neighboring chains, and are highly effective for configurational sampling of long chain molecules. Double bridging allows for effective equilibration of the systems considered in this work Banaszak and de Pablo (2003). It is particularly important in nanoparticle-reinforced polymers, where sampling the correct structure and arrangement of long chain molecules around nanoparticles can be particularly demanding.
II.2 Non-affine displacement field
In this section we describe the technique used to calculate the non-affine displacement field that arises when a material is deformed. The energy of a configuration created after cooling down to by NPT is first minimized. A uniaxial deformation is then applied of strain , where = , or , by rescaling all the coordinates and the corresponding box length affinely. The energy of this affinely deformed configuration is minimized again, keeping the simulation box shape and volume constant. This process yields particle or segmental displacements relative to the affinely deformed state, the so called non-affine displacement field, . A conjugate gradient minimization technique is used.
III Results and Discussion
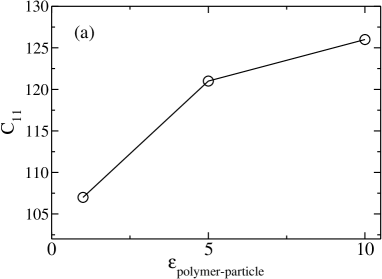
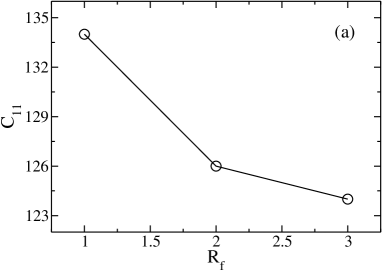
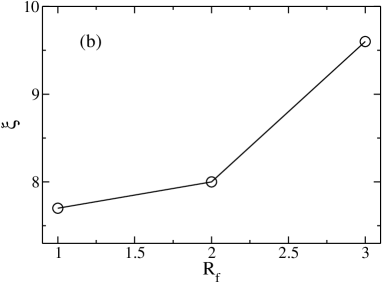
We examine the effect of the particle-polymer interactions on the elastic longitudinal modulus of the nanocomposites. As seen in Figure 1a for a system of volume fraction and , we find that increasing the attraction between polymer segments and nanoparticles results in an increase to the elastic modulus, , in agreement with literature findings Papakonstantopoulos et al. (2005, 2007). We examine how the addition of nanoparticles affects the mechanical heterogeneity of the material. A measure of the mechanical heterogeneity can be obtained by analyzing the non-affine displacements Léonforte et al. (2005b). The correlation of the non-affine field is analyzed by calculating the function
| (3) |
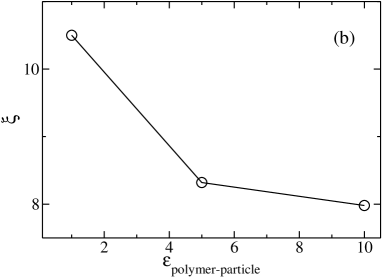
for all segments separated by a distance . The correlation length that arises from this relation is related to the fragility and mechanical stability of a material Papakonstantopoulos et al. (2007); Silbert et al. (2005). We find that the correlation length decreases by increasing the polymer-particle interaction (Figure 1b). This suggests that the nanocomposite system becomes more mechanically homogeneous and thus more mechanically stable by increasing polymer-particle interaction.
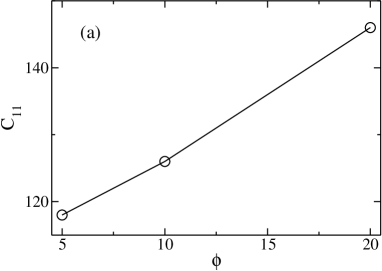
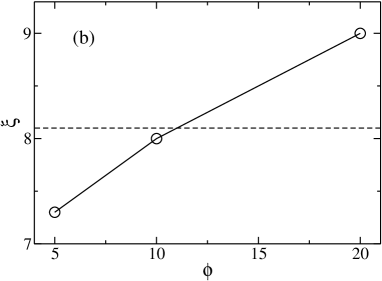
We continue our investigation with the effect of particle volume fraction on the mechanical properties. The particle size for this study was kept at and the polymer-particle interaction was chosen . We find that increasing the volume fraction of the particles in the nanocomposite results in an increase of the elastic modulus (Figure 2a). For all particle concentrations studies the elastic modulus was higher than the pure polymer. Now we focus on the mechanical heterogeneity of these systems. We find that increasing particle volume fraction, increases the mechanical heterogeneity of the glass. However, as seen from Figure 2b, for small particle volume fractions the heterogeneity of the polymeric nanocomposite glass is smaller than for the pure polymer. This indicates that a below a certain filler volume fraction, the nanocomposite polymeric glass is stronger but also less susceptible to failure in comparison to the pure polymer.
We now examine the effect of particle size on the mechanical properties. As shown in Figure 3a, for a nanocomposite system of volume fraction and polymer-particle interaction , decreasing particle size results in a material of higher elastic modulus. This alteration of the mechanical properties with particle size has been observed with experiments where, depending on the polymer-particle interaction, the modulus increases or decreases Chahal and Pierre (1969); Roberts et al. (2001); Kopesky et al. (2005); MacKay et al. (2003). What happens to the mechanical inhomogeneity of the material when the particle size changes? In Figure 3b we plot the non-affine displacement correlation length as a function of particle size. We see that decreasing particle size, the correlation length decreases suggesting that the material becomes more mechanically stable. In addition, for the highest particle size studied the correlation length was found to be higher than the pure polymer while for the smallest particle size it was significantly lower.
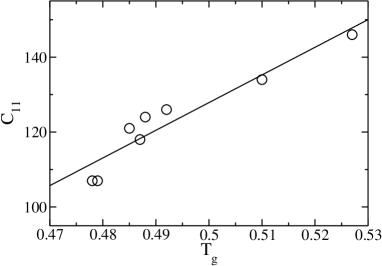
We continue with the examination of the relation of the glass transition temperature, , with the elastic modulus. We plot all the available data for all types of systems used in this paper (different volume fraction, particle size, polymer-particle) in Figure 4. We find that the higher the glass transition of the material studied, the higher its elastic modulus which should logically be expected.
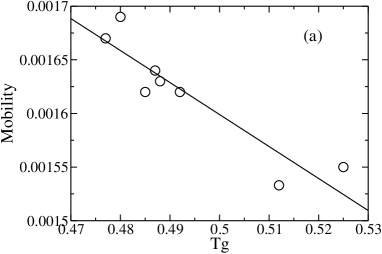
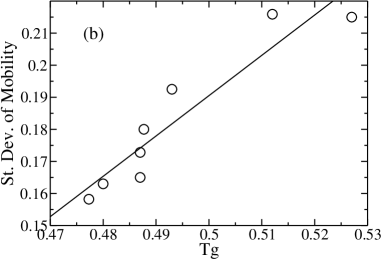
But how is the mobility and the fluctuations of mobility, which are a measure of dynamic heterogeneity, connected to and ? In Figure 5 we plot the mobility as a function of glass transition temperature. We find that materials of higher glass transition and elastic modulus exhibit a smaller mobility. Plotting the fluctuations of mobility with respect to the glass transition temperature in Figure 5 we see that the dynamic heterogeneities of a material exhibit the opposite behavior than the mobility with respect to the glass transition temperature and the elastic modulus. Materials of higher glass transition and elastic modulus exhibit a higher dynamic heterogeneity.
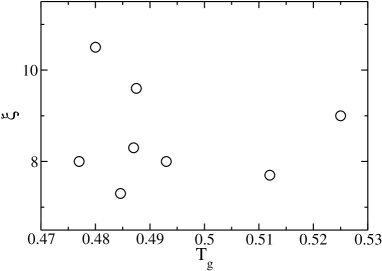
We now attempt to find a similar relation of the mechanical heterogeneities to the elastic modulus and glass transition. We plot the correlation length of the non-affine displacements with respect to the corresponding value of in Figure 6. The data appear to be scattered and no clear connection is obvious for the mechanical inhomogeneity with .
IV Conclusions
With the aid of molecular simulations we presented how the mechanical properties properties of a polymeric material can be controlled with the use of nanoparticle inclusions. We studied the effect of polymer-particle interaction, particle volume fraction and particle size on the elastic modulus and material failure. Additionally, we found a connection of glass transition temperature and elastic modulus with mobility and dynamic heterogeneities. No similar relation could be found between the mechanical heterogeneities and the elastic modulus. This work was supported by the NSF (NIRT Grand No. CTS-0506840) and the Semiconductor Research Corporation.
References
- Ediger (2000) M. Ediger, Annu. Rep. Phys. Chem. 51, 99 (2000).
- Tracht et al. (1998) U. Tracht, M. Wilhelm, A. Heuer, H. Feng, K. Schmidt-Rohr, and H. Spiess, Phys. Rev. Lett. 81, 2727 (1998).
- Sillescu (1999) H. Sillescu, Jour. of Non-Crys. Solids 243, 81 (1999).
- Léonforte et al. (2005a) F. Léonforte, R. Boissière, A. Tanguy, J. Wittmer, and J.-L. Barrat, Phys. Rev. B 72, 224206 (2005a).
- Papakonstantopoulos et al. (2005) G. Papakonstantopoulos, K. Yoshimoto, M. Doxastakis, P. Nealey, and J. de Pablo, Phys. Rev. E 72, 031801 (2005).
- Papakonstantopoulos et al. (2007) G. Papakonstantopoulos, M. Doxastakis, J.-L. Barrat, P. Nealey, and J. de Pablo, Phys. Rev. E 73, 031803 (2007).
- Papakonstantopoulos et al. (2008) G. Papakonstantopoulos, R. Riggleman, J.-L. Barrat, and J. de Pablo, Phys. Rev. E 77, 041502 (2008).
- et al. (2004) K. Y. et al., Phys. Rev. Lett. 93, 175501 (2004).
- et al. (2002) T. B. et al., J. Chem. Phys. 116, 9939 (2002).
- Vollenberg and Heikens (1989) P. Vollenberg and D. Heikens, Polymer 30, 1656 (1989).
- Ou et al. (1998) Y. Ou, F. Yang, and Z. Yu, J. Pol. Sci. Part B Pol. Phys. 36, 789 (1998).
- Berriot et al. (2002) J. Berriot, H. Montes, F. Lequeux, D. Long, and P. Sotta, Macromolecules 35, 9756 (2002).
- Ash et al. (2004) B. Ash, R. Siegel, and L. Schandler, Macromolecules 37, 1358 (2004).
- Narayanan et al. (2006) R. A. Narayanan, P. Thiyagarajan, S. Lewis, A. Bansal, L. Schadler, and L. Lurio, Phys. Rev. Lett. 97 (2006).
- Vieweg et al. (1998) S. Vieweg, R. Unger, G. Heinrich, and E. Donth, J. of Appl. Pol. Scie. 73, 495 (1998).
- Doxastakis et al. (2004) M. Doxastakis, Y.-L. Chen, O. Guzmán, and J. de Pablo, J. Chem. Phys. 120, 9335 (2004).
- de Pablo et al. (1992) J. de Pablo, M. Laso, and U. Suter, J. Chem. Phys. 96, 2395 (1992).
- Banaszak and de Pablo (2003) B. Banaszak and J. de Pablo, J. Chem. Phys. 119, 2456 (2003).
- Karayiannis et al. (2002) N. Karayiannis, V. Mavrantzas, and D. Theodorou, Phys. Rev. Lett. 88, 105503 (2002).
- Léonforte et al. (2005b) F. Léonforte, R. Boissière, A. Tanguy, J. Wittmer, and J.-L. Barrat, Phys. Rev. E 72, 224206 (2005b).
- Silbert et al. (2005) L. Silbert, A. Liu, and S. Nagel, Phys. Rev. Lett. 95, 098301 (2005).
- Chahal and Pierre (1969) R. Chahal and L. S. Pierre, Macromolecules 2, 193 (1969).
- Roberts et al. (2001) C. Roberts, T. Cosgrove, R. Schmidt, and G. Gordon, Macromolecules 34, 538 (2001).
- Kopesky et al. (2005) E. Kopesky, T. Haddad, G. McKinley, and R. Cohen, Polymer 46, 4743 (2005).
- MacKay et al. (2003) M. MacKay, T. Dao, A. Tuteja, D. Ho, B. V. Horn, H. Him, and C. Hawker, Nat. Mate. 2, 762 (2003).