Constraining the PopIII IMF with high- GRBs
Abstract
We study the possibility to detect and distinguish signatures of enrichment from PopIII stars in observations of PopII GRBs (GRBIIs) at high redshift by using numerical N-body/hydrodynamical simulations including atomic and molecular cooling, star formation and metal spreading from stellar populations with different initial mass functions (IMFs), yields and lifetimes. PopIII and PopII star formation regimes are followed simultaneously and both a top-heavy and a Salpeter-like IMF for pristine PopIII star formation are adopted. We find that the fraction of GRBIIs hosted in a medium previously enriched by PopIII stars (PopIII-dominated) is model independent. Typical abundance ratios, such as [Si/O] vs [C/O] and [Fe/C] vs [Si/C], can help to disentangle enrichment from massive and intermediate PopIII stars, while low-mass first stars are degenerate with regular PopII generations. The properties of galaxies hosting PopIII-dominated GRBIIs are not very sensitive to the particular assumption on the mass of the first stars.
keywords:
gamma-ray burst: general; stars: Population III; cosmology: early Universe – theory; abundances1 Introduction
Long Gamma Ray Bursts (GRBs) are believed to arise from the accretion of material onto black holes (BHs) formed after the death of massive stars. Some of them are so bright that they have been observed up to extremely high redshift Salvaterra et al. (2009); Tanvir et al. (2009); Cucchiara et al. (2011). In fact, different models Bromm & Loeb (2002); Salvaterra & Chincarini (2007); de Souza et al. (2011); Salvaterra et al. (2012); Ghirlanda et al. (2015); Elliott et al. (2015) consistently predict that % of the GRBs detected by the Swift satellite should lie at . Among these, some might also be GRBs from the earliest generation (PopIII) of stars Suwa & Ioka (2011); Toma et al. (2011); Maio & Barkov (2014). Therefore, high- GRBs are thought to be a viable probe of the early Universe besides quasars and galaxies (see Salvaterra, 2015, for a recent review). Indeed, they can pinpoint the primordial galaxies responsible for the reionization of the intergalactic medium Salvaterra et al. (2013), providing unique information about their gas metallicity and dust content Campisi et al. (2011), neutral hydrogen fraction Nagamine et al. (2008), local intergalactic radiation field Inoue et al. (2010) and stellar populations Ma et al. (2015). Moreover, they could add constraints to early cosmic magnetic fields Takahashi et al. (2011), dark matter nature de Souza et al. (2013b); Maio & Viel (2015) and primordial non-Gaussianities Maio et al. (2012).
The detection of a PopIII GRB (heretheafter GRBIII) will represent a breakthrough for our knowledge of the early phases of star formation in the Universe. However, with the exception of the highest redshifts, the GRBIII rate is expected to be much lower than the rate of PopII GRBs (heretheafter GRBIIs), because of the minor PopIII contribution to the cosmic star formation rate (SFR) density Salvaterra et al. (2013). For this reason, it will be more likely to detect signatures of first stars with GRBIIs rather than directly with GRBIIIs111Nonetheless, in selected cases, i.e. very massive PopIII stars, the GRBIII rate may be comparable to that of GRBII which form in a medium enriched by PopIII stars Ma et al. (2015).. Indeed, the afterglow of GRBs, expected to be visible up to very high redshift (e.g. Ciardi & Loeb 2000), carries information about the surrounding interstellar medium (ISM) through measurements of the metal abundance ratios. For example, GRB 130606A at has been observed in the full optical and near-IR wavelength region at intermediate spectral resolution with VLT/X-shooter (Hartoog et al., 2015). The spectrum has very high S/N ratio with many metal absorption lines detected. Indirect signatures of the first stars can be identified by exploring the gas enrichment patterns around GRBIIs Salvaterra et al. (2013); Ma et al. (2015). GRBIIs formed in an environment pre-enriched by massive PopIII stars (referred to as GRBIIIII in Ma et al. 2015) are expected to be preferentially hosted in galaxies with SFR and metallicity , lower than those of normal high- galaxies de Souza et al. (2013a); Salvaterra et al. (2013).
Compared to other indirect detection techniques of first stars, e.g. very metal-poor (VMP) and extremely metal-poor (EMP) stars, and also damped Lyman- absorbers (DLA) (see review e.g. Nomoto et al., 2013), observations of GRBs can extend to very high redshift, where the contribution of first stars is more significant (Ma et al., 2015). Indeed, GRBs have been observed at Cucchiara et al. (2011). Instead, because of their faint luminosity, VMP and EMP stars are only observed in our Milky Way and nearby dwarf galaxies. Even so, their metal abundances could be representative of a single (or a few) supernovae episode from first star, at least for the few cases in which the total metallicity is below the critical value, e.g. the Caffau et al. (2011) star. In principle, measurements of the abundance ratios in EMP stars could provide a hint about the IMF of PopIII stars. Also DLAs are observed at high redshift, up to Becker et al. (2012); Simcoe et al. (2012), but their number depends on the density of background quasars, which are very rare at .
However, the metal yields from PopIII supernova explosions depend strongly on the properties of their progenitor star Heger & Woosley (2002, 2010), and are thus highly uncertain, because of our persistent ignorance of the typical mass of PopIII stars, which in the current literature is predicted to be both large (e.g. Schneider et al. 2002; Heger & Woosley 2002; Suda & Fujimoto 2010) and small (e.g. Clark et al. 2011; Stacy & Bromm 2014). To improve our knowledge in this respect, here we run numerical hydrodynamical chemistry simulations with different PopIII initial mass functions (IMFs) and study how gas pollution of GRBII hosts is affected by these changes. The brightness of GRBs which can be observed by Swift/BAT and also the predicted observable GRB rate relating to first stars have been studied in Campisi et al. (2011) and Ma et al. (2015), e.g. of PopIII star enriched GRBIIs should be bright enough to trigger Swift/BAT. In this paper we focus on the effect of different first star IMFs on the fraction of GRBIIs triggered in a medium enriched by PopIII stars, and on the properties of GRBII host galaxies. We will also show how metal abundance ratios detectable in the GRB afterglow spectra of current or future spectroscopic observations can help in discriminating among different PopIII IMFs.
Throughout this work, a standard CDM cosmological model is adopted with the following parameters: cosmological constant density parameter , total matter density parameter , baryon matter density , primordial spectral index , cosmic variance within a sphere of 8 radius and expansion parameter in units of 100 . This paper is organised as follows: the simulations we used are described in Sec. 2, as well as the classification for gas particles; we present our results in Sec. 3; we critically discuss the caveats of our approach and give our conclusions in Sec. 4.
2 Simulations
The code used here is a modified version of GADGET2 code Springel (2005) based on our previous works (see e.g. Maio et al., 2007; Tornatore et al., 2007a; Maio et al., 2010, 2013a, for further details) and, besides gravity and hydro, it follows atomic and molecular cooling based on H, He, H2, HD, stellar evolution and metal pollution for various heavy elements (C, N, O, Ne, Mg, Si, S, Ca, Fe, etc.). To describe physical processes in the interstellar medium which are not directly resolved in the simulation, e.g. star formation in gas particles and feedback from stars, a subgrid model has been adopted. At the end of their lifetimes, which depend on the stellar mass, the stars explode and spread metals and energy into gas neighbours according to the SPH kernel Tornatore et al. (2007a).
We run three simulations with different PopIII IMFs, which are referred to as Very Massive SN (VMSN), Massive SN (MSN) and Regular SN (RSN), as listed in Table 1. The box side length is with particles number , yielding a gas and dark matter particle mass of and , respectively. All models adopt IMFs with Salpeter slope, but they differ in the lower/upper mass limits and the range of masses contributing to metal pollution. In the VMSN model, the first stars are assumed to be very massive, in the range [100, 500] , while the stars contributing to metal spreading are the progenitors of Pair-Instability Supernovae (PISN) in the mass range [140, 260] Heger & Woosley (2002). Both MSN and RSN models have a PopIII IMF covering masses over [0.1, 100] . In the RSN case, PopIII stars with mass [40, 100] are assumed to collapse directly into BHs, so that the only contribution to metal enrichment comes from the mass range [10, 40] Woosley & Weaver (1995); Heger & Woosley (2002). In the MSN scenario, instead, stars with masses in the range [40, 100] also contribute to metal pollution by exploding as core-collapse SNe Heger & Woosley (2010). For PopII stars we adopt a Salpeter IMF in the mass range [0.1, 100] in all the simulations.
The various metal yields are tracked during the simulations and summed up to give the total metallicity of each star or gas particle. The transition from a PopIII to a PopII/I star formation regime is dictated by the local gas metallicity. More specifically, PopIII (PopII/I) stars are formed at metallicities below (above) Schneider et al. (2002, 2003). For PopII stars we include metal yields from AGBs van den Hoek & Groenewegen (1997), type Ia SNe (SNIa; Thielemann et al. 2003) and Type II SNe (SNII; Woosley & Weaver 1995).
| Model | PopIII range [] | SN range [] | PopII range [] |
|---|---|---|---|
| VMSN | |||
| MSN | |||
| RSN |
Metal pollution by PopIII stars is followed separately from that by PopII/I stars. More specifically, for each gas particle in the simulated boxes, the fraction of metals produced by PopIII stars is defined as:
| (1) |
where is the mass of metal element in the gas particle, while is the mass coming from PopIII stars. Here indicates all heavy elements except from hydrogen and helium. According to the value of , we assign each gas particle with non-zero to one of the following three classes:
-
–
PopII-dominated, if ;
-
–
intermediate, if ;
-
–
PopIII-dominated, if .
We have verified that the exact boundaries chosen for the class definition (e.g. ) do not have a relevant impact on the results presented in the paper.
3 Results
In the following, we analyse the simulations and show results of the GRB rate evolution, the probability distribution of different class of GRBIIs given one or two metal abundance ratios, and also the properties of GRB host galaxies in the three models222While in principle metal absorption observed in the afterglow of GRBs may be due to either the IGM or the ISM, here we assume that it is representative of the host physical properties.. For the metal abundance, we only consider selected elements, such as carbon (C), oxygen (O), silicon (Si) and iron (Fe), since these are the most abundant in the Universe and easier to detect in the spectra of high- GRB afterglows Kawai et al. (2006); Castro-Tirado et al. (2013). Sulfur (S) always follows Si and shows a similar behaviour.
Quantitatively, metal abundance ratios with respect to the solar values are defined as:
| (2) |
where and are two arbitrary species, is the number density of element , and the subscript denotes the solar values from Asplund et al. (2009).
3.1 GRB rate evolution
At any given redshift, the comoving GRBII rate density in class sub-sample (i.e. PopII-dominated, intermediate or PopIII-dominated) is calculated as in Campisi et al. (2011) and Ma et al. (2015; hereafter referred to as Ma2015):
| (3) |
where is the fraction of BHs that ignites a GRBII, is the fraction of BHs formed per unit of PopII/I stellar mass, and is the comoving SFR density of class sub-sample at redshift . We adopt and following Campisi et al. (2011) and Ma2015. It should be noted that, since GRBs are related to the death of massive stars, in our calculations we include only gas particles with non-zero SFR.
In Figure 1 we show the redshift evolution of the fraction of GRBII rate which is class :
| (4) |
where is the total comoving GRBII rate density at redshift . In the figure, solid, dashed and dotted lines refer to VMSN, MSN and RSN respectively. The three models show a similar evolution, with the contribution of the PopIII-dominated class decreasing dramatically with redshift, with a fraction of about 1 at , but only at . This is a consequence of the efficient metal enrichment in the early episodes of structure formation. Indeed, after a first short period in which PopIII events in pristine molecular-driven star forming regions dominate, they rapidly leave room to following generations formed in the recently polluted material. Interestingly, although the PopIII SFR is somewhat affected by the PopIII stellar properties Maio et al. (2010, 2016), the resulting trends are not very sensitive to the scenarios adopted for the first stars IMF. The three cases evolve quite closely, with only a minor delay in the RSN scenario, due to the longer stellar lifetimes and later spreading events (consistently with SN ranges in Table 1). The small differences between the trends for VMSN and MSN are due to the different SN explosion energies (lifetimes are comparable), which imply slightly more local enrichment (hence lower PopIII contribution) in the MSN case. For VMSN metals are spread further away from star forming sites and more diluted within the hosting halo.
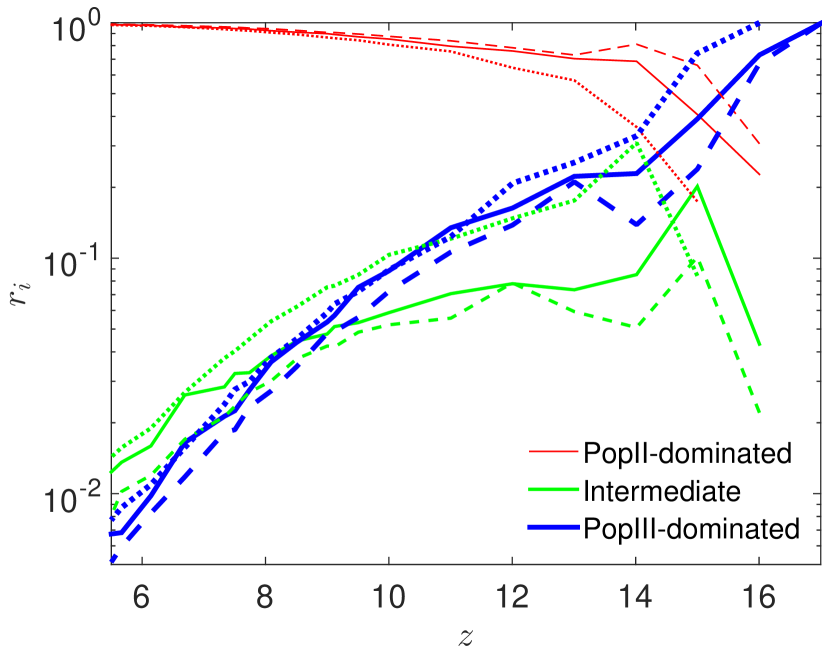
(The color version is only available in the online journal.)
The contribution of the intermediate class is always between a few per cents and , with a sharp peak at and a subsequent mild drop. This shape is led by the quick, although transitory, phase of early PopIII enrichment () at . The first explosions from short-lived stars rapidly enrich the local medium, and the ongoing spreading events from the newly born PopII stars push below the threshold (eq. 1), causing the steep increase in the figure (green lines). Due to the increasingly larger amount of metals being expelled from PopII/I stars with decreasing redshift, the values of for many star forming gas particles drop below . Thus, the contribution associated to the intermediate class () start to smoothly decrease at .
The trend of the PopII-dominated class is complementary to that of the intermediate and PopIII-dominated ones, and gradually kicks in as an increasingly larger fraction of the gas has PopII progenitors due to metal spreading and stellar evolution, i.e. increases quickly with decreasing redshift, and it approaches unity for .
We note that current data at do not show clear signatures of PopIII-dominated GRBIIs (Ma2015) and this is in agreement with the results of Figure 1 for .
3.2 Disentangling first stars models
We discuss here how we can identify PopIII star signals on the basis of the metal abundance ratios measured in the spectra of high- GRB optical/NIR afterglows. We also discuss which are the most suitable ratios to look at for constraining the PopIII IMF.
3.2.1 Single metal abundance ratio
We start considering the possibility to identify a PopIII-dominated GRBII from a single metal abundance ratio. Indeed, the measure of two or more ratios may be challenging for very high- objects, requiring deep NIR spectroscopy early after the GRB event.

The probability distribution of PopIII-dominated GRBIIs at as a function of one given abundance ratio is given by:
| (5) |
where denotes one abundance ratio and is the class GRBII rate density in the interval [, ].
In Figure 2, we show the probability distributions of [Fe/O], [Si/O], [C/O], [Si/Fe], [Fe/C] and [Si/C] for PopIII-dominated GRBIIs in the VMSN, MSN and RSN case. As a reference, we also plot the distribution for PopII-dominated GRBIIs in each panel (the PopII-dominated PDF coincides in the three cases). We note here that, since the PDFs are normalized to their total rate (see eq. 5), PopII-dominated GRBIIs always overwhelm in number the PopIII-dominated ones. Therefore, to safely identify PopIII-dominated GRBIIs we should rely only on metal abundance ratio ranges where PopII-dominated GRBIIs are not present.
Let’s analyse Figure 2 in more detail. We note that PopII-dominated and PopIII-dominated GRBIIs cover the same range in the [C/O] and [Si/Fe] panels. Therefore, these abundance ratios are not suitable to disentangle PopIII-dominated GRBs in any of our models. The VMSN model shows always the smallest dispersion with a sharp peak at [Fe/O] , [Si/O] and [C/O] . This is consistent with what found by Ma2015 (see their Fig. 4). Although the presence of a peak in the probability distribution is a unique feature of the VMSN model, in most cases this can not be identified because it is swamped by normal PopII-dominated GRBIIs. Therefore, the only unique signature for selecting PopIII-dominated GRBIIs is [Si/C] , as this characterizes at least 94% of PopIII-dominated GRBIIs.
The supernova explosions of massive PopIII stars () in the MSN model produce very low iron and silicon yields, but very high carbon and oxygen yields, so that PopIII-dominated GRBIIs in this model peak at very low [Fe/O], [Si/O] and [Fe/C], and can be identified by e.g. [Fe/O] , [Si/O] or [Fe/C] . Each of these criteria can discern at least 50-60% of PopIII-dominated GRBIIs. Since the MSN model also includes the contribution from low-mass PopIII stars (with mass ), it has the largest dispersion in each panel.
Finally, PopIII-dominated GRBIIs in the RSN model have a metal abundance distribution very similar to that of PopII-dominated GRBIIs. Although their distributions are visibly shifted compared to those of PopII-dominated GRBIIs, e.g. in the panel of [Si/O], [C/O] and[Si/C], it would be very difficult to distinguish them from the dominating PopII enriched GRBs.
3.2.2 Two metal abundance ratios
Although we have shown that a single metal abundance ratio could be enough to distinguish PopIII-dominated GRBIIs, their identification would be much easier and more efficient if two or more abundance ratios can be measured.
Figure 3 shows the probability density function of hosting a GRBII in environments with given abundance ratios and contribution to metallicity from PopIII stars at redshift :
| (6) |
where () indicate any couple of abundance ratios, while is the class GRBII rate density in the interval centered in . Contour levels for probabilities of 25%, 75% and 100% are shown. Left, central and right columns refer to VMSN, MSN and RSN scenarios. Upper, middle and lower rows refer to the bivariate probability distributions for [Si/O] vs [C/O], [Fe/C] vs [Si/C] and [Si/O] vs [O/H], respectively. We note that, since only two metal elements are necessary to plot [Si/O] vs [O/H], the challenge in producing an observational [Si/O] vs [O/H] plot could be the same as that of one single metal abundance ratio, i.e. [Si/O].
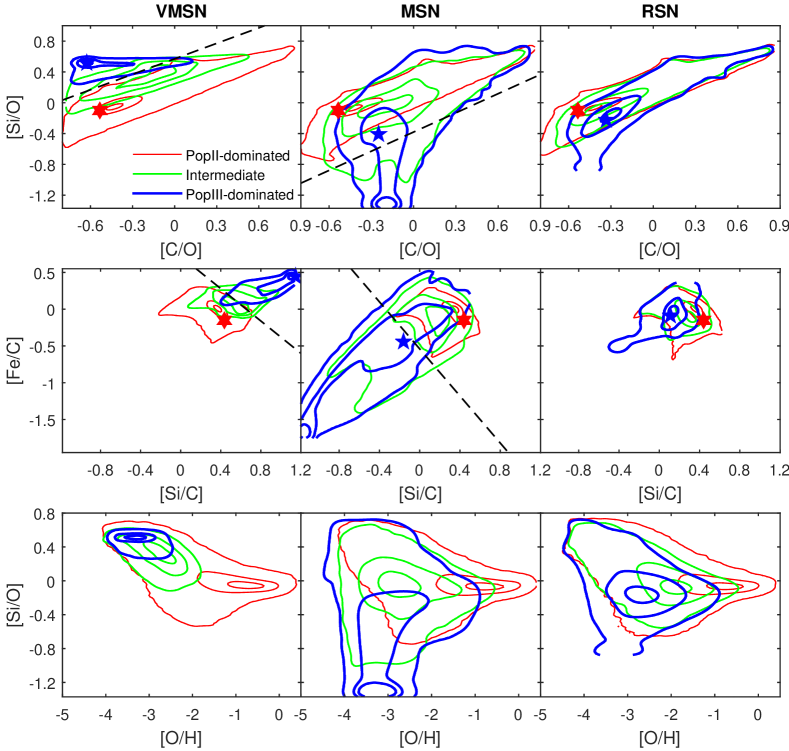
(The color version is only available in the online journal.)
Let us consider how different classes of GRBIIs populate the abundance ratio planes for our three simulation runs. We note that the contours for PopII-dominated GRBIIs look very similar in all models, as their metal signature is only little affected () by PopIII metal enrichment. In general, the panel [Si/O] vs [C/O] displays [Si/O] values following a roughly linear relation with [C/O], with a peak probability located around [C/O] and [Si/O] . The highest probability in the [Fe/C] vs [Si/C] panels is around solar [Fe/C] and slightly supersolar [Si/C]. The [Si/O] ratios evolve as the local metallicity tracked by [O/H] increases, and they converge to [Si/O] for metallicities [O/H] above .
In the VMSN model, PopIII-dominated GRBIIs are located in the upper-left corner of the plane [Si/O] vs [C/O], and can be distinguished from PopII-dominated GRBIIs by selecting those with [Si/O] [C/O] (black dashed line in the figure). The highest probability to identify a PopIII-dominated GRBII is found around [C/O] and [Si/O] (almost 75%), which is consistent with the critical conditions [C/O] and [Si/O] used in Ma2015 to select GRBIIs enriched by PopIII stars. These can also be identified by selecting [Fe/C] [Si/C] (black dashed line in the figure), where the probability peaks at [Si/C] and [Fe/C] . The panel [Si/O] vs [O/H] is not able to discriminate PopIII-dominated from PopII-dominated GRBIIs, since the distribution of the latter completely encloses the one of the former.
In the MSN model, [Si/O] and [C/O] values of the PopIII-dominated GRBIIs (upper central panel) have a partial overlap with the PopII-dominated class, although they are also located in different regions. More specifically, at least 70% of them have [Si/O] [C/O], since metal yields from PopIII stars with mass have high carbon over oxygen yields, but low silicon and iron Heger & Woosley (2010). The highest probability is around [C/O] and [Si/O] . The tail distribution of low [Si/C] and [Fe/C] can also be distinguished in the panel [Fe/C] vs [Si/C], with [Fe/C] [Si/C]. The peak values for the PopIII-dominated objects in the [Si/O] vs [O/H] panel have [Si/O] , because the [Si/O] ratio of the metal yields from PopIII stars in the MSN model is much lower than that from PopII/I stars (which have [Si/O] ), thus the two classes are completely decoupled in such regimes.
In the RSN scenario, the metal yields of PopIII stars are very similar to those from PopII/I stars. As a consequence, the contours of PopIII-dominated class overlap with those of other classes, especially the 100% level, while we can still see some visible, albeit modest, shift for the 25% and 75% contour levels in the same direction as in the MSN case.
Finally, GRBIIs of intermediate class are found to lie between those of the PopII- and PopIII-dominated class in each model.
Irrespectively from the adopted IMF, PopIII-dominated GRBIIs are always found in the low-metallicity range, i.e. at [O/H] (at least for 75% contours) since O traces total metallicity (roughly speaking, about 2/3 of heavy elements is in oxygen species). Going to higher [O/H] values, GRBIIs belong to the intermediate- and PopII-dominated class. This evolution from PopIII- to PopII-dominated class in the different scenarios can be read as a consequence of ongoing mechanical and chemical feedback in the Universe Maio et al. (2011), which increases the local enrichment level according to the corresponding stellar evolution timescales.
In the panels [Si/O] vs [C/O] and [Fe/C] vs [Si/C], we also show the corresponding IMF-integrated values of the stellar yields from PopIII stars in different models (blue pentagrams) and PopII/I stars (red hexagrams). While these values could in principle be used to identify signatures of PopIII stars, the distribution of abundance ratios as those obtained with our simulations are much more powerful tools to characterize the yields from different stellar populations.
3.3 GRB host properties
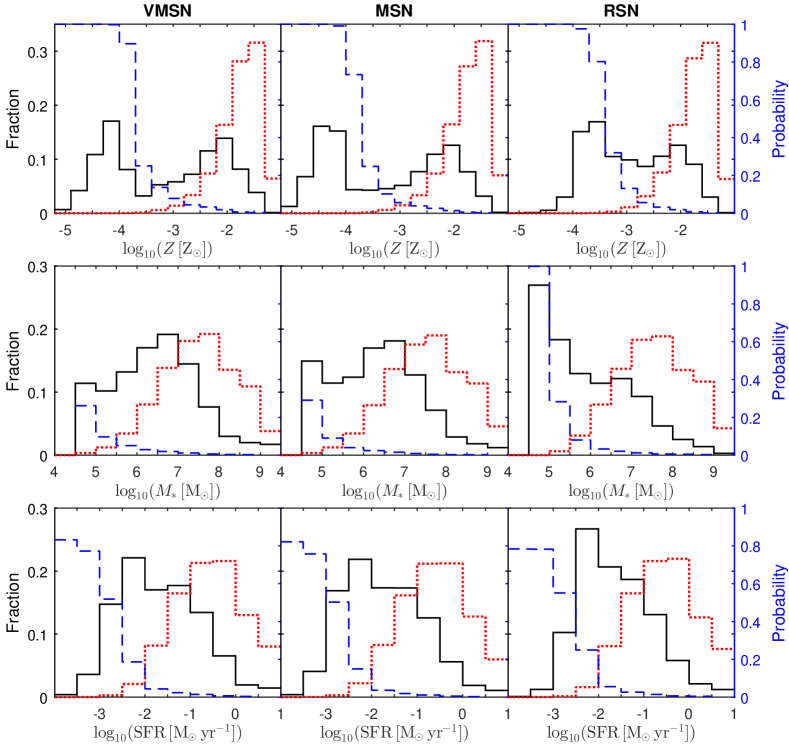
In Figure 4, we show the PopIII-dominated and PopII-dominated SFR weighted distributions of the properties of GRBII host galaxies in the three models. We focus on total metallicity (top panels), stellar mass (middle) and SFR (bottom). As in Ma2015, the weights to the corresponding distributions are computed as SFRSFRi,tot, where SFRi,k is the total class SFR of galaxies in the th bin, and SFRi,tot is the integral of class SFR over all galaxies. Here we include all the host galaxies at redshift . In each panel of the figure, the blue dashed line shows the probability for a GRBII hosted in a given galaxy to be PopIII-dominated, i.e. SFRi,k/SFRtot,k, where SFRtot,k is the total SFR of galaxies in the th bin.
A simple example can better clarify this: let’s consider the VMSN model distribution in terms of SFR (bottom-left box). Although the PopIII-dominated GRBII distribution (solid black line) peaks at SFR , the probability to find a PopIII-dominated GRBII in a galaxy (dashed blue) with SFR is only 20%. On the other hand, while a rarer event, the identification of a GRBII in a galaxy with SFR would clearly point towards a PopIII-dominated GRB.
As expected, the different first star models have little effect on the distribution of the properties of PopII-dominated GRBII hosts (dotted red lines), since the PopII/I regime becomes dominant shortly after the onset of star formation. More specifically, most of the PopII-dominated GRBIIs are hosted in galaxies with , with a peak at . Their stellar mass spans the range , peaking around . Finally, their SFR is in the range , with a peak at . These results are consistent with those found by Salvaterra et al. (2013) and seem to hold for all models.
The metallicity distribution of PopIII-dominated GRBII hosts (solid black lines) shares similar features among the three models. For example, all of them have a peak at and a second one in the range . The presence of the peak can be explained by residual PopIII star formation in the outskirts of already evolved galaxies (e.g. Tornatore et al. 2007a; Maio et al. 2010). These events can push metallicities close to PopII-dominated ones (red dotted lines). However, most PopIII-dominated GRBII hosts show metallicities lower than those of PopII-dominated hosts. In the VMSN and MSN models, the majority of other PopIII-dominated GRBIIs are in galaxies with very low metallicity (), while in the RSN model the peak of the distribution is at . This happens as the SFR of PopIII stars in the RSN model is much higher. Although the metal pollution is delayed, a large number of small mass PopIII stars can enrich the galaxies very fast and thus few galaxies have . For all models, the probability to find a PopIII-dominated GRBII (dashed blue lines) becomes lower than 10% in galaxies with .
The stellar mass of PopIII-dominated GRBII hosts in all models is distributed mainly within the range , lower than that of PopII-dominated GRBII hosts. However, while in the VMSN and MSN models a peak is present at , in the RSN model 60% of PopIII-dominated GRBIIs are found in galaxies in the lower stellar mass of the range, i.e. , with a prominent peak at . For any stellar mass, the probability of a given galaxy to host PopIII-dominated GRBIIs is very low in the VMSN and MSN model, i.e. PopIII-dominated GRBIIs are not sensitive to the stellar mass of their hosts. In the RSN model, instead, galaxies with only host PopIII-dominated GRBIIs. In fact, metal enrichment from PopIII stars in the RSN model is weaker and delayed (stellar lifetimes are up to 10 times longer than for VMSN), resulting in the survival of more pristine stars.
The three models also have similar SFR distributions for PopIII-dominated GRBII hosts. The most populated range is , with a peak at , about 1 dex lower than that of PopII-dominated GRBII hosts. In all models, the probability of hosting PopIII-dominated GRBIIs goes from 80% for galaxies with SFR to 5% for those with SFR , with only a few PopIII-dominated GRBIIs in galaxies with SFR .
4 Discussion and Conclusions
In this work we have studied the possibility to distinguish first star models with metal abundance ratios measured in high- GRB afterglow observations using N-body hydrodynamical cosmological simulations. The numerical simulations include a detailed chemical evolution, gas cooling and metallicity dependent star formation. We run three simulations, which differ only for the models for first stars (and thus the associated metal enrichment): (i) a Very Massive SN (VMSN) model with mass range [100, 500] in which metal pollution is driven by PISN with [140, 260] ; (ii) a Massive SN (MSN) model with mass range [0.1, 100] where metals are produced by SNe with [10, 100] ; and (iii) a Regular SN (RSN) model which is the same as the MSN model, but here the enrichment is done by SNe with masses of [10, 40] .
Our calculations are based on a few implicit assumptions that deserve some critical discussion as, in principle, they can affect the final results. In particular, from the point of view of the stellar properties, the PopIII SFR may be slightly changed by the particular critical metallicity adopted in the range , without altering the overall cosmic SFR and the PopII/I SFR. In addition, different stellar structure models may shift the resulting abundance ratios, although no major changes are expected, especially at low metallicities (see discussion in e.g. Maio & Tescari, 2015). In fact, a number of physical processes in stellar cores (differential rotation, the initial composition, magnetic fields, nuclear reaction rates, explosion mechanisms, etc.) may affect theoretical metal yields, although their specific values are not expected to change significantly cosmic gas evolution the fraction of GRBIIs in a PopIII-dominated medium, and the properties of GRBII host galaxies. Indeed, and mostly at early times, metallicities are dominated by oxygen, for which fairly solid constraints exist. Differently, the abundance ratios of PopIII-dominated GRBIIs are sensitive to the predicted metal yields from PopIII stars. For example, massive first stars (i.e. with mass in the MSN model) can explode both as faint supernovae and hypernovae, depending on the angular momentum of the resulting black hole (Nomoto et al., 2013). The former case produces small heavy element yields (e.g. iron; Heger & Woosley 2010; Nomoto et al. 2013), which could explain the abundance ratios of carbon-enriched metal poor (CEMP) stars observed in our Milky Way. In this case, PopIII-dominated GRBIIs in our MSN model can be identified with the abundance ratios and used to study first stars. The latter case has higher silicon and iron yields, and could be the reason for carbon-unenhanced metal poor stars (Umeda & Nomoto, 2005). Their abundance ratios are very similar to those of PopII/I stars, thus it would be difficult to separate those PopIII-dominated GRBIIs from the PopII-dominated ones. Finally, a different PopIII IMF slope may have an effect on the abundance ratio distributions, especially in the MSN model, by shifting the peak distribution discussed in Section 3.2. However, the ranges of abundance ratios which we focus on are only mildly affected, as they are mainly driven by the adopted SN mass range.
We should additionally note that physical processes in the interstellar medium are described by means of subgrid models, which have also been tested through simulations of isolated objects (e.g. Maio et al., 2013b). The effects of changing specific model parameters have been shown to be mild for star formation and enrichment, as long as the gas cooling is properly accounted for in both atomic and molecular phases, as in our simulations.
Most of our results are weighted by the GRBII rates in the gas particles of the corresponding classes. We have considered that most PopIII stars are located either in the outskirts of massive galaxies Tornatore et al. (2007b) or in low-mass galaxies Maio et al. (2011); Wise et al. (2012); Biffi & Maio (2013); Maio et al. (2016), i.e. further away from the typical location of PopII stars. This means that GRBIIs exploding in these environments are more likely to retain information from PopIII rather than from PopII/I stars. A weighting by other properties, e.g. the gas or the metal mass of the particles, would give results very similar to those we have presented, especially concerning the criteria to identify the first star signal.
Theoretically, the amplitude of metal absorption lines depends on the GRB afterglow luminosity, the spectral shape and also the ionization status of the interstellar medium. To investigate this in more details, one would need to model the luminosity and spectrum of the afterglow (e.g. Ciardi & Loeb, 2000), as well as the ionization status and dust fraction of the interstellar gas at very high resolution. This is beyond the scope of this paper. Compared to recent afterglow observations of high- GRBs, e.g. GRB 111008A Sparre et al. (2014) and GRB 130606A Hartoog et al. (2015), we find that most of the absorption lines of carbon, oxygen, silicon and iron (except several Fe lines) would be observable even at with VLT/X-shooter.
We highlight that we have defined the dominance of a population according to the fraction of heavy elements coming from PopIII stars, , with PopIII- and PopII-dominated regimes having and , respectively. Nevertheless, we have verified that the exact boundaries used for our classification (within variations) do not have a relevant impact on the final outcome.
We can summarize our main results as follows.
-
•
The fraction of second generation GRBs exploded in a medium enriched by PopIII stars (PopIII-dominated GRBIIs) is independent from the adopted first stars model. This fraction rapidly decreases with redshift, accounting for % of GRBII at , 10% at , but only 1% at . Since the PopII SFR is almost independent from the mass spectrum of PopIII stars, also the observable rate of PopIII-dominated GRBIIs is hardly affected by it.
-
•
We have explored the possibility to identify PopIII-dominated GRBIIs from observations of abundance ratios. Although not very efficient, a single ratio could in principle be enough to select PopIII-dominated GRBIIs in the VMSN and MSN model. In the former case, a unique signature is represented by a high [Si/C] ratio, i.e. [Si/C] . In the latter, PopIII-dominated GRBIIs can be identified by [Fe/O] , [Si/O] , or [Fe/C] .
-
•
PopIII-dominated GRBIIs are more easily selected using two abundance ratios. For massive or very massive SN models, the probability distribution shows memory of the adopted IMF, allowing to distinguish the two. In the VMSN model, PopIII-dominated GRBIIs are found at [Si/O] [C/O] or [Fe/C] [Si/C], whereas in the MSN model, at least 70% of them are within the limits of [Si/O] [C/O] or [Fe/C] [Si/C]. On the other hand, as metal yields from PopIII SN explosions in the RSN model are very similar to those of PopII/I SNe, in this case it is not feasible to distinguish PopIII- from PopII-dominated GRBIIs.
-
•
The properties of galaxies hosting PopIII-dominated GRBIIs are not strongly affected by the assumption on the mass of the first stars. Generally, these galaxies have metallicity , stellar mass and SFR , all lower than those of the normal PopII-dominated GRBII hosts (in agreement with Ma2015). Additionally, the GRBIIs observed in host galaxies with are most likely PopIII-dominated.
-
•
Finally, we would like to mention that none of the GRBs detected so far at shows abundance ratios favouring a PopIII-dominated environment (see Ma2015 for a case by case discussion). This is consistent with the expected fraction of PopIII-dominated GRBIIs in this redshift range, i.e. .
Acknowledgments
We acknowledge the anonymous referee for careful reading and very helpful comments that improving the presentation of the results. Q. Ma is also partially supported by the National Natural Science Foundation of China (Grant No. 11373068 and No. 11322328), the National Basic Research Program ("973" Program) of China (Grants No. 2014CB845800 and No. 2013CB834900), and the Strategic Priority Research Program "The Emergence of Cosmological Structures" (Grant No. XDB09000000) of the Chinese Academy of Sciences. We used the tools offered by the NASA Astrophysics Data Systems and by the JSTOR archive for bibliographic research.
References
- Asplund et al. (2009) Asplund M., Grevesse N., Sauval A. J., Scott P., 2009, ARA&A, 47, 481
- Becker et al. (2012) Becker G. D., Sargent W. L. W., Rauch M., Carswell R. F., 2012, ApJ, 744, 91
- Biffi & Maio (2013) Biffi V., Maio U., 2013, MNRAS, 436, 1621
- Bromm & Loeb (2002) Bromm V., Loeb A., 2002, ApJ, 575, 111
- Caffau et al. (2011) Caffau E. et al., 2011, Nature, 477, 67
- Campisi et al. (2011) Campisi M. A., Maio U., Salvaterra R., Ciardi B., 2011, MNRAS, 416, 2760
- Castro-Tirado et al. (2013) Castro-Tirado A. J., Sánchez-Ramírez R., Ellison S. L., Jelínek M., Martín-Carrillo A., 36co authors, 2013, ArXiv:1312.5631
- Ciardi & Loeb (2000) Ciardi B., Loeb A., 2000, ApJ, 540, 687
- Clark et al. (2011) Clark P. C., Glover S. C. O., Smith R. J., Greif T. H., Klessen R. S., Bromm V., 2011, Science, 331, 1040
- Cucchiara et al. (2011) Cucchiara A. et al., 2011, ApJ, 736, 7
- de Souza et al. (2013a) de Souza R. S., Ciardi B., Maio U., Ferrara A., 2013a, MNRAS, 428, 2109
- de Souza et al. (2013b) de Souza R. S., Mesinger A., Ferrara A., Haiman Z., Perna R., Yoshida N., 2013b, MNRAS, 432, 3218
- de Souza et al. (2011) de Souza R. S., Yoshida N., Ioka K., 2011, A&A, 533, A32
- Elliott et al. (2015) Elliott J., Khochfar S., Greiner J., Dalla Vecchia C., 2015, MNRAS, 446, 4239
- Ghirlanda et al. (2015) Ghirlanda G. et al., 2015, MNRAS, 448, 2514
- Hartoog et al. (2015) Hartoog O. E. et al., 2015, A&A, 580, A139
- Heger & Woosley (2002) Heger A., Woosley S. E., 2002, ApJ, 567, 532
- Heger & Woosley (2010) Heger A., Woosley S. E., 2010, ApJ, 724, 341
- Inoue et al. (2010) Inoue S., Salvaterra R., Choudhury T. R., Ferrara A., Ciardi B., Schneider R., 2010, MNRAS, 404, 1938
- Kawai et al. (2006) Kawai N. et al., 2006, Nature, 440, 184
- Ma et al. (2015) Ma Q., Maio U., Ciardi B., Salvaterra R., 2015, MNRAS, 449, 3006
- Maio & Barkov (2014) Maio U., Barkov M. V., 2014, MNRAS, 439, 3520
- Maio et al. (2010) Maio U., Ciardi B., Dolag K., Tornatore L., Khochfar S., 2010, MNRAS, 407, 1003
- Maio et al. (2013a) Maio U., Ciardi B., Müller V., 2013a, MNRAS, 435, 1443
- Maio et al. (2007) Maio U., Dolag K., Ciardi B., Tornatore L., 2007, MNRAS, 379, 963
- Maio et al. (2013b) Maio U., Dotti M., Petkova M., Perego A., Volonteri M., 2013b, ApJ, 767, 37
- Maio et al. (2011) Maio U., Khochfar S., Johnson J. L., Ciardi B., 2011, MNRAS, 414, 1145
- Maio et al. (2016) Maio U., Petkova M., De Lucia G., Borgani S., 2016, MNRAS, 460, 3733
- Maio et al. (2012) Maio U., Salvaterra R., Moscardini L., Ciardi B., 2012, MNRAS, 426, 2078
- Maio & Tescari (2015) Maio U., Tescari E., 2015, MNRAS, 453, 3798
- Maio & Viel (2015) Maio U., Viel M., 2015, MNRAS, 446, 2760
- Nagamine et al. (2008) Nagamine K., Zhang B., Hernquist L., 2008, ApJ, 686, L57
- Nomoto et al. (2013) Nomoto K., Kobayashi C., Tominaga N., 2013, ARA&A, 51, 457
- Salvaterra (2015) Salvaterra R., 2015, Journal of High Energy Astrophysics, 7, 35
- Salvaterra et al. (2012) Salvaterra R. et al., 2012, ApJ, 749, 68
- Salvaterra & Chincarini (2007) Salvaterra R., Chincarini G., 2007, ApJ, 656, L49
- Salvaterra et al. (2009) Salvaterra R. et al., 2009, Nature, 461, 1258
- Salvaterra et al. (2013) Salvaterra R., Maio U., Ciardi B., Campisi M. A., 2013, MNRAS, 429, 2718
- Schneider et al. (2002) Schneider R., Ferrara A., Natarajan P., Omukai K., 2002, ApJ, 571, 30
- Schneider et al. (2003) Schneider R., Ferrara A., Salvaterra R., Omukai K., Bromm V., 2003, Nature, 422, 869
- Simcoe et al. (2012) Simcoe R. A., Sullivan P. W., Cooksey K. L., Kao M. M., Matejek M. S., Burgasser A. J., 2012, Nature, 492, 79
- Sparre et al. (2014) Sparre M. et al., 2014, ApJ, 785, 150
- Springel (2005) Springel V., 2005, MNRAS, 364, 1105
- Stacy & Bromm (2014) Stacy A., Bromm V., 2014, ApJ, 785, 73
- Suda & Fujimoto (2010) Suda T., Fujimoto M. Y., 2010, MNRAS, 405, 177
- Suwa & Ioka (2011) Suwa Y., Ioka K., 2011, ApJ, 726, 107
- Takahashi et al. (2011) Takahashi K., Inoue S., Ichiki K., Nakamura T., 2011, MNRAS, 410, 2741
- Tanvir et al. (2009) Tanvir N. R. et al., 2009, Nature, 461, 1254
- Thielemann et al. (2003) Thielemann F.-K. et al., 2003, Nuclear Physics A, 718, 139
- Toma et al. (2011) Toma K., Sakamoto T., Mészáros P., 2011, ApJ, 731, 127
- Tornatore et al. (2007a) Tornatore L., Borgani S., Dolag K., Matteucci F., 2007a, MNRAS, 382, 1050
- Tornatore et al. (2007b) Tornatore L., Ferrara A., Schneider R., 2007b, MNRAS, 382, 945
- Umeda & Nomoto (2005) Umeda H., Nomoto K., 2005, ApJ, 619, 427
- van den Hoek & Groenewegen (1997) van den Hoek L. B., Groenewegen M. A. T., 1997, A&AS, 123, 305
- Wise et al. (2012) Wise J. H., Turk M. J., Norman M. L., Abel T., 2012, ApJ, 745, 50
- Woosley & Weaver (1995) Woosley S. E., Weaver T. A., 1995, ApJS, 101, 181