Measuring Structural Parameters Through Stacking Galaxy Images
Abstract
It remains challenging to detect the low surface brightness structures of faint high- galaxies, which is key to understanding the structural evolution of galaxies. The technique of image stacking allows us to measure the averaged light profile beneath the detection limit and probe the extended structure of a group of galaxies. We carry out simulations to examine the recovery of the averaged surface brightness profile through stacking model HST/ACS images of a set of galaxies as functions of Srsic index (), effective radius () and axis ratio (). The Srsic profile best fitting the radial profile of the stacked image is taken as the recovered profile, in comparison with the intrinsic mean profile of the model galaxies. Our results show that, in general, the structural parameters of the mean profile can be properly determined through stacking, although systematic biases need to be corrected when spreads of and are counted. We find that Srsic index is slightly overestimated and is underestimated at as the stacked image appears to be more compact due to the presence of inclined galaxies; the spread of biases the stacked profile to have a higher Srsic index. We stress that the measurements of structural parameters through stacking should take these biases into account. We estimate the biases in the recovered structural parameters from stacks of galaxies when the samples have distributions of , and seen in local galaxies.
Subject headings:
galaxies: evolution — galaxies: structure — galaxies: photometry1. INTRODUCTION
The evolution of galaxies are found both theoretically and observationally to correlate with stellar mass (e.g., Kauffmann et al., 2003; Bundy et al., 2006; Dekel & Birnboim, 2006; Guo & White, 2008; Peng et al., 2010), yielding fundamental relationships between stellar mass and color (Baldry et al., 2004), size (Shen et al., 2003), metallicity (Tremonti et al., 2004) and star formation rate (Brinchmann et al., 2004) among local galaxies (see Blanton & Moustakas, 2009, for a review). These relationships evolve significantly out to high redshifts (e.g., Erb et al., 2006; Zheng et al., 2007; Brammer et al., 2011; Wuyts et al., 2010; Wuyts et al., 2011; Shapley, 2011, and references therein). Much effort has been made to characterize the structural properties of galaxies at different cosmic epochs in order to dissect different physical processes regulating galaxy evolution (Conselice, 2014). The size of massive galaxies has been found to increase on average by a factor of since 2 (e.g., Trujillo et al., 2006; Trujillo et al., 2007; Toft et al., 2007; Zirm et al., 2007; van der Wel et al., 2008; Mancini et al., 2010; Damjanov et al., 2011; Newman et al., 2012; Krogager et al., 2013; Belli et al., 2014; van der Wel et al., 2014). van Dokkum et al. (2010) found that an extended stellar halo around massive galaxies was gradually built up over cosmic time, suggesting that accretion of satellite galaxies plays a key role in governing the size growth of the massive galaxies (Naab et al., 2009; Oser et al., 2010). While physical interpretations of the dramatic size evolution are still under debate (e.g., Hopkins et al., 2010), the spatially-resolved brightness profile as a function of redshift turn out to be crucial to unveiling the assembly histories of galaxies (e.g., Trujillo et al., 2011; Hilz et al., 2013). In particular, the brightness profiles of low-mass galaxies at high- are poorly explored.
It is technically challenging to measure the brightness profiles towards large radius for typical () and low-mass galaxies at high redshifts even with deep imaging of the Hubble Space Telescope (HST) (Szomoru et al., 2012). The size of galaxies may be underestimated if the extended structure of low surface brightness is not detected (e.g., Ferguson & Binggeli, 1994; Bezanson et al., 2009; Naab et al., 2007, 2009; Mancini et al., 2010). Stacking is a powerful tool to suppress background noise and detect fluxes beneath the detection limit for individual objects. It has been applied successfully in studies with optical (e.g., Zibetti et al., 2004; van der Wel et al., 2008; van Dokkum et al., 2010), infrared (e.g., Zheng et al., 2006; Lee et al., 2010; Bourne et al., 2012; Guo et al., 2013), and radio (e.g., White et al., 2007; Garn & Alexander, 2009; Hancock et al., 2011) imaging data. van Dokkum et al. (2010) examined the systematical effects in parameterizing the mean structure of massive galaxies via stacking ground-based images, finding that the averaged size and Srsic index can be recovered when each of the stacked galaxies is characterized by a single Srsic profile. In practice, galaxies tend to have multiple components (e.g., bulge+disk) with different surface brightness profiles; galaxies of similar stellar masses have effective radius and/or axis ratio (or inclination angle) spanning over a range (Shen et al., 2003; Hao et al., 2006; Padilla & Strauss, 2008). Further investigation is demanded to address how the scatter in effective radius, axis ratio and Srsic index effect on the recovered structural parameters from the stacked images and to which extent the results of stacking are accurate and robust.
In this paper, we present the results of our simulation to characterize the dependences of the averaged structural parameters of faint galaxies derived from stacking on effective radius (), axis ratio (), index of Srsic profile (), and the distributions of these parameters. We describe our methodology in Section 2. In Section 3 we present the simulation results. We discuss our results and summarize them in Section 4. We assume a cosmology with =70 km s-1 Mpc-1, =0.3, and =0.7 throughout this paper.
2. METHODOLOGY
2.1. Galaxy Models
The existing deep optical and near-infrared imaging data from large surveys with HST, including GEMS (Rix et al., 2004), COSMOS (Scoville et al., 2007b) and CANDELS (Grogin et al., 2011), provide the basis for a stacking analysis of faint high- galaxies. In particular, the HST/Advanced Camera for Surveys (ACS) imaging of COSMOS over 1.48 deg2 (Koekemoer et al., 2007) through the () filter allows for morphological examination for large samples of galaxies. In our simulations, we adopt a pixel size of 005 (same as HST/ACS pixel size) and ACS Point Spread Function (PSF) in the band to generate galaxy model images. A physical scale of 100 kpc then corresponds to [280, 250, 239] pixels at =[0.7, 1, 2]. A size of pixels is chosen for the model images to have the radial surface brightness profile extended to kpc and have background estimation out to kpc for galaxies at .
Three structural parameters are used to characterize the two-dimensional model image of a galaxy: index of Srsic profile (), effective radius () and axis ratio () . Position angle is randomly chosen between 0 and 180 degrees for . The Srsic profile is described by
| (1) |
The axis ratio (), defined as the ratio of minor axis over major axis , measures the elongation in morphology for early-type galaxies or the inclination for late-type galaxies. The model galaxy is centered at the centroid of the image, which is then convolved with the empirical PSF derived from HST/ACS -band images using a number of isolated bright stars. The Full Width at Half Maximum (FWHM) of the PSF is or 2.2 pixels. The total brightness of the model image is scaled to match the total flux in analog-digital units (ADU) for a galaxy ranges from 24 mag to 24.75 mag (i.e., a factor of 3 spread in flux) in the HST images from COSMOS. We adopt a faint-end slope of 0.47 for early-type galaxies and 1.37 for late-type galaxies to determine the distribution of magnitude of the galaxies (Tomczak et al., 2014), and we add photon noise and background noise to match the noise level in the HST images of COSMOS in order to address the effect of noise. An IDL code SIMULATE_GALAXY.PRO111http://www.mpia.de/GEMS/fitting_utilities/simulate_galaxy.pro (see Häussler et al., 2007, for more technical details) is used to create a galaxy model image at given , and . We also randomly locate the center of a model galaxy within a pixel to match observations. A set of galaxy model images are shifted and aligned to the same center before stacking. Due to the noises, the measured center of a model galaxy slightly differs from the actual center. We will discuss the effects of this issue to the final conclusions in Section 3.7.
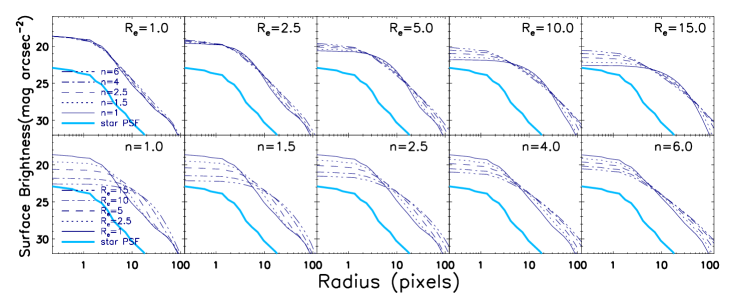
In practice, the structural parameters are barely known for individual faint high- galaxies; the stacked image is often obtained by directly co-adding the aligned galaxy images without corrections for inclination, orientation and size (but see, e.g., Zibetti et al., 2005); the stacked surface brightness profile is usually derived from the stacked image using circular apertures. We generate galaxy models with structural parameters spanning over sufficiently wide ranges: , and . Firstly, we examine the measurement of surface brightness profiles derived using circular apertures from a single model image in relations to each of structural parameters and . Secondly, we test the recovery of the mean surface brightness profile when a set of stacked galaxies have two parameters fixed and the third parameter following a certain distribution. Each set contains 700 model images, which is representative of practical cases for stacking. We divide galaxy models into late-type () and early-type () because the two populations are distinct in structure (Blanton & Moustakas, 2009). We adopt the log-normal distributions of for the two populations from Shen et al. (2003). The log-normal distribution of is described by the scatter and the median . More massive galaxies have larger . The distribution of late-type galaxies comes from Padilla & Strauss (2008) and that of early-type galaxies from Hao et al. (2006) is adopted. At a given distribution, the other two parameters and vary across the corresponding parameter space. When falls into and , the distribution of the late-type and of the early-type galaxies are used, respectively. And ranges from 005 to 075 (1 to 15 pixels), corresponding to a physical scale of 0.5 to 6.0 kpc at . Similarly, we generate each set of model images for stacking at a fixed and with following the given distribution. Thirdly, we let and follow the corresponding distributions and generate models as functions of and to see the integrated effect of the spreads of these parameters. Finally, we let and follow the distributions as described above, and Srsic index follows a uniform distribution between for late-type galaxies and for early-type galaxies. This simulates the case that faint galaxies are usually selected by color (or type) and mass (or luminosity), and their , , and often spread over a certain range. Table 1 lists the structural parameters of galaxy models adopted in our simulations. Figure 1 demonstrates the surface brightness profiles of these single-profile models with for comparison.
| single-profile models | |
|---|---|
| 1, 1.5, 2.5, 4, 6 | |
| 1.0, 2.5, 5.0, 10.0, 15.0 | |
| 0.10, 0.17, 0.34, 0.50, 0.64, | |
| 0.76, 0.86, 0.93, 0.98, 1.00 | |
| models involving spread | |
| 1, 1.5, 2.5, 4, 6 | |
| 1.0, 2.5, 5.0, 10.0, 15.0 | |
| models involving spread | |
| 1, 1.5, 2.5, 4, 6 | |
| 1.0, 2.5, 5.0, 10.0, 15.0 | |
| 1.0 | |
| models involving and spreads | |
| 1 , 1.5 , 2.5 , 4 , 6 | |
| 1.0, 2.5, 5.0, 10.0, 15.0 | |
| models involving spread | |
| 1.5 , 3.5 | |
| 1.0, 2.5, 5.0, 10.0, 15.0 | |
| 1.0 | |
| models involving , , and spreads | |
| 1.5 , 3.5 | |
| 1.0, 2.5, 5.0, 10.0, 15.0 | |
2.2. Stacking galaxy images
A set of model images for stacking have the same size of pixels, with photon noise and background noise counted. Before stacking a set of model galaxy images, we first measure the positions of the galaxies using Sextractor (Bertin & Arnouts, 1996) and shift them to the same position in all images. We note that the measurement errors of positions and shifting of images introduce uncertainties into the stacked profile. We also stack model images free from noise and offsets in position to quantify the corresponding uncertainties due to the noises and errors in aligning the galaxies. Each set contains 700 galaxy model images and is combined together using the averaging algorithm. Because the position angle of model galaxies is randomly distributed, the averaged profile is rotationally symmetric. The radial surface brightness profile is thus sufficient to characterize the averaged profile. The radial profile is derived from the stacked image using 21 circular apertures with radii from 0.5 to 140 pixels evenly split in logarithm. The software tool APER.PRO from the IDL Astronomy User’s library 222http://idlastro.gsfc.nasa.gov/ is used to perform aperture photometry. We use an annulus of to (about 50 to 70 kpc at ) for sky background estimation.
2.3. The Intrinsic Surface Brightness Profile
A measured surface brightness profile usually needs to correct for the PSF effect in order to obtain the intrinsic profile. Instead, we follow Szomoru et al. (2012) to fit the one-dimensional (1-D) radial surface brightness profile of a stacked image with a library of 1-D Srsic profiles convolved by the same PSF. The library is created in the same way as we generate galaxy models and extract their radial profiles using circular apertures, covering in a step of and in a step of 0.1. The method of least squares is used to select the best fitting and the corresponding Srsic profile is taken as the intrinsic profile for the stacked image. Similarly, the decomposition of a 1-D surface brightness profile into bulge+disk components can be done by best fitting the profile with the combination of two distinct Srsic profiles.
3. ANALYSIS AND RESULTS
3.1. The elongation/inclination effects
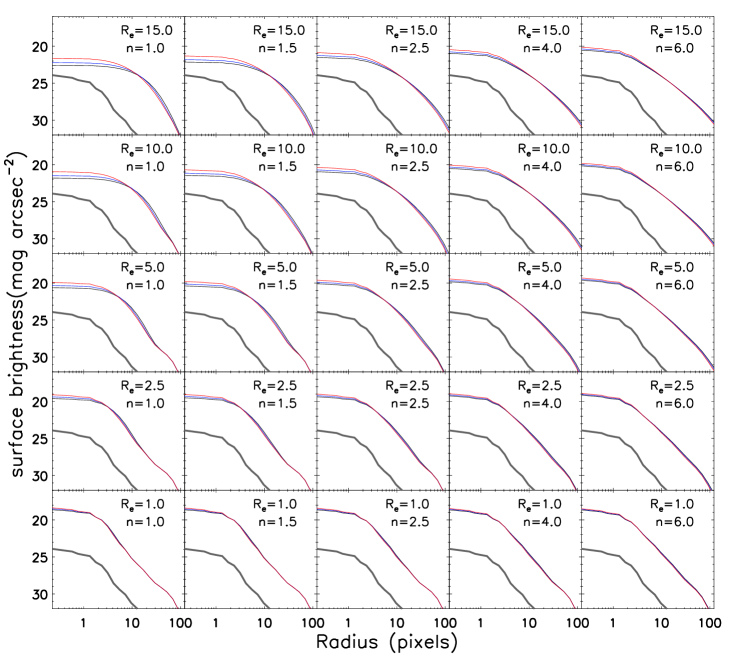
The elongation (or inclination for disk galaxies) of individual stacked galaxies is usually not corrected in stacking. Here we examine how the elongation/inclination affects the recovery of the structural parameters of a Srsic profile. We extract the radial surface brightness profiles using circular apertures from the single-profile galaxy model images listed in Table 1. We note that these model images are convolved with ACS PSF. Figure 2 shows the single-Srsic profiles as functions of , and . The PSF profile is also presented with an arbitrary normalization for clarity. Red and blue lines show =0.34 and 0.68 in each panel. We can see that the surface brightness profile of a galaxy appears to be more compact at edge-on than at face-on when circular apertures are adopted. The bias becomes larger for late-type galaxies with larger .
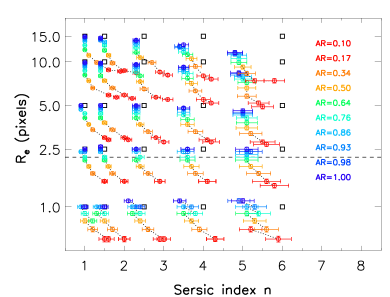
We measure the structural parameters from a radial surface brightness profile using the method described in Section 2.3. Figure 3 shows the effects of the elongation/inclination on the recovery of the intrinsic structural parameters of these galaxy models. When =1, the recovered Srsic index and effective radius perfectly match the input values when the input Srsic index is low, but the recovered Srsic index is lower than the input value when the input Srsic index is high. For model galaxies with high Srsic index and large effective radius, the effective radius of the stacked profile tends to be underestimated. This is because such galaxies exhibit profiles with extended wings out to large radii, leading to an oversubtraction of the background and thus underestimate in both Srsic index and effective radius. We plot the fraction of light outside 125 pixels (about 625 and 50 kpc at 1) as a function of Srsic index and effective radius in Figure 4. We can see that for late-type galaxies, the light beyond is negligible. For early-type galaxies, however, the light out of dramatically increases with the effective radius, and reaches up to 10% for galaxies with and =15 pixels. This indeed leads to the oversubtraction of background in our measurements, and consequently to underestimate of both Srsic index and effective radius for early-type galaxies. We note that the underestimate of Srsic index due to background oversubtraction can be corrected once a larger annulus is adopted for background estimate. For a model galaxy with and =15 pixels, background estimate from out regions pixels (186 kpc at ) may suppress light contamination from the galaxy to 1%; and the Srsic index can be recovered as well as for galaxies with .
Figure 3 shows that Srsic index is increasingly overestimated for galaxies with lower (i.e., more inclined). The overestimate is significant only at , and becomes larger for larger at small (), from 1 when =15 pixels (6 kpc at ), to 0.5 when =1 pixel. Meanwhile, is increasingly underestimated at decreasing . The recovered deviates from the intrinsic value by up to 50% at the minimal ; and the deviation does not strongly depend on and .
We conclude that elongation/inclination () influences the estimate of structural parameters and when the radial surface brightness profile is extracted from a galaxy image using circular apertures. The galaxy would appear to be more compact, i.e., with larger and smaller , at decreasing , if the elongation/inclination is ignored. We point out that the bias in recovering structural parameters through stacking from elongation effects is negligible for early-type galaxies () because the early-type galaxies usually have (at least in the local universe, Hao et al., 2006), and the main source of bias is from background estimation. For late-type galaxies (), the inclination leads to overestimate of and underestimate of .
Next step is to test the measurement of the mean surface brightness profile from the stacked image of individual galaxy models with two parameters fixed and the third parameter following a given distribution.
3.2. Effects of spread
For each pair of structural parameters (, ) listed in Table 1, a set of 700 galaxy model images are generated to have the fixed and but spreading within a distribution. We adopt the distribution of late-type galaxies () from Padilla & Strauss (2008) and that of early-type galaxies () from Hao et al. (2006). These images are stacked together and a radial surface brightness profile is then obtained. The intrinsic parameter of the mean profile is given by (, ).
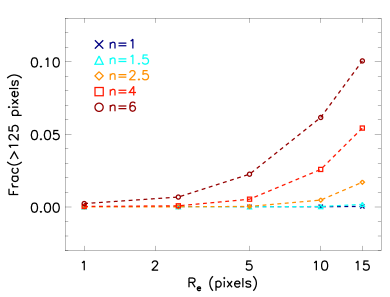
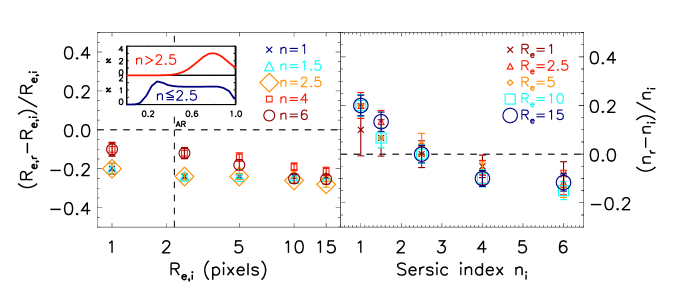
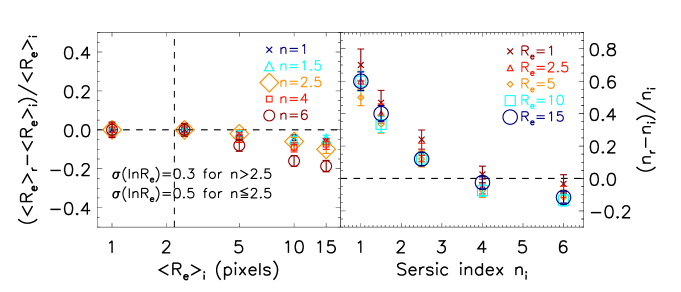
Figure 5 shows the results of our simulation when is spread according to a realistic distribution rather than fixed. The two empirical distributions are shown in the inner panels. The left plot gives the difference between recovered and input as a function of the input and the right plot presents the deviation of recovered from input as a function of the input . The recovered is systematically smaller by 12% to 27% over pixels. For late-type galaxies, the degree of underestimate in does not depend on itself, suggesting that the distribution is responsible for the underestimate. But for early-type galaxies, the degree of underestimate in increases as the increases. Given that the oversubtraction of background becomes more serious for early-type galaxies with larger size, it is reasonable to attribute the increase of the degree of underestimate in to the oversubtraction of background. Apparently, the estimate of is more biased for late-type galaxies due to the highly-inclined ones () which are absent in the early-type galaxies when the effective radius is not very large. Similarly, is overestimated by up to 20% for late-type galaxies because of the inclination effect due to those with . Again, the overestimate of does not rely on significantly. For early-type galaxies, can be underestimated up to 15%, and the underestimation of increases as increases. As most of them are with 0.5 in terms of the distribution from Hao et al. (2006), the overestimation of can be ignored for early-type galaxies, thus the oversubtraction of background dominates the estimation of and makes underestimated, especially for galaxies with larger which have more extended halo in the outskirts. As shown in Figure 3, the recovery of is marginally biased by inclination/elongation effects at 0.5. These results denote that the function of the distribution regulates the deviation of the recovered and from the original values for late-type galaxies, and the estimation of background affects the estimation of structural parameters for early-type galaxies.
Differing from the claim in van Dokkum et al. (2010) that the recovery of structural parameters is not sensitive to the distribution of , we show that the distribution may significant bias the recovery of and , dependent on the fraction of highly-inclined or elongated ones; the stacked profile appears to be more compact (i.e., with smaller and higher at the same time) if the elongation/inclination effect is not corrected.
3.3. Effects of spread
Figure 6 shows our simulation results of stacking model galaxies with a fixed but following a log-normal distribution. Here is adopted to get rid of the effect. The log-normal distribution is described by the median and scatter . We adopt =0.3 dex for early-type galaxies and =0.5 dex for late-type galaxies from Shen et al. (2003). As shown in the left panel of Figure 6, the input median effective radius is well recovered through stacking for late-type galaxies and early-type galaxies with small effective radius, but for early-type galaxies with large radius, the underestimation of can be up to 15% due to the oversubtraction of background. However, is increasingly overestimated by up to 60% at decreasing . This tendency has no dependence on the median of the log-normal distribution of . For early-type galaxies, the can still be underestimated due to the oversubtraction of background.
One can infer from Figure 6 that the median of a log-normal distribution of can be properly measured from the stacked profile of galaxies; but the spread of leads to an overestimate of for late-type galaxies (2.5).
3.4. Effects of and spreads
We have shown that the spread of biases the estimates of structural parameters of the mean profile through stacking, leading the stacked profile to be more compact, say with smaller and higher ; and the spread of does not influence the estimate of median but deviates to be higher. The effects of the two spreads are significant only for stacking of late-type galaxies (2.5). Now we include both the two spreads in stacking and examine their effects on the recovery of the structural parameters. Again, and follow distinct distributions for early- and late-type galaxies as mentioned before. We note that the effects of the two spreads are not correlated with the median .
Figure 7 shows the results of stacking with both of the and spreads involved. We also over plot the results from Figure 5 and 6 for comparison. We can see that the mixture of and spreads biases the estimates of median and in the same way as the effects of the two spreads combine linearly together. The median is underestimated by 20%-27% and 10%-20% for late-type and early-type galaxies, depending on the of the galaxies, respectively, caused by the spread and the estimation of background; and is increasingly overestimated by up to 70% at decreasing , equal to a linear combination of the deviations caused by each of the two spreads.
In summary, our simulations manifest that the measured size () and Srsic index () of the averaged profile by stacking a set of galaxies deviate from the input values when the stacked galaxies disperse in axis ratio () and/or half-light radius (). The deviations depend on the type of stacked galaxies () and distribution functions of and . The stacked profile tends to be more compact for late-type galaxies, and the oversubtraction of background dominates the estimation of structural parameters for early-type galaxies and make the profile to be smaller in both and . With given distributions of and/or , the deviations in estimates of and can be quantitatively determined and thus corrected accordingly.
It is worth noting that the effects caused by the spread of depend strongly on the distribution function of . The averaged profile of a set of Srsic profiles with fixed and =1 is much close to the median one. The derived from stacking are rather reliable with uncertainties of 0.5 for both late-type and early-type galaxies (see the Appendix of van Dokkum et al., 2010, for more details). We will also discuss this issue in Section 3.5. However, it remains to be explored when two distinct types of profiles are stacked together.
3.5. Effects of spread
Generally speaking, a set of galaxies of similar properties (e.g., stellar mass or color) are often selected for stacking to derive their mean profile. For instance, galaxies are often divided into two populations: star-forming and quiescent. The star-forming galaxies tend to have Sersic index between 1 and 2 and the quiescent galaxies have Sersic index systematically higher. In order to test how the spread of affects the stacked results, we adopt a uniform distribution of between for late-type galaxies and for early-type galaxies, with fixed and . Figure 8 shows that the is almost identical to the input values for LTGs and small ETGs, and for large ETGs, the can be slightly underestimated due to the oversubtraction of background, which can be seen from Figure 3. The median Srsic index can be recovered well for both late-type galaxies and early-type galaxies, though the recovered Srsic index is slightly lower than the input median Srsic index for the early-type galaxies with large effective radius.
3.6. Effects of spreads in , and
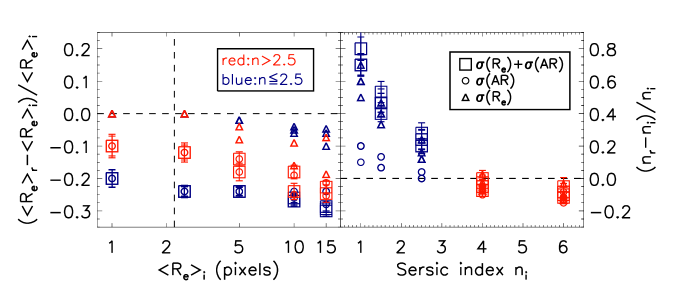
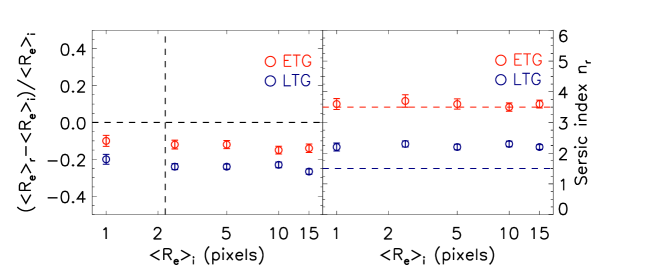
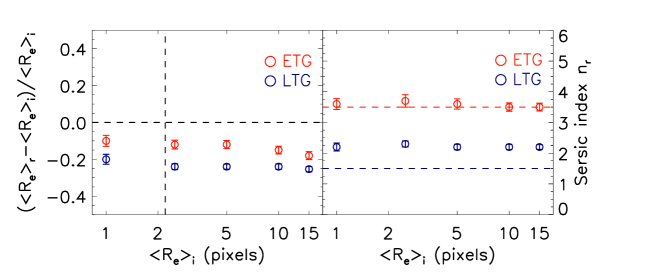
We account for the spreads in , and together in our stacking exercises, and examine whether the averaged structural parameters can be well recovered through stacking. Our results shown in Figure 9 denote that the may be underestimated up to 20%26% for late-type galaxies but only 10%15% for early-type galaxies. The presence of highly-inclined late-type galaxies is believed to cause the additional bias to the underestimate of the averaged effective radius. The median can be well recovered for early-type galaxies, but overestimated by for late-type galaxies. This is due to late-type galaxies having larger dispersion in and highly-inclined ones. The early-type galaxies have smaller dispersion in , leading to a smaller overestimate of , which can be diluted by the underestimation of caused by the oversubtraction of background.
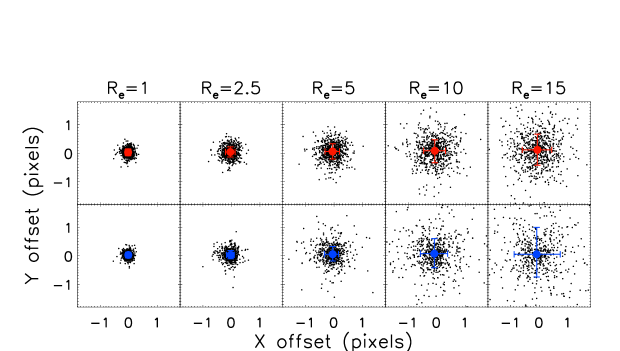
3.7. Uncertainties in aligning images
For faint galaxies, the measured position is affected by noise and thus offset slightly from the true position. In our stacking analysis, we measure the positions of model galaxies using Sextractor and shift the galaxies to the same position in all images before stacking. Figure 10 shows that 68 percentile of the measured positions deviate less than 1 pixel from the true positions. At fixed magnitudes, galaxies with more extended structure (i.e., larger effective radius) exhibit larger deviation in measuring their positions. In order to quantitatively estimate the uncertainties caused by the errors in aligning images, we repeat the stacking exercises presented in Figure 9 but with model galaxies generated to exactly center at the same position in all images. No image aligning is employed here. Figure 11 shows the corresponding results. We can see that the recovered parameters of the stacked profiles at all and from Figure 11 are nearly identical to these given in Figure 9, indicating that the error in aligning galaxy images is not a source to bias the recovery of the mean structural parameters through stacking, at least for galaxies with mag and brighter.
| Input parameters | Recovered parameters | |||||||||||||||||||
| Individual bulge+disk models | Stacks with & | Stacks with , & | ||||||||||||||||||
| 15.0 | 15.0 | 0.1 | 15.0 | 15.5 | 0.10 | 1.2 | 14.6 | 10.4 | 15.9 | 0.50 | 1.9 | 11.4 | 10.8 | 13.6 | 0.46 | 1.8 | 11.0 | |||
| 15.0 | 10.0 | 0.1 | 15.0 | 10.2 | 0.10 | 1.3 | 14.2 | 10.6 | 13.2 | 0.46 | 1.8 | 10.8 | 10.3 | 15.1 | 0.52 | 1.9 | 11.1 | |||
| 15.0 | 5.0 | 0.1 | 15.0 | 5.0 | 0.10 | 1.4 | 13.2 | 10.1 | 13.3 | 0.53 | 2.0 | 10.6 | 10.4 | 12.1 | 0.51 | 1.9 | 10.4 | |||
| 10.0 | 10.0 | 0.1 | 10.0 | 10.1 | 0.10 | 1.1 | 9.7 | 7.6 | 8.1 | 0.45 | 1.8 | 7.4 | 7.6 | 8.1 | 0.45 | 1.8 | 7.4 | |||
| 10.0 | 5.0 | 0.1 | 10.0 | 5.0 | 0.10 | 1.2 | 9.2 | 7.5 | 7.3 | 0.46 | 1.8 | 7.1 | 7.5 | 7.3 | 0.46 | 1.8 | 7.1 | |||
| 10.0 | 2.5 | 0.1 | 10.0 | 2.5 | 0.10 | 1.4 | 8.7 | 7.4 | 6.6 | 0.49 | 1.9 | 6.8 | 7.5 | 6.4 | 0.49 | 1.9 | 6.8 | |||
| 5.0 | 5.0 | 0.1 | 5.0 | 5.0 | 0.10 | 1.2 | 4.9 | 4.2 | 3.7 | 0.50 | 1.9 | 3.8 | 4.1 | 3.9 | 0.50 | 1.9 | 3.8 | |||
| 5.0 | 2.5 | 0.1 | 5.0 | 2.5 | 0.10 | 1.2 | 4.7 | 4.1 | 3.4 | 0.51 | 1.9 | 3.7 | 4.1 | 3.4 | 0.51 | 1.9 | 3.7 | |||
| 5.0 | 1.0 | 0.1 | 5.0 | 1.0 | 0.10 | 1.2 | 4.4 | 4.1 | 3.0 | 0.54 | 2.0 | 3.5 | 4.1 | 3.0 | 0.54 | 2.0 | 3.5 | |||
| 15.0 | 15.0 | 0.5 | 15.0 | 15.0 | 0.49 | 2.1 | 13.8 | 10.6 | 14.2 | 0.65 | 2.3 | 11.6 | 10.6 | 13.8 | 0.67 | 2.4 | 11.6 | |||
| 15.0 | 10.0 | 0.5 | 15.0 | 9.9 | 0.49 | 2.4 | 12.1 | 10.3 | 10.8 | 0.67 | 2.4 | 10.1 | 10.4 | 10.7 | 0.68 | 2.5 | 10.1 | |||
| 15.0 | 5.0 | 0.5 | 15.0 | 5.0 | 0.50 | 2.9 | 9.0 | 10.1 | 7.0 | 0.74 | 2.8 | 7.8 | 10.2 | 7.1 | 0.76 | 2.8 | 7.8 | |||
| 10.0 | 10.0 | 0.5 | 10.0 | 10.0 | 0.49 | 2.0 | 9.3 | 7.5 | 9.3 | 0.67 | 2.3 | 7.9 | 7.1 | 9.8 | 0.70 | 2.5 | 8.0 | |||
| 10.0 | 5.0 | 0.5 | 10.0 | 5.0 | 0.50 | 2.2 | 7.0 | 7.2 | 5.8 | 0.68 | 2.5 | 6.2 | 7.1 | 5.9 | 0.70 | 2.5 | 6.2 | |||
| 10.0 | 2.5 | 0.5 | 10.0 | 2.5 | 0.50 | 2.8 | 5.3 | 7.2 | 3.9 | 0.77 | 2.9 | 4.7 | 7.3 | 3.9 | 0.77 | 2.9 | 4.7 | |||
| 5.0 | 5.0 | 0.5 | 5.0 | 5.0 | 0.50 | 2.1 | 4.9 | 3.9 | 4.8 | 0.70 | 2.6 | 4.1 | 3.7 | 5.1 | 0.70 | 2.7 | 4.1 | |||
| 5.0 | 2.5 | 0.5 | 5.0 | 2.5 | 0.50 | 2.1 | 3.6 | 3.9 | 2.9 | 0.70 | 2.5 | 3.2 | 4.0 | 2.9 | 0.72 | 2.6 | 3.2 | |||
| 5.0 | 1.0 | 0.5 | 5.0 | 1.0 | 0.50 | 2.2 | 2.6 | 4.2 | 1.6 | 0.76 | 2.9 | 2.2 | 4.0 | 1.8 | 0.80 | 2.9 | 2.3 | |||
| 15.0 | 15.0 | 0.9 | 14.7 | 15.1 | 0.90 | 3.5 | 14.5 | 10.9 | 13.8 | 0.87 | 3.2 | 12.7 | 9.3 | 14.2 | 0.91 | 3.3 | 12.7 | |||
| 15.0 | 10.0 | 0.9 | 15.0 | 10.0 | 0.90 | 3.6 | 10.3 | 9.2 | 9.8 | 0.89 | 3.2 | 9.3 | 7.1 | 10.3 | 0.92 | 3.4 | 9.4 | |||
| 15.0 | 5.0 | 0.9 | 15.0 | 5.0 | 0.90 | 3.9 | 5.7 | 7.6 | 5.1 | 0.91 | 3.4 | 5.3 | 4.8 | 5.6 | 0.96 | 3.7 | 5.5 | |||
| 10.0 | 10.0 | 0.9 | 10.0 | 10.0 | 0.90 | 3.5 | 9.8 | 6.4 | 10.2 | 0.89 | 3.3 | 9.0 | 5.3 | 10.5 | 0.90 | 3.5 | 9.1 | |||
| 10.0 | 5.0 | 0.9 | 10.0 | 5.0 | 0.90 | 3.6 | 5.4 | 6.3 | 5.0 | 0.89 | 3.3 | 5.1 | 4.3 | 5.5 | 0.93 | 3.6 | 5.2 | |||
| 10.0 | 2.5 | 0.9 | 10.0 | 2.5 | 0.90 | 3.8 | 3.0 | 5.2 | 2.7 | 0.93 | 3.6 | 2.9 | 6.4 | 2.7 | 0.95 | 3.7 | 2.9 | |||
| 5.0 | 5.0 | 0.9 | 5.0 | 5.0 | 0.90 | 3.6 | 4.9 | 4.6 | 4.8 | 0.88 | 3.3 | 4.6 | 3.8 | 5.0 | 0.90 | 3.5 | 4.7 | |||
| 5.0 | 2.5 | 0.9 | 5.0 | 2.5 | 0.90 | 3.5 | 2.7 | 3.9 | 2.5 | 0.89 | 3.3 | 2.7 | 4.1 | 2.5 | 0.91 | 3.4 | 2.7 | |||
| 5.0 | 1.0 | 0.9 | 5.0 | 1.0 | 0.90 | 3.5 | 1.3 | 3.4 | 1.1 | 0.94 | 3.7 | 1.2 | 4.0 | 1.0 | 0.94 | 3.6 | 1.3 | |||
3.8. Stacking bulge+disk galaxies
The composite-type galaxies are commonly composed of two distinct Srsic components, i.e., bulge+disk. We generate bulge+disk galaxy models to test the recovery of structural parameters through stacking such objects. We assume that bulges are classical (i.e., de Vaucouleurs type with ) and disks are exponential (), as often used in morphological studies of high- galaxies (e.g., Bruce et al., 2012; Lang et al., 2014). The effective radius of the bulges is set not to be larger than the effective radius of the disks . Here we adopt =[5,10,15] pixels and is chosen accordingly, as listed in Table 2. A new parameter bugle-to-total light ratio () is used to measure the fraction between the two components in a galaxy. The is set to be 0.1, 0.2, 0.25, 0.375, 0.5, 0.625, 0.75, 0.8 and 0.9.
We firstly fit the 1-D profiles of individual noise-free bulge+disk models with single Srsic profiles, selecting the recovered profiles of best-fit parameters and . Meanwhile, we also obtain the corresponding single Srsic profiles best fitting the 1-D profiles of the bulge+disk models without PSF convolution using the method presented in Section 2.3. The best-fit profiles to the PSF-free models are taken as the reference profiles. Here =1 is adopted for all galaxy models. We do not include noises in these bulge+disk decomposition exercises in order to test how well the actual parameters of bulge+disk models can be derived from the 1-D profile fitting. Secondly, we examine the estimate of structural parameters through stacking bulge+disk models with spreads in and counted only for the disk component, aiming at addressing how the recovered structural parameters depend on the input model parameters. We stack images of bulge+disk models of given (, , ) with spreads in and . The spread in Section 3.2 and the spread of for late-type galaxies in Section 3.3 are adopted. Thirdly, the spread of for the bulge component and the and spreads for the disk component are taken into account in stacking bulge+disk models of given (, , ). Similarly, the best-fit Srsic profile to the 1-D profile of the stacked image is taken as the recovered profile and the reference profile is obtained from the best-fit profile with removal of noise and PSF effect. Table 2 presents the recovered structural parameters in above three cases for three representative values 0.1, 0.5 and 0.9. These stacking processes deal with the model galaxy images with photon noise and background included to match the actual observations.
| Input Parameters | Recovered Parameters | |||||||||||||||||||
| Individual bulge+disk models | Stacks with & | Stacks with , & | ||||||||||||||||||
| 15.0 | 15.0 | 0.1 | 14.9 | 20.0 | 0.07 | 1.1 | 14.8 | 10.9 | 14.3 | 0.44 | 1.8 | 11.3 | 10.9 | 13.8 | 0.44 | 1.8 | 11.2 | |||
| 15.0 | 10.0 | 0.1 | 14.7 | 14.5 | 0.09 | 1.2 | 14.3 | 10.5 | 14.3 | 0.45 | 1.8 | 11.0 | 10.7 | 13.3 | 0.45 | 1.8 | 10.9 | |||
| 15.0 | 5.0 | 0.1 | 14.6 | 7.9 | 0.12 | 1.4 | 13.3 | 10.0 | 13.1 | 0.50 | 1.9 | 10.4 | 10.1 | 13.0 | 0.51 | 1.9 | 10.4 | |||
| 10.0 | 10.0 | 0.1 | 10.0 | 11.7 | 0.07 | 1.1 | 9.9 | 7.6 | 8.5 | 0.43 | 1.7 | 7.5 | 7.6 | 8.4 | 0.43 | 1.7 | 7.5 | |||
| 10.0 | 5.0 | 0.1 | 9.8 | 6.1 | 0.09 | 1.2 | 9.3 | 7.4 | 7.4 | 0.43 | 1.7 | 7.1 | 7.4 | 7.5 | 0.44 | 1.8 | 7.1 | |||
| 10.0 | 2.5 | 0.1 | 9.8 | 3.6 | 0.12 | 1.3 | 8.6 | 7.3 | 6.5 | 0.48 | 1.9 | 6.8 | 7.3 | 6.6 | 0.49 | 1.9 | 6.8 | |||
| 5.0 | 5.0 | 0.1 | 5.1 | 4.1 | 0.07 | 1.1 | 5.0 | 4.2 | 3.8 | 0.48 | 1.8 | 3.9 | 4.2 | 3.8 | 0.49 | 1.8 | 3.9 | |||
| 5.0 | 2.5 | 0.1 | 5.0 | 1.7 | 0.07 | 1.1 | 4.7 | 4.0 | 3.5 | 0.48 | 1.8 | 3.7 | 4.1 | 3.3 | 0.49 | 1.8 | 3.7 | |||
| 5.0 | 1.0 | 0.1 | 5.0 | 0.9 | 0.10 | 1.2 | 4.4 | 4.0 | 3.0 | 0.55 | 2.0 | 3.4 | 4.0 | 3.0 | 0.54 | 2.0 | 3.4 | |||
| 15.0 | 15.0 | 0.5 | 14.5 | 20.0 | 0.36 | 1.6 | 14.4 | 11.3 | 16.0 | 0.52 | 2.0 | 12.3 | 11.2 | 15.9 | 0.56 | 2.0 | 12.2 | |||
| 15.0 | 10.0 | 0.5 | 13.4 | 12.5 | 0.39 | 1.8 | 12.1 | 10.3 | 11.7 | 0.52 | 2.0 | 10.3 | 10.2 | 11.9 | 0.56 | 2.0 | 10.3 | |||
| 15.0 | 5.0 | 0.5 | 12.6 | 6.3 | 0.50 | 2.3 | 8.7 | 8.1 | 7.8 | 0.65 | 2.3 | 7.5 | 8.3 | 7.7 | 0.67 | 2.4 | 7.6 | |||
| 10.0 | 10.0 | 0.5 | 10.0 | 11.5 | 0.35 | 1.6 | 9.8 | 8.2 | 9.9 | 0.55 | 2.0 | 8.3 | 8.1 | 9.8 | 0.57 | 2.0 | 8.2 | |||
| 10.0 | 5.0 | 0.5 | 8.9 | 5.2 | 0.39 | 1.8 | 7.0 | 6.7 | 6.0 | 0.55 | 2.0 | 6.1 | 6.8 | 5.9 | 0.57 | 2.1 | 6.1 | |||
| 10.0 | 2.5 | 0.5 | 8.8 | 2.9 | 0.52 | 2.4 | 5.1 | 5.3 | 4.2 | 0.72 | 2.5 | 4.4 | 5.8 | 4.0 | 0.72 | 2.6 | 4.5 | |||
| 5.0 | 5.0 | 0.5 | 5.3 | 4.6 | 0.35 | 1.7 | 5.0 | 4.5 | 4.5 | 0.58 | 2.1 | 4.3 | 4.5 | 4.5 | 0.60 | 2.1 | 4.3 | |||
| 5.0 | 2.5 | 0.5 | 4.8 | 1.7 | 0.33 | 1.7 | 3.6 | 3.7 | 2.8 | 0.58 | 2.1 | 3.1 | 3.7 | 2.9 | 0.61 | 2.2 | 3.2 | |||
| 5.0 | 1.0 | 0.5 | 4.7 | 0.9 | 0.50 | 2.1 | 2.5 | 3.5 | 1.6 | 0.77 | 2.7 | 2.1 | 3.6 | 1.6 | 0.77 | 2.8 | 2.1 | |||
| 15.0 | 15.0 | 0.9 | 13.6 | 19.4 | 0.63 | 2.3 | 14.8 | 12.2 | 17.4 | 0.62 | 2.2 | 13.6 | 11.8 | 17.3 | 0.68 | 2.4 | 13.7 | |||
| 15.0 | 10.0 | 0.9 | 10.9 | 11.7 | 0.65 | 2.4 | 10.4 | 9.9 | 10.7 | 0.62 | 2.2 | 9.7 | 9.3 | 11.5 | 0.69 | 2.4 | 9.8 | |||
| 15.0 | 5.0 | 0.9 | 8.1 | 4.7 | 0.67 | 2.6 | 5.6 | 6.1 | 5.2 | 0.66 | 2.3 | 5.4 | 5.8 | 5.6 | 0.73 | 2.6 | 5.4 | |||
| 10.0 | 10.0 | 0.9 | 9.9 | 11.5 | 0.63 | 2.3 | 9.9 | 9.3 | 10.5 | 0.63 | 2.2 | 9.3 | 9.0 | 10.6 | 0.68 | 2.4 | 9.3 | |||
| 10.0 | 5.0 | 0.9 | 7.1 | 4.7 | 0.64 | 2.4 | 5.4 | 5.9 | 5.0 | 0.64 | 2.2 | 5.2 | 5.7 | 5.3 | 0.70 | 2.4 | 5.2 | |||
| 10.0 | 2.5 | 0.9 | 5.3 | 2.1 | 0.73 | 2.7 | 2.9 | 3.7 | 2.4 | 0.70 | 2.4 | 2.8 | 3.7 | 2.5 | 0.74 | 2.6 | 2.8 | |||
| 5.0 | 5.0 | 0.9 | 5.9 | 4.6 | 0.61 | 2.3 | 5.0 | 5.4 | 4.7 | 0.64 | 2.3 | 4.8 | 5.1 | 5.0 | 0.70 | 2.5 | 4.8 | |||
| 5.0 | 2.5 | 0.9 | 4.4 | 1.7 | 0.60 | 2.3 | 2.7 | 3.5 | 2.1 | 0.63 | 2.2 | 2.7 | 3.5 | 2.3 | 0.70 | 2.4 | 2.7 | |||
| 5.0 | 1.0 | 0.9 | 3.2 | 0.7 | 0.79 | 2.8 | 1.2 | 1.8 | 0.9 | 0.73 | 2.5 | 1.2 | 2.1 | 0.9 | 0.79 | 2.7 | 1.2 | |||
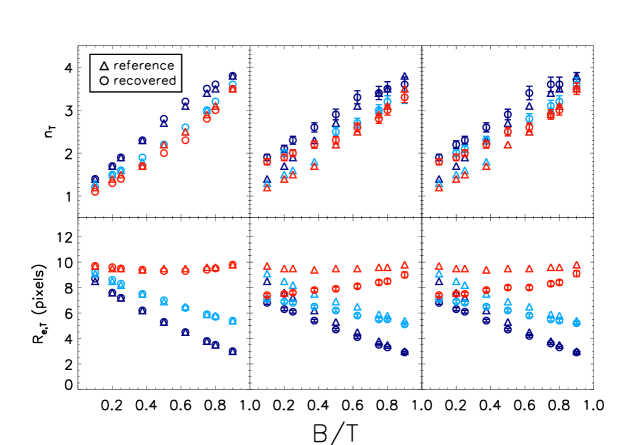
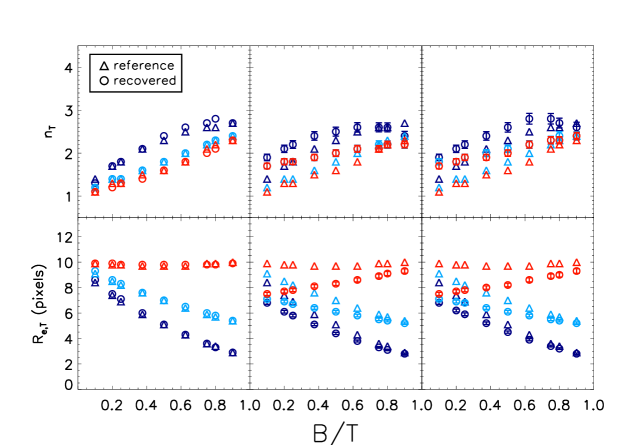
Figure 12 presents the measured global structural parameters and as functions of and the ratio of to . We point out that the relationships between these parameters are similar for =5, 10 or 15 pixels and we thus only show the results at pixels. it is clear that the global Srsic index is not only tightly correlated with and but also affected by the sizes of disk and bulge components for individual bulge+disk models (the left panels). We notice that the ratio / has an effect on because larger (relatively bigger bulge) tends to lower (see also Lang et al., 2014). On the other hand, the global effective radius is sensitive to both the ratio and , and approximately equals to the light-weighted combination of and . When the bulge+disk models are dominated by one component (disk or bulge), the recovered structural parameters are close to these of the dominant component. The recovered profiles (with PSF) are compared with the corresponding reference profiles (without PSF) to examine the PSF effect. The two sets of structural parameters agree well with each other, indicating that the global structural parameters of the composite-type galaxies can be properly recovered using the method of 1-D profile fitting as PSF effect has little influence on the recovery of the structural parameters.
The middle panels of Figure 12 shows and recovered from the stacked profiles of bulge+disk models with spreads in and included. We can see that the recovered and exhibit significant deviations from those presented in the left panels at ; when the disk component increasingly dominates the total light, is increasingly overestimated and is more underestimated, and thus the recovered profile appears to be more compact, suggesting that it is the and spreads of the disk component causing the deviations in and , in particular at . These are consistent with the results in Section 3.4. Similarly, the right panels of Figure 12 shows and recovered from the stacked profiles of bulge+disk models accounting for spreads in and and (right). No significant difference is found from the middle panels, indicating that the bulge size spread marginally affects the estimate of global structural parameters.
3.9. Dual-Srsic Profile Fitting
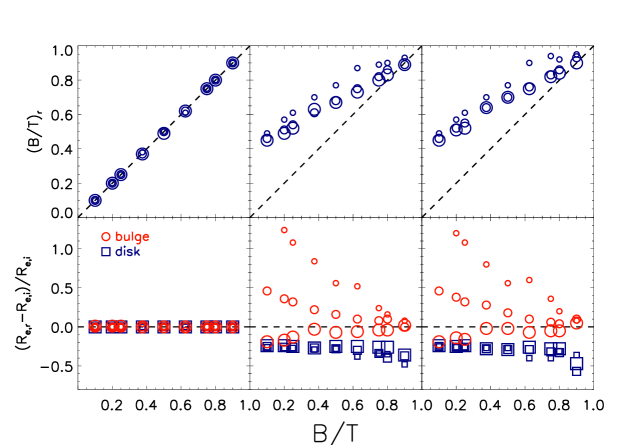
Resolving high- galaxies into bulge and disk components even in a statistical sense is key to drawing an empirical picture for bulge growth. Here we test the recovery of the structural parameters of the two components through fitting the global 1-D profile of a stacked image with bulge+disk composite profiles. We test this method and see how the measurements rely on the parameters of galaxy models for stacking. In our two-component fitting, we fix Srsic index for the bulge (=4) and the disk (=1). Again, the models presented in Table 2 are used in our simulations. The best fitting is selected using the least squares method across parameter space of , , and . The best-fit dual-Srsic profile provides the recovered structural parameters , , and as the bulge and disk component of a target. The results of the dual-Srsic profile fitting are shown in Table 2, in comparison with the input model parameters when =0.1, 0.5 and 0.9.
The left panel of Figure 13 shows the results of dual-Srsic fitting to the 1-D profile of individual bulge+disk models. with pixels and =[10, 5, 2.5] pixels. Note that the results are not dependent on . One can see that the three key structural parameters , and can be properly recovered using the method of dual-Srsic profile fitting.
Accounting the spreads of and for the disk component of bulge+disk models, we derive the structural parameters of the bulge and disk component of the stacked image of the models through dual-Srsic profile fitting and show the results in the middle panel of Figure 13. Clearly, the and spreads affect the recovery of the structural parameters of the two components. While the average size of the disk component is systematically underestimated by about 20%, independent from , the average size of the bulge component is increasingly overestimated at decreasing , particularly for lower . The is increasingly overestimated at decreasing . These biases in recovering the structural parameters are obviously caused by the inclined disks in stacking. The degree of bias in is strongly dependent on the intrinsic but free from .
Along with the spreads of and added to disks, the spread in bulge is also included in stacking of bulge+disk models. The right panel of Figure 13 presents the recovered structural parameters using the method of dual-Srsic fitting to the global 1-D profile of the stacked model image. Again, the recovered structural parameters deviate from the input ones. The deviations of , and are similar to what given in the middle panel of Figure 13, suggesting that the bulge spread has little influence on the estimate of the averaged structural parameters of the stacked bulge+disk models. And the biases in and are mainly caused by the and spreads of the disk component.
3.10. Measurements of pseudo-bulges
Not all bulges are classical type with a Srsic index of =4. In fact, many bulges with smaller Srsic indices in the local universe are recognized as pseudo bulges and thought to be built up through secular evolution (e.g., Graham, 2001; Balcells et al., 2003; Kormendy & Kennicutt, 2004, and references therein). For high- galaxies, the bulges formed through inward migration of disk clumps are expected to differ from the classical ones which are usually formed via mergers (e.g., Bournaud et al., 2007). Since the pseudo bulges are less distinct from disks compared to the classical bulges, it is important to examine how the global properties depend on the model parameters and to what degree the pseudo bulge component can be resolved through a dual-Srsic profile fitting to a 1-D surface brightness profile. We therefore repeat the simulations in Section 3.8 but set =2.5 for the bulge component.
Again, we derive global structural parameters and by fitting single Srsic profiles to the simulated profiles in three cases: individual pseudo bulge+disk models, stacking of pseudo bulge+disk models with and spreads added to the disk component, and stacking of such models with spread added to the bulge component and and spreads added to the disk component. Table 3 lists the results only for . Figure 14 shows recovery results of the global structural parameters. Similar to those present in Figure 12: the recovered global increases from 1 to 2.5 as increases from 0 to 1; when is fixed, a lower ratio generally leads to be slightly higher; the global size can be approximately seen as the light-weighted combination of and ; the recovered parameters agree well with the reference parameters ( triangles) derived from the PSF-free models; the and spreads of the disk component leaves the global Srsic index increasingly overestimated and the global size increasingly underestimated at decreasing ; the spread of the pseudo bulge component has insignificant influence to the global structural parameters.
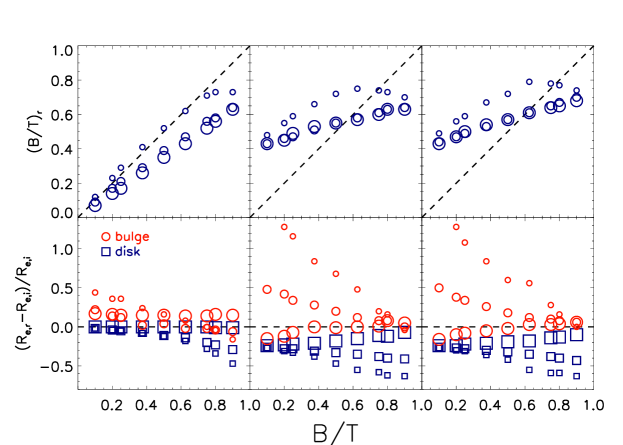
We point out that fitting the stacked profiles of pseudo-bulge+disk models with dual-Srsic profile results in similar results for classical bulge+disk models presented in Figure 13 if the two Srsic profiles have for one (disk) and for the other (pseudo bulge). Moreover, it is interesting to see how the recovery of structural parameters are affected when is adopted as the bulge component in the dual-Srsic profile fitting. Accordingly, the recovered , and as a function of input are presented in Figure 15, for individual pseudo bulge+disk models, stacking of these models with the spreads of and included into the disk component, and stacking of these models with spread counted for the disk component and spread for both components, respectively.
When the pseudo-bulge in the pseudo bulge+disk models is mistaken as a classical one, the bulge+disk decomposition ends up with an increasing underestimate of (also and ) with increasing input . This is understandable in that the pseudo bulge component is divided into a classical bulge and an additional disk. At , the additional disk biases the recovered smaller. Taking the spreads of and into account, the recovery of the averaged structural parameters of , and from the stacked profile of pseudo bulge+disk models is further affected mainly by the and spreads of the disk, as described in Section 3.9.
4. SUMMARY
Stacking technique is a powerful tool to probe signals under the detection limit of individual images for faint galaxies and enable us to obtain the averaged surface brightness profile toward larger radii. We carried out simulations to test the stacking of galaxy models with spreads in axis ratio (; elongation or inclination) and effective radius () counted, and to explore how the recovered structural parameters of the averaged surface brightness profile depend on the effective radius (), axis ratio (), index of Srsic profile () of the models and their spreads. We also addressed the recovery of averaged structural parameters through stacking bulge+disk models in order to simulate the real observations.
In our simulations, we use circular apertures to derive surface brightness profile of a galaxy image. This is the usual way for stacking of faint high- galaxies, whose structural parameters are barely known so that corrections for inconsistence in inclination, orientation and size are often ignored. Following Szomoru et al. (2012), we fit the one-dimensional (1-D) radial surface brightness profile of a stacked galaxy image with a library of 1-D Srsic profiles to obtain the best-fit profile using the method of least squares. The best-fit profile is taken as the intrinsic profile for the stacked image. Galaxy models used in our simulations have structural parameters spanning sufficiently wide ranges: , and .
We examined 1) the dependence of the measured surface brightness profile solely on each parameter of and ; 2) the recovery of structural parameters of the mean surface brightness profile when a set of galaxy models for stacking have two parameters fixed and the third parameter spreading within a certain distribution; 3) the recovery of structural parameters of the mean surface brightness profile of galaxy models with spreads counted in both and as functions of and mean effective radius ; 4) the recovery of structural parameters of the mean surface brightness profile of galaxy models with spreads added to all parameters, including , and , for late-type and early-type galaxies; 5) the fitting of the stacked profile of bulge+disk models with both single Srsic profiles and dual-Srsic profiles to see to which extent the stacking can recover the averaged structural parameters of a galaxy population.
The striking results from our simulations are that the structural parameters and of the mean-stacked image of a group of galaxies may be biased up to 70% by spreads in and , much dependent on the distribution functions of the spreads; the bias can be quantitatively corrected once the spread functions are known. We summarize our results as follows:
-
•
The spread in leads the mean-stacked image of a group galaxies to appear more compact, i.e., with a lower mean effective radius and a higher . The inclusion of highly-inclined (or elongated) galaxies with low in stacks biases the recovered and .
-
•
For early-type galaxies with large Srsic index , which have extended halos in the outskirts, the oversubtraction of background biases the estimate of structural parameters. The mean Srsic index may be underestimated, and the effective radius may be underestimated for early-type galaxies with large sizes. This indicates that the estimation of background is very important for the estimation of structural parameters, especially for early-type galaxies which have extended halos in the outskirts.
-
•
Accounting for the spread of local disk galaxies from Padilla & Strauss (2008) in stacking galaxies with , the median effective radius of the stacked galaxies is underestimated by 23% and the mean Srsic index is overestimated by up to 20%. Similarly, the spread of local early-type galaxies from Hao et al. (2006) in stacking galaxies with leads to an underestimate of 12% in and little influence on the estimate of .
-
•
The spread in plays a different role from that of the spread in , which leads the mean-stacked profile of galaxies to be more concentrated. Taking the log-normal distribution of from Shen et al. (2003) into account, is not biased for either early-type or late-type galaxies, and Srsic index is overestimated by 50% for the late-type galaxies but not significantly biased for the early-type galaxies. When scatters within a spread, the stacked galaxies with a size smaller than the median contribute more to the central part of the integrated light, and those with a size larger than the median contribute more to the extended wing, resulting in a mean-stacked profile with a higher Srsic index and an effective radius equal to the median of the spread.
-
•
The effects of the spreads in and are linearly co-added on the estimate of structural parameters of a stacked image. The actual corrections for these effects rely on the spread functions.
-
•
Account for the spread of with a uniform distribution, we find that the recovered structural parameters remain unchanged compared with these derived with no spread in counted, suggesting that the spread of does not significantly effect on the stacked results.
-
•
In stacking analysis, the galaxies are often classified by the stellar mass and type, and the , and all have spreads. In this case, we find that the effective radius can be underestimated by 20% to 27% for late-type galaxies, and only 10% to 15% for early-type galaxies, due to the distribution of galaxies. The Srsic index can be well recovered for early-type galaxies, but can be overestimated for late-type galaxies due to both the and distribution.
-
•
For faint galaxies, the center we find will have an offset to the real center of galaxies due to the noise. We also test this effect by stacking galaxies by using the real center instead of the center found by Sextractor. We find that for galaxies in the range mag, the 68% percentile of the centering offset is not more than 1 pixel and does not influence the results.
-
•
Recovery of structural parameters of bulge+disk galaxies are regulated by the bugle-to-total ratio , the ratio of the two components and the Srsic index of the bulge if the disk is exponential (). The global Srsic index mainly depends on Srsic index of the bulge and . The global effective radius can be approximately seen as the light-weighted combination of bulge size and disk size. And the ratio also has influence on at a second-order level. The and spreads of the disks and the spread of the bulges lead to be increasingly overestimated and to be increasingly underestimated at decreasing .
-
•
By dual-Srsic profile fitting to the stacked profile of bulge+disk galaxies, the averaged structural parameters of the bulge and disk components can be determined although the uncertainties are large. The and spreads of disks is the main cause of the increasing overestimate of (also ) at decreasing intrinsic . The issue of the bulges to be pseudo or classical would dramatically change the results of the dual-Srsic profile fitting for a composite profile. We caveat that the measurement of bulge growth in a statistical sense is significantly affected by the and spreads of the disks and Srsic index of the bulges in the bulge+disk decomposition through stacking. We thus stress that interpretation of stacking results should take these biases into account and the corrections for the biases are strongly dependent on the structural parameters of stacked galaxies and the spread functions of them.
References
- Balcells et al. (2003) Balcells, M., Graham, A. W., & Palmero, L. D. 2003, ApJ, 582L, 79
- Baldry et al. (2004) Baldry, I. K., Glazebrook, K., Brinkmann, J., et al. 2004, ApJ, 600, 681
- Bertin & Arnouts (1996) Bertin, E., & Arnouts, S. 1996, A&AS, 117, 393
- Häussler et al. (2007) Häussler, B., McIntosh, D. H., Barden, M., et al. 2007, ApJS, 172, 615
- Belli et al. (2014) Belli, S., Newman, A. B., & Ellis, R. S. 2014, ApJ, 783, 117
- Bezanson et al. (2009) Bezanson, R., van Dokkum, P. G., Tal, T., et al. 2009, ApJ, 697, 1290
- Blanton et al. (2005) Blanton, M. R., Eisenstein, D., Hogg, D. W., Schlegel, D. J., & Brinkmann, J. 2005, ApJ, 629, 143
- Blanton & Moustakas (2009) Blanton, M. R., & Moustakas, J. 2009, ARA&A, 47, 159
- Bournaud et al. (2007) Bournaud, F., Elmegreen, B. G., & Elmegreen, D. M. 2007, ApJ, 670, 237
- Bourne et al. (2012) Bourne, N., Maddox, S. J., Dunne, L., et al. 2012, MNRAS, 421, 3027
- Brammer et al. (2011) Brammer, G. B., Whitaker, K. E., van Dokkum, P. G., et al. 2011, ApJ, 739, 24
- Brinchmann et al. (2004) Brinchmann, J., Charlot, S., White, S. D. M., et al. 2004, MNRAS, 351, 1151
- Bruce et al. (2012) Bruce, V. A., Dunlop, J. S., Cirasuolo, M., et al. 2012, MNRAS, 427,1666
- Bundy et al. (2006) Bundy, K., Ellis, R. S., Conselice, C. J., et al. 2006, ApJ, 651, 120
- Cattaneo et al. (2006) Cattaneo, A., Dekel, A., Devriendt, J., Guiderdoni, B., & Blaizot, J. 2006, MNRAS, 370, 1651
- Conselice (2014) Conselice, C. J. 2014, ARA&A, 52, in press [arXiv:1403.2783]
- Damjanov et al. (2011) Damjanov, I., Abraham, R. G., Glazebrook, K., et al. 2011, ApJ, 739, L44
- Dekel & Birnboim (2006) Dekel, A., & Birnboim, Y. 2006, MNRAS, 368, 2
- Erb et al. (2006) Erb, D. K., Shapley, A. E., Pettini, M., et al. 2006, ApJ, 644, 813
- Fan et al. (2010) Fan, L., Lapi, A., Bressan, A., et al. 2010, ApJ, 718, 1460
- Ferguson & Binggeli (1994) Ferguson, H. C., & Binggeli, B. 1994, A&A Rev., 6, 67
- Gabor & Davé (2012) Gabor, J. M., & Davé, R. 2012, MNRAS, 427, 1816
- Garn & Alexander (2009) Garn, T., & Alexander, P. 2009, MNRAS, 394, 105
- Graham (2001) Graham, A. W. 2001, AJ, 121, 820
- Grogin et al. (2011) Grogin, N. A., Kocevski, D. D., Faber, S. M., et al. 2011, ApJS, 197, 35
- Guo & White (2008) Guo, Q., & White, S. D. M. 2008, MNRAS, 384, 2
- Guo et al. (2013) Guo, K., Zheng, X. Z., & Fu, H. 2013, ApJ, 778, 23
- Hancock et al. (2011) Hancock, P. P., Gaensler, B. M., & Murphy, T. 2011, ApJ, 735, L35
- Hao et al. (2006) Hao, C. N., Mao, S., Deng, Z. G., Xia, X. Y., & Wu, H. 2006, MNRAS, 370, 1339
- Hilz et al. (2013) Hilz, M., Naab, T., & Ostriker, J. P. 2013, MNRAS, 429, 2924
- Hopkins et al. (2010) Hopkins, P. F., Bundy, K., Hernquist, L., Wuyts, S., & Cox, T. J. 2010, MNRAS, 401, 1099
- Kauffmann et al. (2003) Kauffmann, G., Heckman, T. M., White, S. D. M., et al. 2003, MNRAS, 341, 54
- Kaviraj (2010) Kaviraj, S. 2010, MNRAS, 408, 170
- Koekemoer et al. (2007) Koekemoer, A. M., Aussel, H., Calzetti, D., et al. 2007, ApJS, 172, 196
- Kormendy & Bender (2012) Kormendy, J., & Bender, R. 2012, ApJS, 198, 2
- Kormendy & Kennicutt (2004) Kormendy, J., & Kennicutt, R. C., Jr. 2004, ARA&A, 42, 603
- Krogager et al. (2013) Krogager, J.-K., Zirm, A. W., Toft, S., Man, A., & Brammer, G. 2013, ArXiv e-prints
- Lang et al. (2014) Lang, P., Wuyts, S., Somerville, R. S. 2014, ApJ, 788, 11
- Law et al. (2012) Law, D. R., Steidel, C. C., Shapley, A. E., et al. 2012, ApJ, 745, 85
- Lee et al. (2010) Lee, N., Le Floc’h, E., Sanders, D. B., et al. 2010, ApJ, 717, 175
- Lotz et al. (2011) Lotz, J. M., Jonsson, P., Cox, T. J., et al. 2011, ApJ, 742, 103
- Mancini et al. (2010) Mancini, C., Daddi, E., Renzini, A., et al. 2010, MNRAS, 401, 933
- Naab et al. (2009) Naab, T., Johansson, P. H., & Ostriker, J. P. 2009, ApJ, 699, L178
- Naab et al. (2007) Naab, T., Johansson, P. H., Ostriker, J. P., & Efstathiou, G. 2007, ApJ, 658, 710
- Napolitano et al. (2010) Napolitano, N. R., Romanowsky, A. J., & Tortora, C. 2010, MNRAS, 405, 2351
- Newman et al. (2012) Newman, A. B., Ellis, R. S., Bundy, K., & Treu, T. 2012, ApJ, 746, 162
- Oser et al. (2012) Oser, L., Naab, T., Ostriker, J. P., & Johansson, P. H. 2012, ApJ, 744, 63
- Oser et al. (2010) Oser, L., Ostriker, J. P., Naab, T., Johansson, P. H., & Burkert, A. 2010, ApJ, 725, 2312
- Padilla & Strauss (2008) Padilla, N. D., & Strauss, M. A. 2008, MNRAS, 388, 1321
- Papovich et al. (2011) Papovich, C., Finkelstein, S. L., Ferguson, H. C., Lotz, J. M., & Giavalisco, M. 2011, MNRAS, 412, 1123
- Peng et al. (2010) Peng, Y.-j., Lilly, S. J., Kovač, K., et al. 2010, ApJ, 721, 193
- Rix et al. (2004) Rix, H.-W., Barden, M., Beckwith, S. V. W., et al. 2004, ApJS, 152, 163
- Scoville et al. (2007b) Scoville, N., Aussel, H., Brusa, M., et al. 2007b, ApJS, 172, 1
- Shankar et al. (2013) Shankar, F., Marulli, F., Bernardi, M., et al. 2013, MNRAS, 428, 109
- Shapley (2011) Shapley, A. E. 2011, ARA&A, 49, 525
- Shen et al. (2003) Shen, S., Mo, H. J., White, S. D. M., et al. 2003, MNRAS, 343, 978
- Shen et al. (2007) Shen, S., Mo, H. J., White, S. D. M., et al. 2007, MNRAS, 379, 400
- Simard et al. (2011) Simard, L., Mendel, J. T., Patton, D. R., Ellison, S. L., & McConnachie, A. W. 2011, ApJS, 196, 11
- Szomoru et al. (2012) Szomoru, D., Franx, M., & van Dokkum, P. G. 2012, ApJ, 749, 121
- Tal & van Dokkum (2011) Tal, T., & van Dokkum, P. G. 2011, ApJ, 731, 89
- Toft et al. (2007) Toft, S., van Dokkum, P., Franx, M., et al. 2007, ApJ, 671, 285
- Tomczak et al. (2014) Tomczak, A. R., Quadri, R. F., Tran, K.-V. H., et al. 2014, ApJ, 783, 85
- Tremonti et al. (2004) Tremonti, C. A., Heckman, T. M., Kauffmann, G., et al. 2004, ApJ, 613, 898
- Trujillo et al. (2007) Trujillo, I., Conselice, C. J., Bundy, K., et al. 2007, MNRAS, 382, 109
- Trujillo et al. (2006) Trujillo, I., Förster Schreiber, N. M., Rudnick, G., et al. 2006, ApJ, 650, 18
- Trujillo et al. (2011) Trujillo, I., Ferreras, I., & de La Rosa, I. G. 2011, MNRAS, 415, 3903
- van der Wel et al. (2014) van der Wel, A., Franx, M., van Dokkum, P. G., et al. 2014, ApJ, 788, 28
- van der Wel et al. (2008) van der Wel, A., Holden, B. P., Zirm, A. W., et al. 2008, ApJ, 688, 48
- van der Wel et al. (2011) van der Wel, A., Rix, H.-W., Wuyts, S., et al. 2011, ApJ, 730, 38
- van Dokkum & Brammer (2010) van Dokkum, P. G., & Brammer, G. 2010, ApJ, 718, L73
- van Dokkum et al. (2008) van Dokkum, P. G., Franx, M., Kriek, M., et al. 2008, ApJ, 677, L5
- van Dokkum et al. (2010) van Dokkum, P. G., Whitaker, K. E., Brammer, G., et al. 2010, ApJ, 709, 1018
- White et al. (2007) White, R. L., Helfand, D. J., Becker, R. H., Glikman, E., & de Vries, W. 2007, ApJ, 654, 99
- Williams et al. (2010) Williams, R. J., Quadri, R. F., Franx, M., et al. 2010, ApJ, 713, 738
- Wuyts et al. (2011) Wuyts, S., Förster Schreiber, N. M., van der Wel, A., et al. 2011, ApJ, 742, 96
- Wuyts et al. (2010) Wuyts, S., Cox, T. J., Hayward, C. C., et al. 2010, ApJ, 722, 1666
- Zheng et al. (2006) Zheng, X. Z., Bell, E. F., Rix, H.-W., et al. 2006, ApJ, 640, 784
- Zheng et al. (2007) Zheng, X. Z., Dole, H., Bell, E. F., et al. 2007, ApJ, 670, 301
- Zibetti et al. (2004) Zibetti, S., White, S. D. M., & Brinkmann, J. 2004, MNRAS, 347, 556
- Zibetti et al. (2005) Zibetti, S., White, S. D. M., Schneider, D. P., & Brinkmann, J. 2005, MNRAS, 358, 949
- Zirm et al. (2007) Zirm, A. W., van der Wel, A., Franx, M., et al. 2007, ApJ, 656, 66