Abstract
In Jupiter’s stratosphere, gaseous carbon monosulfide (CS) was first discovered in 1994 by millimeter and ultraviolet observations as a product induced by the collision of comet Shoemaker-Levy 9 (SL9). To constrain sulfur chemistry, in 2013, 19 years after the SL9 event, we observed Jupiter’s stratospheric CS =7 – 6 rotational transition at 0.8 mm wavelength by using the Atacama Submillimeter Telescope Experiment (ASTE) 10-m single dish telescope. The CS molecular line was successfully detected with 120 mK intensity in the antenna temperature scale. The CS total mass shows 90 decrease relative to that observed in 1998. From the line shape analysis, CS is suggested to be present above the 0.2 mbar pressure level, which is comparable to that of determined in 1998.
1 Background
is considered to have affected the stratospheric composition of all four gas giant planets. On Jupiter, the 1994 collision of the fragments of comet Shoemaker-Levy 9 (referred to as the SL9 event) caused the delivery of volatile gases such as CO, HCN, \ceH2O, \ceS2, \ceH2S, OCS, \ceCS2 and CS stratosphere (e.g. Noll et al. (1995), Lellouch et al. (1995), Moreno et al. (2003)). Recent sub-millimeter observations have revealed that the upper stratospheric CO molar fraction on Saturn, Uranus and Neptune is larger than that at the lower levels (Lellouch et al. (2005), Hesman et al. (2007), Fletcher et al. (2010), Cavalié et al. (2009), Cavalié et al. (2014)) that indicates the presence of a CO external supply. On Neptune, since the measured CO/\ceH2O and CO/\ceCO2 flux ratios are larger than the cometary [CO]/\ce[H2O] and [CO]/\ce[CO2] values, the CO was probably formed during a comet impact through rather than a steady influx of Inter-planetary Dust Particle (IDP) and subsequent evaporation Zahnle (1996). Moreover, observed vertical distribution of the stratospheric CO on Saturn and Uranus match with the cometary impact model, not the IDP model (Cavalié et al. (2010), Cavalié et al. (2014)).
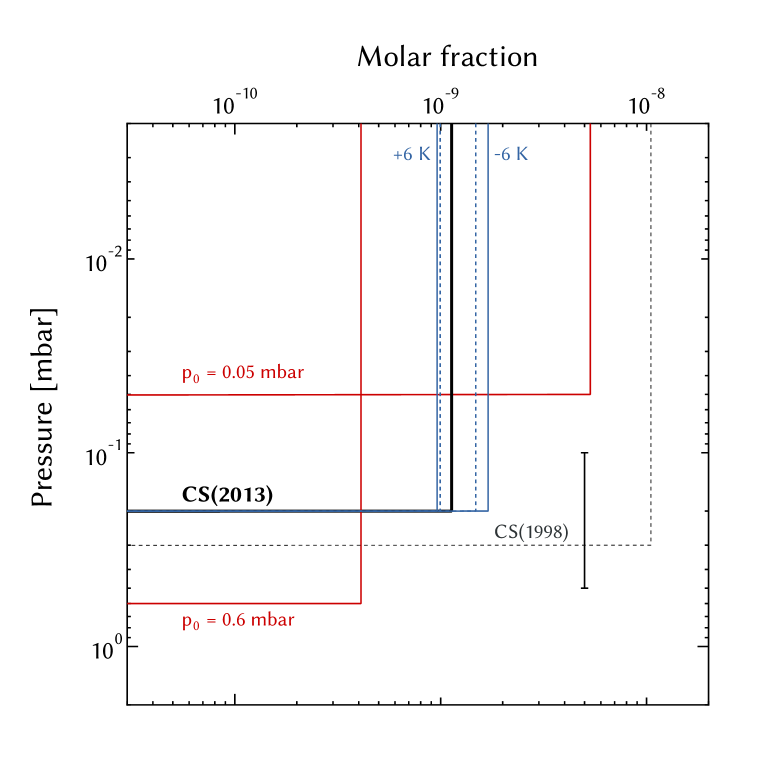
. We have focused on the most abundant sulfur species(CS) and its chemistry, because S-bearing species may be diagnostic of cometary impacts in other giant planets as well. After the SL9 event, some S-bearing species were newly discovered in Jupiter’s stratosphere at various wavelengths ranging from ultraviolet to sub-millimeter. Within a month after the SL9 event, \ceS2 was observed to be a dominant sulfur reservoir among the species discovered, such as \ceCS2, OCS, CS and possibly \ceH2S (Noll et al. (1995), Lellouch et al. (1995)). The abundances of observed S-bearing species have shown different time variations such that while the spectral features of \ceS2, \ceCS2, OCS and \ceH2S had faded within a month (Noll et al. (1995)), CS molecule became a major sulfur reservoir instead. Since the total mass of \ceS2 observed in 1994 as 1014 g was comparable with that of CS in 1995, CS was expected to be produced mainly by the conversion of \ceS2 (Moreno et al. (2003)). To explain the conversion of \ceS2 into CS, Moses (1996) developed a sulfur chemistry model such that \ceS2 can produce CS through a reaction with \ceC2H3 as follows: \ceS2 + C2H3 + H -¿ 2CS + 2H2. HCS and \ceH2CS were expected to work as the intermediates to produce CS by the following reactions: \ceHCS + H -¿ CS + H2, \ceH2CS + h -¿ CS + H2. Frequent millimeter and sub-millimeter observations of CS, HCN and CO have performed from 1994 to 1998 to monitor their abundance, horizontal and vertical distributions by using the Institut de Radioastronomie Millimétrique (IRAM) 30-m telescope and 15-m James Clerk Maxwell Telescope (JCMT). Since the total mass of CS measured in 1998 as 1.40.61013 g was within the uncertainty of the value measured in 1995, no time variation of CS abundance was found during the monitoring period. The vertical distribution of CS was modeled as a simple two-layer model with a \cep_0 cut-off pressure level. In 1995, the \cep_0 value was derived to be 0.15 mbar at a longitude of 44∘S where the collision sites were located. Owing to the vertical diffusion of gases, the \cep_0 pressure level moved downward approximately 0.2 mbar and 0.3 mbar in 1996 and 1998, respectively. Moreno et al. (2003) expected the \cep_0 value in 2014 to be 1.0 mbar according to the vertical transportation model.
Besides Jupiter, several attempts have been made to detect S-bearing species on Saturn and Neptune(Fletcher et al. (2012), Iino et al. (2014)). However, negative observation results of \ceSO2, \ceH2S and CS on Saturn, and additional SO, OCS and \ceC3S on Neptune have been reported. The discrepancies of these results with that of Jupiter is interesting since the cometary impacts on both planets have been suggested as the source of external CO in Saturn and Neptune.
Although the conversion process of \ceS2 into CS occurring just after the impact has been fully explained already(Moses (1996)), the sulfur chemistry related to the destruction of CS is unknown.
In 2013, we conducted new observation at submillimeter wavelength, which are typically sensitive to the stratospheric temperature . In this paper, detail of the observation, data analysis and observation results are given in section 2. The sulfur chemistry in Jupiter’s stratosphere is discussed in section 3.
2 Methods
2.1 Observation
Our observation was performed by using the Atacama Sub-millimeter Telescope Experiment (ASTE) 10-m single-dish telescope (Ezawa et al. (2004)), operated by National Astronomical Observatory of Japan (NAOJ), located at an altitude of 4800 m on the Atacama highland, Chile. Observation was performed from 9:36 UT to 11:33 UT, October 1, 2013. The angular diameter of Jupiter was 37.5” whereas the full width half maximum (FWHM) of the ASTE at the 350 GHz band is 22”. The observation was conducted during the same period as our Neptune observation (Iino et al. (2014)).
We used a sideband separating mixer receiver CATS345 (Inoue et al. (2008)) that can be tuned from 324 GHz to 372 GHz. For CS, only the =7–6 rotational transition is observable in the frequency range of CATS345. Separation of V and H polarization is not available during observation season. For the back-end, a MAC XF type digital spectrometer (Sorai et al. (2000)) was used with 512 MHz bandwidth and 500 kHz spectral resolution . Focus was calibrated before the observing . Similar to the previous observations of Jupiter and Saturn (Moreno et al. (2003), Cavalié et al. (2010)), both equatorial edges of Jupiter were set as ON and OFF positions to achieve the high signal to noise ratio . The integration time for each ON and OFF position was 15 s. For the pointing accuracy correction, cross-scan pointing observation of Jupiter’s continuum emission was performed before and during the observing time. The measured pointing error during the observation was 1” and 0” for azimuth and elevation, respectively, which are better than the 2”-3” typical pointing error of the ASTE. Owing to the low elevation angle during the observation as 39.5∘-44.5∘, the measured system temperature value of 532-627 K was higher than the typical value of ASTE of 250 K.
Just after the observation, one of the standard sources of ASTE, IRC10216, was observed to calibrate the receiver. The obtained 6.1 K CS intensity of IRC10216 is consistent within 10 with the previous single-sideband calibrated intensity of Caltech Submillimeter Observatory(CSO)(Wang et al. (1994)) obtained as 5.70.4 K in the antenna temperature scale.
2.2 Observation results
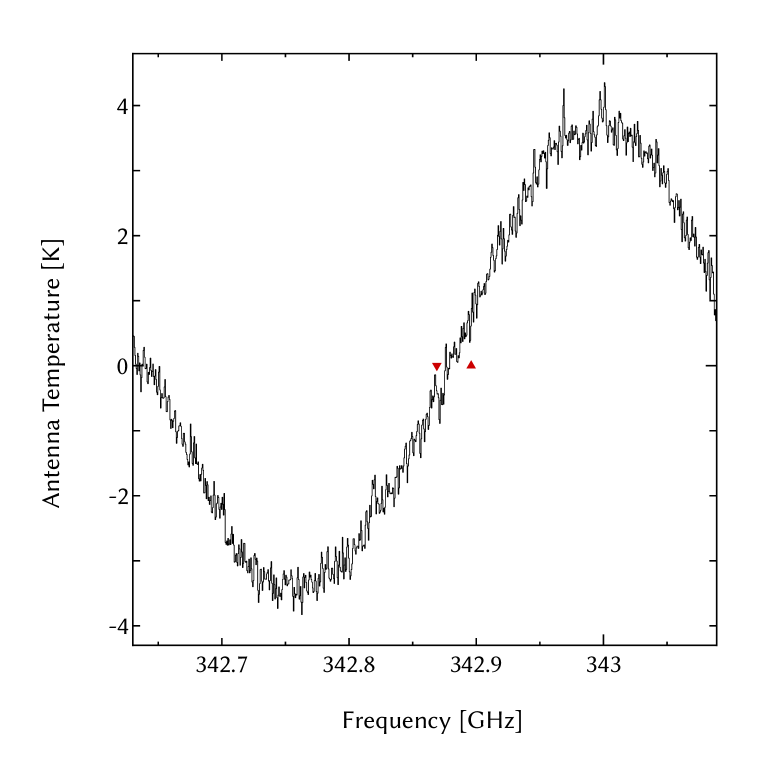
The vertical and horizontal axes are expressed in the antenna temperature scale in units of Kelvin, and the rest frequency in GHz. To decrease the observed baseline structure, the polynomial fitting method was employed for each observation scans. Second, all of baseline-corrected scans equivalent to 47 min integration time were averaged. The integrated spectrum is shown in Figure 2 in black lines. The lines seen in the ON and in the OFF spectra (in emission and absorption, respectively, in Figure 2) are blue-shifted and redshifted (respectively) because of the planet rapid rotation. The absorption structure is the emission of the OFF position. The obtained intensities for respective ON and OFF positions are 120 mK in the antenna temperature scale. The root-mean-square (RMS) noise level achieved here is 18.1 mK. Therefore, detection of the CS line was achieved with 6.6 confidence.
2.3 analysis of column density and vertical distribution of CS
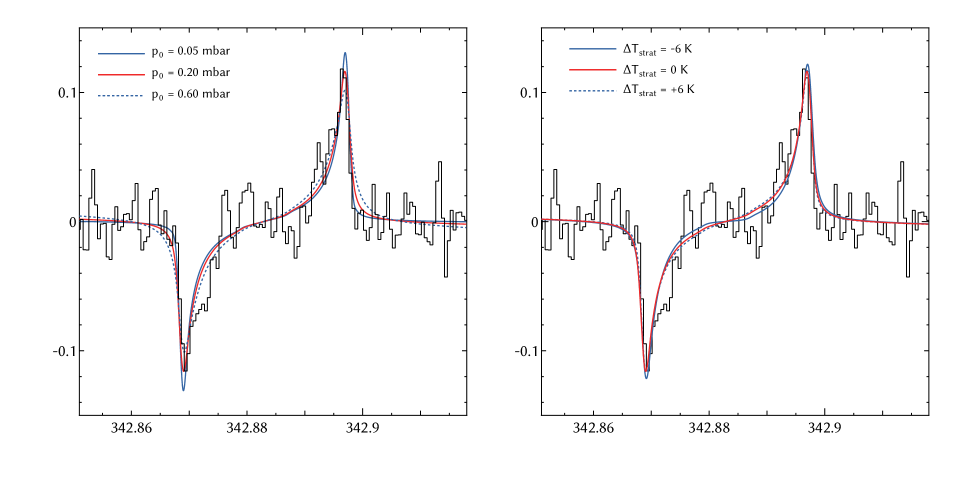
For the derivation of the CS abundance and vertical distribution, an atmospheric algorithm developed for terrestrial minor species (Ohyama et al. (2012)) was modified and applied to the spectrum. The rest frequency, line intensity and partition function of CS were extracted from the HITRAN 2012 spectroscopic database (Rothman et al. (2013)). The atmospheric structure employed here was the same as the previous observation (Matthews et al. (2002)). The relationship of the pressure broadening coefficient with atmospheric pressure p and temperature T is described as follows: = \ce_0(p/\cep_0)(\ceT_0/T)n cm-1, where \cep_0, \ceT_0 and n are 1 bar, 300 K and 0.75, respectively, and \ce_0 is pressure broadening coefficient of CS at \cep_0 and \ceT_0 as 0.125 cm-1. \ce_0 value used here was that of used in the previous study of Moreno et al. (2003) (provided by R. Moreno, private communication). For the continuum opacity, the collision induced absorption (CIA) of \ceH2-\ceH2 and \ceH2-He pairs were employed for each atmospheric layers. The values of CIA were obtained from the HITRAN catalogue. For the main beam efficiency value, we assumed the typical value of ASTE as 0.6. The spherical geometry was modeled to take into account the limb effect. 1-D radiative transfer calculations have been performed on each gridpoints of a grid covering the planet, in which the spacing between gridpoints was set to 100 km (i.e. 1/720 equatorial radius). Various vertical distribution models in which CS is present uniformly above the \cep_0 = 0.01-1.0 mbar pressure level were attempted to reproduce the obtained spectrum. Only the CS molar fraction was as the free parameters
2.4 Results of
is 0.2 mbar, which is consistent with the one measured in 1998 as (Moreno et al. (2003)). 1 error of \cep_0 range goes from 0.05 to 0.6 mbar region. mole fraction and column density of \cep_0=0.2 mbar model were 1.110-9 and 3.481013 molecules cm-2, respectively. .
3 Discussion
In May 1995, 10 months after the SL9 event, the CS column density measured at 44∘S at the latitude of comet collision was reported as 0.6-1.41015 cm-2 . Thus, our new observation shows that the CS total mass decreased up to 90 that of in 1998. Due to the low S/N,
of the CS column density is important for the understanding of the sulfur chemistry in the stratosphere of gas giants. Condensation or polymerization processes may contribute to the removal of CS from the gas phase to produce solid or liquid phase, or polymerized CS expressed as (CS)\ce_n. However, the precise evaluation of the phase change is unavailable due to the absence of phase change parameters in the literature. Polymerization is a characteristic phenomenon of S-bearing species. In particular, polymerization of CS on the aerosol surface, which would occur and remove the gas phase CS.
From the photochemical perspective, the discovery of CS even in 19 years after the production is interesting because CS is considered to be a chemically unstable molecule due to its short lifetime against the photolysis . Photolysis (\ceCS + h -¿ C + S) is the rapid destruction process of CS in the gas phase. Therefore, the discovery of a CS molecule on Jupiter suggests the presence of a recycling process for CS.
In the case of Neptune, a previous large cometary impact is suggested by the larger flux of CO than that of water vapor (Lellouch et al. (2005), Hesman et al. (2007)). Once the sulfur chemistry on Jupiter is revealed, the result will be a good reference not only to Neptune but also to Saturn where the previous cometary impacts are suggested.
References
- Archinal et al. (2011) Archinal, B. A., A’Hearn, M. F., Bowell, E., et al. 2011, Celestial Mechanics and Dynamical Astronomy, 109, 101
- Cavalié et al. (2009) Cavalié, T., Billebaud, F., Dobrijevic, M., et al. 2009, Icarus, 203, 531
- Cavalié et al. (2010) Cavalié, T., Hartogh, P., Billebaud, F., et al. 2010, Astronomy and Astrophysics, 510, A88
- Cavalié et al. (2014) Cavalié, T., Moreno, R., Lellouch, E., et al. 2014, Astronomy & Astrophysics, 562, A33
- Ezawa et al. (2004) Ezawa, H., Kawabe, R., Kohno, K., & Yamamoto, S. 2004, in Society of Photo-Optical Instrumentation Engineers (SPIE) Conference Series, Vol. 5489, Proc. SPIE 5489, ed. J.~M.~Oschmann Jr., 763–772
- Fletcher et al. (2010) Fletcher, L. N., Drossart, P., Burgdorf, M., Orton, G. S., & Encrenaz, T. 2010, Astronomy and Astrophysics, 514, A17
- Fletcher et al. (2012) Fletcher, L. N., Swinyard, B., Salji, C., et al. 2012, Astronomy & Astrophysics, 539, A44
- Gladstone et al. (1996) Gladstone, G. R., Allen, M., & Yung, Y. L. 1996, Icarus, 119, 1
- Hesman et al. (2007) Hesman, B. E., Davis, G. R., Matthews, H. E., & Orton, G. S. 2007, Icarus, 186, 342
- Iino et al. (2014) Iino, T., Mizuno, A., Nakajima, T., et al. 2014, Planetary and Space Science, 104, 211
- Inoue et al. (2008) Inoue, H., Muraoka, K., Sakai, T., et al. 2008, Proceedings of the Ninteenth International Symposium on Space Terahertz Technology, 281
- Lellouch et al. (2005) Lellouch, E., Moreno, R., & Paubert, G. 2005, Astronomy and Astrophysics, 40, 37
- Lellouch et al. (1995) Lellouch, E., Paubert, G., Moreno, R., et al. 1995, Nature, 373, 592
- Matthews et al. (2002) Matthews, H. E., Marten, a., Moreno, R., & Owen, T. 2002, The Astrophysical Journal, 580, 598
- Moreno et al. (2003) Moreno, R., Marten, A., Matthews, H., & Biraud, Y. 2003, Planetary and Space Science, 51, 591
- Moses (1996) Moses, J. I. 1996, in The Collision of Comet Shoemaker-Levy 9 and Jupiter, ed. K. S. Noll, H. A. Weaver, & P. D. Feldman (Cambridge: Cambridge University Press), 243–268
- Noll et al. (1995) Noll, K., McGrath, M., Trafton, L., et al. 1995, Science, 267, 1307
- Ohyama et al. (2012) Ohyama, H., Kawakami, S., Shiomi, K., & Miyagawa, K. 2012, IEEE Transactions on Geoscience and Remote Sensing, 50, 1770
- Rothman et al. (2013) Rothman, L., Gordon, I., Babikov, Y., et al. 2013, Journal of Quantitative Spectroscopy and Radiative Transfer, 130, 4
- Sanzovo et al. (1993) Sanzovo, G. C., Singh, P. D., & Huebner, W. F. 1993, The Astronomical Journal, 106, 1237
- Sorai et al. (2000) Sorai, K., Sunada, K., Okumura, S. K., et al. 2000, Proc. SPIE, 4015, 86
- Wang et al. (1994) Wang, Y., Jaffe, D. T., Graf, U. U., & Evans, Neal J., I. 1994, The Astrophysical Journal Supplement Series, 95, 503
- Zahnle (1996) Zahnle, K. 1996, in The Collision of Comet Shoemaker-Levy 9 and Jupiter, ed. P. D. F. Keith S. Noll, Harold A. Weaver (Cambridge University Press), 183–212