X-rays from the location of the Bactrian Transient ASASSN-15lh
Abstract
We present the detection of persistent soft X-ray radiation with at the location of the extremely luminous, double-humped transient ASASSN-15lh as revealed by Chandra and Swift. We interpret this finding in the context of observations from our multiwavelength campaign, which revealed the presence of weak narrow nebular emission features from the host-galaxy nucleus and clear differences with respect to superluminous supernova optical spectra.
Significant UV flux variability on short time-scales detected at the time of the re-brightening disfavors the shock interaction scenario as the source of energy powering the long-lived UV emission, while deep radio limits exclude the presence of relativistic jets propagating into a low-density environment.
We propose a model where the extreme luminosity and double-peaked temporal structure of ASASSN-15lh is powered by a central source of ionizing radiation that produces a sudden change of the ejecta opacity at later times. As a result, UV radiation can more easily escape, producing the second bump in the light-curve. We discuss different interpretations for the intrinsic nature of the ionizing source.We conclude that, if the X-ray source is physically associated with the optical-UV transient, ASASSN-15lh most likely represents the tidal disruption of a main-sequence star by the most massive spinning black hole detected to date.
In this case, ASASSN-15lh and similar events discovered in the future would constitute the most direct probes
of very massive, dormant, spinning, supermassive black holes in galaxies. Future monitoring of the X-rays may allow us to distinguish between the
supernova and TDE hypothesis.
Subject headings:
supernovae: specific (ASASSN-15lh)1. Introduction
Optical surveys sampling the sky over time scales of a few days significantly advanced our knowledge of astronomical transients of different origins, including super-luminous supernovae (SLSNe; Quimby et al. 2011; Chomiuk et al. 2011; Gal-Yam 2012), very fast-rising stellar explosions (e.g. Drout et al. 2014) and stellar tidal disruptions by super-massive black holes (TDEs; Rees 1988; Komossa 2015). Occasionally, a transient is found with properties that seem to defy all previous classification schemes. The event ASASSN-15lh belongs to this category.
ASASSN-15lh (Dong et al. 2016) was discovered by the All-Sky Automated Survey for Supernovae (ASAS-SN111http://www.astronomy.ohio-state.edu/ assassin/index.shtml) on 14 June 2015 at z=0.2326 ( Mpc for standard Plank cosmology). Its extremely large peak luminosity and the blue, almost featureless spectrum with no apparent sign of H or He (and some spectroscopic resemblance to the SLSN 2010gx) led Dong et al. (2016) and Godoy-Rivera et al. (2016) to suggest that ASASSN-15lh is the most luminous SLSN ever detected. The very large energy radiated by ASSASN-15lh (, Godoy-Rivera et al. 2016), requires extreme properties of the progenitor star and sources of energy that are different from the standard radioactive decay of 56Ni that powers normal H-stripped SNe in the local Universe (Dong et al. 2016; Chatzopoulos et al. 2016; Kozyreva et al. 2016). In this context, the double-humped light-curve of ASASSN-15lh has been interpreted by Chatzopoulos et al. (2016) as a signature of the interaction of massive SN ejecta with an H-poor circumstellar shell of , possibly supplemented by radiation from a newly-born rapidly-rotating magnetar (Metzger et al., 2015; Sukhbold & Woosley, 2016; Bersten et al., 2016; Dai et al., 2016).
The old, massive host galaxy of ASASSN-15lh, with limited star formation (; Dong et al. 2016), is however markedly different from those of core-collapse SNe (e.g. Leaman et al. 2011) as well as of envelope-stripped SLSNe, which tend to be younger star forming systems with significantly lower stellar mass (Lunnan et al. 2014, 2015; Perley et al. 2016). This observation, together with the location of the transient, astrometrically consistent with the host galaxy nucleus, inspired a connection between ASASSN-15lh and the tidal disruption of a star by the host-galaxy super-massive black hole (SMBH, Godoy-Rivera et al. 2016; Brown et al. 2016b; Leloudas et al. 2016; Perley et al. 2016). In this context ASASSN-15lh would be the most luminous TDE ever observed, associated to a SMBH with mass (Dong et al., 2016; Godoy-Rivera et al., 2016) significantly larger than any SMBH presently associated to a TDE (e.g. Komossa 2015).
It is clear that the luminosity, the spectral properties and the double-humped (i.e., “Bactrian”) light-curve of ASASSN-15lh, as well as its host galaxy, are unprecedented both in the context of SLSNe and in the context of TDEs.
In this paper we present and discuss the following observational facts: [i] Uncovering of persistent, soft X-ray emission at the location of ASASSN-15lh (Sec. 2.1 and Sec. 2.2); [ii] Detection of significant temporal variability at UV wavelengths during the re-brightening phase (Sec. 2.3); [iii] Detection of narrow nebular spectral features connected to the host-galaxy nucleus (Sec. 2.4). We propose a scenario where a single physical mechanism can naturally explain the double-humped light-curve of ASASSN-15lh and suggest that its location, very close or coincident with the nucleus of a galaxy that harbors a massive SMBH, is likely the key to unlocking the mysterious nature of the transient (Sec. 3). Conclusions are drawn in Sec. 4.
In our analysis we assume the object’s time of first light to be April 29, 2015, corresponding to a 30-day (rest-frame) rise-time to maximum V-band luminosity (Dong et al., 2016). Our main conclusions do not depend on this assumption.
2. Data Analysis and Results
2.1. X-ray analysis- CXO
We obtained four epochs of deep X-ray observations of ASASSN-15lh with the Chandra X-ray Observatory (CXO) on November 12, 2015 (exposure of 10 ks), December 13, 2015 (10 ks), February 20, 2016 (40 ks) and August 19, 2016 (30 ks, PI Margutti), corresponding to days, days, and days rest frame since optical maximum light, which occurred on June 5, 2015 (Dong et al., 2016). CXO data have been reduced with the CIAO software package (version 4.8) and corresponding calibration files. Standard ACIS data filtering has been applied.
ASASSN-15lh is not detected in our first epoch of observations (ID 17879), with a 3 count-rate upper limit of (0.5-8 keV). The Galactic column density in the direction of the transient is (Kalberla et al., 2005). For an assumed power-law spectrum with photon index and Galactic absorption, the unabsorbed 0.3-10 keV flux limit is (). Our analysis below favors a soft X-ray spectrum with negligible absorption and or a thermal spectrum with . For these parameters, the unabsorbed 0.3-10 keV flux limit is (non-thermal spectrum) and (thermal spectrum).
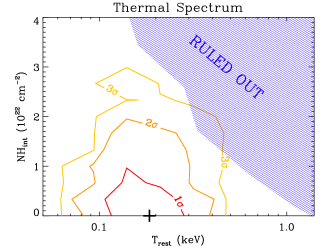
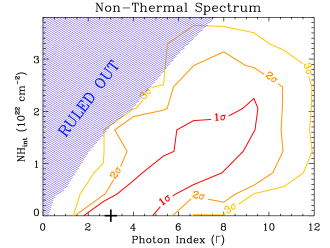
In our second epoch of observation (ID 17880) we find evidence for weak, soft X-ray emission at the location of ASASSN-15lh. We detect two photons with energy 1 keV in a region around the transient, corresponding to a 4.3 c.l. detection in the 0.5-1 keV energy range, and to a 3.3 c.l. detection in the 0.5-8 keV energy range. We constrain the spectral parameters by using the observed background and the actual instrumental response to simulate the expected emission from a grid of thermal and non-thermal spectral models with a wide range of intrinsic absorption . The regions excluded at 3 confidence are shaded in Fig. 1.
An X-ray source is clearly detected at the location of ASASSN-15lh at the time of our third CXO observation (ID 17881), with count-rate and significance of 5.2 in the 0.5-8 keV range (4.7 in the 0.5-1 keV energy range). In our fourth epoch (ID 17882) the source is still detected with count-rate and significance of 4.9 in the 0.5-8 keV range (3.6 in the 0.5-1 keV energy range).
We employ the Cash statistics to fit the spectra (we have a total of six and five photons in a 1 region around the transient in the third and fourth epoch, respectively), and perform a series of MCMC simulations to constrain the spectral parameters. The analysis of each of the two epochs taken separately points to a soft X-ray spectrum, with limited absorption and no evidence for statistically significant evolution between the two epochs. We thus constrain the X-ray source spectral parameters with a joint spectral fit of the two CXO epochs of observation, where the spectral normalization is allowed to vary from one epoch to the other.
The results are displayed in Fig. 1. For an absorbed, non-thermal power-law spectrum, the best-fitting parameters are and . The inferred (0.3-10 keV) unabsorbed flux for this model is corresponding to (third epoch) and (, fourth epoch). The best-fitting parameters for an absorbed blackbody spectrum are: keV, . The inferred (0.3-10 keV) unabsorbed flux for this model is , corresponding to (third epoch) and (, fourth epoch). Both spectral models point to a very limited amount of neutral Hydrogen in the host galaxy along our line of sight, consistent with the very low N(HI) inferred by Leloudas et al. (2016) from Ly- and the very strong high ionization lines (N V and O VI).
With reference to Fig. 1 we find that: (i) the X-ray source shows a soft spectrum (most of the allowed parameter space is at and keV) with limited intrinsic absorption (of the order of a few at most). (ii) There is no evidence for strong temporal and/or spectral variability of the X-ray source.
We first evaluate the possibility that the X-ray emission arises from a population of Low-Mass X-ray Binaries (LMXBs) residing in the early-type host galaxy, using the and relations by Kim & Fabbiano (2004). For the host-galaxy of ASASSN-15lh Dong et al. (2016) measure mag and mag, which imply (0.3-8 keV). This is a factor smaller then the measured X-ray emission at the location of ASASSN-15lh (re-calibrated with the same spectral model as Kim & Fabbiano 2004 in the 0.3-8 keV band). We conclude that LMXBs are unlikely to be the source of the detected X-rays. We thus envision two possible scenarios: either the X-rays originate from weak AGN activity from the host galaxy nucleus or they are physically connected to the optical/UV transient. In the first case we expect a somewhat stable X-ray emission over the time scale of years, while we anticipate fading if the X-ray emission is directly connected to ASASSN-15lh. Future observations will clarify the origin of the detected high-energy emission. Below we put our results into the context of X-ray emission from known transients (i.e. SNe and TDEs).
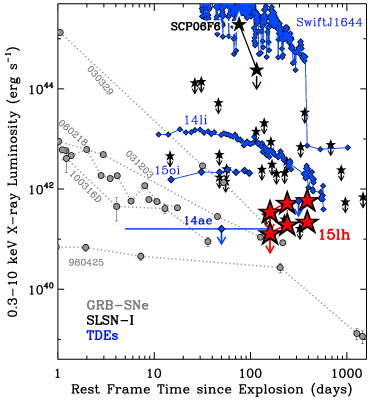
The detected emission is softer than the typical X-ray spectrum of SNe associated with Gamma-Ray Bursts (, e.g. Margutti et al. 2013b) and normal H-stripped SNe (e.g. Chevalier & Fransson 2006; Dwarkadas & Gruszko 2012), which typically show and a decaying flux with time. A way to sustain luminous X-ray emission over a long time is to invoke the SN shock interaction with a thick medium (see e.g. SN 2014C, Margutti et al. 2016). However, the observed X-ray spectrum of H-stripped SNe strongly interacting with the environment is even harder ( keV), and thus even more different from what we observe at the location of ASASSN-15lh (e.g. Margutti et al. 2016). It is thus unlikely that a SN shock interaction with the medium is powering both the X-ray and optical/UV emission from ASASSN-15lh. Finally, compared to the only other X-ray source associated to a SLSN-I so far, the emission at the location of ASASSN-15lh is also softer and significantly longer lived (Fig. 2): for the SLSN-I SCP06F6, Levan et al. (2013) reports (or a thermal spectrum with keV).
The X-ray properties of ASASSN-15lh are instead more reminiscent of the soft X-ray emission detected in non-jetted TDEs. Non-jetted TDEs detected with ROSAT, XMM-Newton, Chandra and, more recently, with Swift show peak luminosities of and very soft spectra that later harden with time on a time-scale of years and with initial temperatures keV (e.g. Komossa 2015 for a recent review).
As for the TDEs ASASSN-15oi (Holoien et al., 2016b) and ASASSN-14li (van Velzen et al., 2016), the X-ray emission is more luminous than what expected based on the extrapolation of the optical/UV blackbody model (see Sec. 2.3) and a more complex model is needed. In this context ASASSN-15lh would show the most extreme ratio (compared to for ASASSN-14li and for ASASSN-15oi).
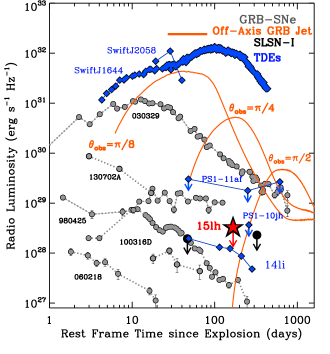
In Fig. 2 we put ASASSN-15lh on the X-ray luminosity plane of energetic envelope-stripped core-collapse SNe (i.e. GRB-SNe and SLSNe) and TDEs. ASASSN-15lh is times less luminous than the SLSN-I SCP06F6 and does not experience a similar drop in luminosity. At 100 days, the X-ray emission at the location of ASASSN-15lh is more luminous than GRB-SNe. However, observations obtained around the same epoch by the ATCA in Fig. 3 put deep limits to the radio emission from ASASSN-15lh (Kool et al., 2015; Leloudas et al., 2016), and rule out the presence of powerful jets seen on axis (most of the parameter space associated with off-axis GRB-like jets is also ruled out). Also in this case, the luminous and not strongly variable X-ray emission at the location of ASASSN-15lh, which lacks a luminous radio counterpart, seems to be more in line with observations of non-jetted TDEs (recent examples are ASASSN-14li, Miller et al. 2015; Alexander et al. 2016; Holoien et al. 2016b; or ASASSN-15oi, Holoien et al. 2016a).
2.2. X-ray analysis- Swift/XRT and XMM-Newton
We re-processed all the X-ray data collected by the Swift-XRT (Burrows et al., 2005) between June 24, 2015 until July 22, 2016 (total exposure time of 270 ks), following the prescriptions outlined in Margutti et al. (2013b). A targeted search for X-ray emission at the location of ASASSN-15lh identifies the presence of a weak X-ray excess with significance of in the 0.3-5 keV range. The significance is reduced to in the 0.3-10 keV energy range, consistent with the soft X-ray spectrum suggested by the CXO observations. We infer a background subtracted count-rate of (0.3-5 keV), which corresponds to an unabsorbed 0.3-10 keV flux and for a blackbody and power-law spectral model, respectively, and the best-fitting spectral parameters derived from the CXO data. The average flux inferred from Swift-XRT observations is thus consistent with the results from the CXO analysis and suggests that the X-ray source at the location of ASASSN-15lh experienced at most mild temporal variability over the 1 yr of Swift monitoring. We note that flux variations of the order of a factor of a few are consistent with our findings, given the uncertainties affecting both the Swift-XRT and the CXO measurements. A delayed onset of the X-ray emission with respect to the optical emission is also clearly allowed, since Swift-XRT data started to be collected after optical maximum light.
Finally, XMM-Newton observed ASASSN-15lh on November 18, 2015 ( days rest-frame since maximum light), six days after our first CXO epoch, which yielded a non-detection. From the XMM-Newton observations Leloudas et al. (2016) infer a confidence level flux limit (0.3-1 keV). We do not confirm the results from Leloudas et al. (2016). Adopting their inferred count-rate limit of 11 source counts in 9 ks of exposure time with EPIC-MOS2, their assumed blackbody spectrum with eV, and following the flux calibration procedure outlined in Leloudas et al. (2016), we infer a flux limit which is times larger.
We re-analyzed the XMM data using standard routines in the Scientific Analysis System (SAS version 15.0.0) and the relative calibration files. We employ a source region of 32 radius and extract the background from a source-free region on the same chip. No X-ray source is detected at the location of ASASSN-15lh. Our best constraints are derived from observations obtained with EPIC-MOS2, with total exposure time of 9 ks (after removal of time windows contaminated by proton flaring) and a 3 count-rate upper limit of (0.3-10 keV). For the best fitting spectral models derived from CXO detections, we infer the following unabsorbed 0.3-10 keV flux limits: and for the blackbody and the power-law spectrum, respectively. XMM observations do not reach the necessary depth to probe the emission from the X-ray source that we detect with CXO and the stacking of Swift-XRT observations. A summary of the results from the X-ray observations of ASASSN-15lh can be found in Table 1.
2.3. UV analysis
We re-analyzed all the Swift-UVOT observations obtained from June 24, 2015 until July 22, 2016 following the prescriptions by Brown et al. (2009) and adopting the updated calibration files and revised zero points by Breeveld et al. (2011). Each individual frame has been visually inspected and quality flagged. Observations with insufficient exposure time have been merged to obtain higher signal-to-noise ratio (S/N) images from which we extracted the final photometry reported in Table 2. We corrected for Galactic extinction in the direction of the transient ( mag, Schlafly & Finkbeiner 2011) and subtracted the host galaxy flux component as constrained by Dong et al. (2016). We performed a self-consistent flux calibration, and applied a dynamical count-to flux conversion that accounts for the spectral evolution of ASASSN-15lh, following the procedure outlined in Margutti et al. (2014a). Finally, we computed a bolometric light-curve of ASASSN-15lh by integrating the best-fitting blackbody spectra.
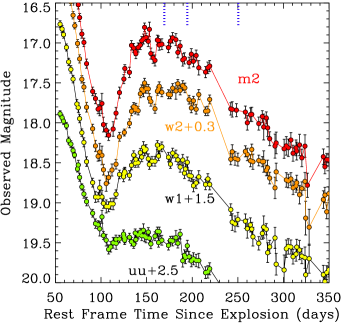
A partial collection of the Swift-UVOT photometry of ASASSN-15lh has already been presented by Dong et al. (2016), Godoy-Rivera et al. (2016), Brown et al. (2016b) and Leloudas et al. (2016). Here we update the observations and focus on the presence of significant temporal variability that appears at the time of the re-brightening. Figure 4 shows the presence of pronounced temporal variability across the UVOT bands, and more pronounced at UV wavelengths as first noticed by Brown et al. (2016b). The short variability time scale days at days since first light argues against the interpretation of the SN shock interaction with the surroundings as the main source of energy powering the re-brightening (Chatzopoulos et al., 2016). For a typical SN shock velocity c (e.g. Margutti et al. 2014b, their Fig. 2) we do not expect significant temporal variability on days at days, contrary to what we observe in ASASSN-15lh. This observation motivates us to consider alternative explanations of the UV re-brightening (Sec. 3.1).
2.4. Late-Time Optical Spectroscopy
We acquired deep multi-epoch optical spectroscopy of ASASSN-15lh, spanning the time range 35–350 rest-frame days after maximum light and sampling key points in the late evolution of the transient. A more detailed analysis will be presented in future work (Chornock et al., in prep.). Here we concentrate on an analysis of our highest S/N late-time spectrum, which was acquired well after the second re-brightening and when the underlying emission from the host galaxy stellar population is better revealed.
We observed ASASSN-15lh on 2016 June 10 ( days rest-frame since maximum light) using the Low Dispersion Survey Spectrograph (LDSS3C; Allington-Smith et al. 1994) on the 6.5 m Magellan Clay telescope. We obtained three 1800 s exposures using the VPH-All grism and a 1″-wide slit near the center of the field of view oriented at a position angle of 1283, which was close to the parallactic angle (Filippenko, 1982). This setup covered the range 3800–10500 Å with a resolution of 8.1 Å. Standard IRAF222IRAF is distributed by the National Optical Astronomy Observatory, which is operated by the Association of Universities for Research in Astronomy, Inc., under cooperative agreement with the National Science Foundation. tasks were used to perform two-dimensional image processing. We used custom IDL scripts to perform flux calibration and correction for telluric absorption using observations of EG131 obtained immediately prior to the object. We took particular care to mitigate the effects of second-order light contamination by combining observations of the standard star taken both with and without an order-blocking filter. However, small residual contamination at long wavelengths (¿8000 Å) is possible.
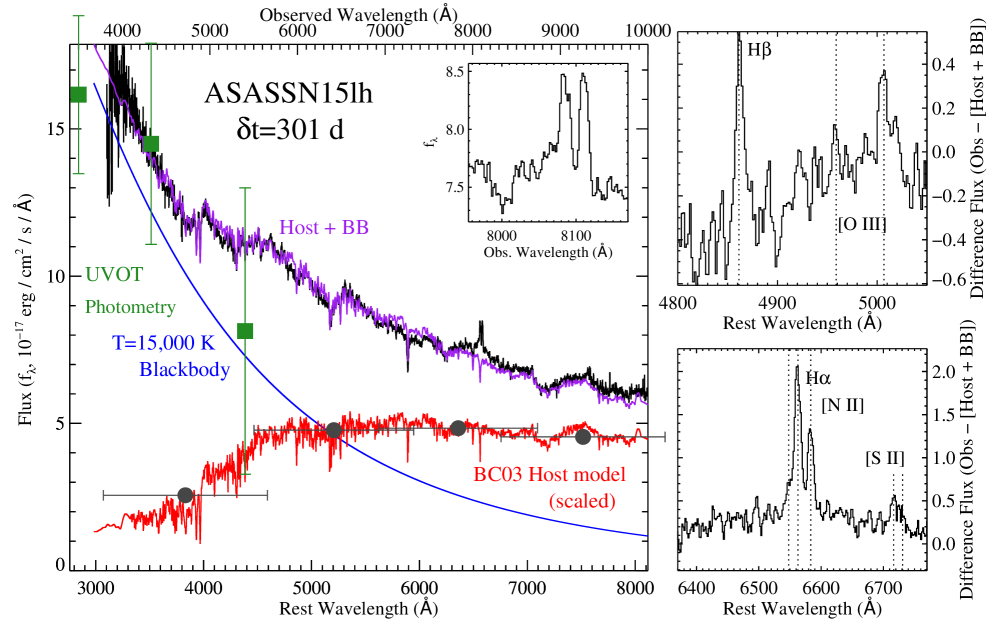
The resulting spectrum is shown in black in Figure 5. Numerous stellar absorption features from star light in the host galaxy are visible, as well as two emission peaks near H (observed wavelengths 8100 Å). Several authors have fit the available pre-outburst host galaxy photometry (Melchior et al., 2015; Dong et al., 2016; Leloudas et al., 2016) and have found consistent results. However, the presence of spectral features from the host stellar population has the potential to improve the constraints on the stellar population synthesis, so we used an iterative procedure to incorporate this information while avoiding the flux from the transient.
First, we estimated a best-fit blackbody temperature of K at the time of observations from the analysis of the UVOT photometry described above. We then subtracted a scaled blackbody spectrum from the observed spectrum under the constraint that the blackbody-subtracted spectrum had to match the observed colors of the host galaxy to obtain an initial estimate of the host-only spectrum. We then used the FAST code (Kriek et al., 2009) to fit the host-only spectrum combined with, and normalized by, the broadband host photometry (Melchior et al., 2015; Dong et al., 2016). For simplicity, we fixed the metallicity to solar and assumed a Chabrier (2003) initial mass function and zero internal extinction. We obtained a satisfactory fit using the Bruzual & Charlot (2003) stellar models and an exponentially-declining star formation law. The best-fit model has a total stellar mass of 1.21011 , a current stellar age of 10 Gyr, and an -folding timescale of 2 Gyr, resulting in a current star-formation rate of 0.8 . These numbers are in broad agreement with those reported previously (e.g, Dong et al. 2016; Leloudas et al. 2016). Other choices for the stellar population model produced qualitatively similar results, although usually with smaller current star-formation rates. Our best fit for the host is plotted in red in Figure 5.
We then fitted our observed spectrum as a linear combination of the host galaxy model and a blackbody to find appropriate flux scaling factors. The scaled blackbody is plotted as blue in Figure 5 and good agreement can be seen with the host-subtracted UVOT photometry (green squares) interpolated to the date of observation. Both the fitted host spectrum and the overplotted host photometry (gray circles) have been scaled by a factor of 0.40 from the values for the whole host, which presumably results from the smaller size of our spectroscopic aperture relative to the host as a whole. The Bruzual & Charlot (2003) models clearly have narrower features than those visible in our spectrum, so the host template was smoothed with a 10 Å boxcar function to mimic the combined effects of our spectral resolution and the internal velocity dispersion of the host galaxy. Our results are not very sensitive to the width of this smoothing kernel. The sum of the scaled blackbody and the smoothed galaxy template is plotted in magenta in Figure 5 and is a good match to the observed spectrum in black.
Leloudas et al. (2016) noted two emission peaks near 4000 and 5200 Å in their late-time spectra of ASASSN-15lh. However, accurate modeling of the host galaxy stellar component from our late-time spectrum demonstrates that the most prominent broad spectral features detected in the observed (host plus transient) late-time spectra have to be attributed to the underlying continuum from the host galaxy star light (Figure 5). We do not find unambiguous evidence for broad spectral features associated with the transient at this epoch. Small, broad, low-amplitude discrepancies between the observed spectrum and combined fit (black and magenta lines, respectively) are present, but it is not yet clear if they represent true spectral features of the transient or limitations in the stellar population synthesis modeling. More observations of the host will be required after the optical transient fades further to more accurately constrain the presence of possible low amplitude broad spectral features in the transient spectrum at late times.
Without any correction for the host galaxy, the spectrum has the two obvious narrow emission features near 8085 and 8111 Å (in air) noted above, which can be clearly associated with H and [N II] 6583 at =0.2320 (lower-right panel of Figure 5)333This redshift is consistent with that measured from the stellar absorption features. Note that this value is slightly offset from the redshift =0.2326 measured from narrow UV absorption lines (Dong et al., 2016; Brown et al., 2016b; Leloudas et al., 2016). We do not discuss further the implications of this possible velocity offset for the UV absorbers in this work.. [N II] 6548 is blended in the blue wing of H. H is only visible in emission after subtraction of the host model. Weaker features also appear to be present in the difference spectrum near the [S II] doublet and [O III] 5007. We searched for [O II] 3727 emission and none is visible, but the S/N of the spectrum is not as high at those wavelengths. Inspection of our spectral sequence reveals that the H/[N II] lines are present in several of our higher S/N spectra throughout the evolution of the transient, consistent with a constant low-level contribution that is strongly diluted by light from the transient at earlier times.
The peaks of H and [N II] 6583 are of comparable height prior to subtraction of the host model. Strong [N II]/H is a possible sign of ionization by an AGN-like continuum. However, after correction for the underlying Balmer absorption in our best-fit host model, the ratio decreases to 0.5. This line ratio, combined with weak [O III]/H and [S II]/H, is consistent with the nebular emission being powered by star formation instead of AGN activity (Kewley et al., 2006). We caution that these ratios are sensitive to systematic errors in the modeling of the underlying stellar absorption, and in particular the strength of the stellar Balmer absorption. If all of the inferred H emission (flux 2.710-16 erg cm-2 s-1) is powered by star formation, the inferred rate is 0.4 yr-1 (Kennicutt, 1998), in rough agreement with that estimated from the host galaxy stellar population fit.
Leloudas et al. (2016) reported H emission from ASASSN-15lh with a full width at half-maximum (FWHM) of 2500 km s-1, but in our data, it is clear that the reported emission feature is just the narrow nebular H and [N II] from the host blended together at low S/N or low resolution in their data. Note that in their highest S/N spectra (inset of their Figure 1), the putative H from the transient is flat-topped or double peaked, consistent with the two strong nebular emission lines of roughly equal height (inset of our Figure 5) being blended together. We also note that Leloudas et al. (2016) do not attempt to correct for the contribution from the underlying stellar continuum. Therefore, we do not confirm their claim of H emission from the transient itself and the reported velocity FWHM likely reflects the spacing of the two [N II] lines, which are each offset by 1000 km s-1 from the central H emission. Godoy-Rivera et al. (2016) also report a ”bump” near H at late times, but they do not report a FWHM, so it is not clear if they are are also possibly referring to a noisy detection of the narrow nebular lines.
2.5. Re-analysis of Early-Time Optical Spectra
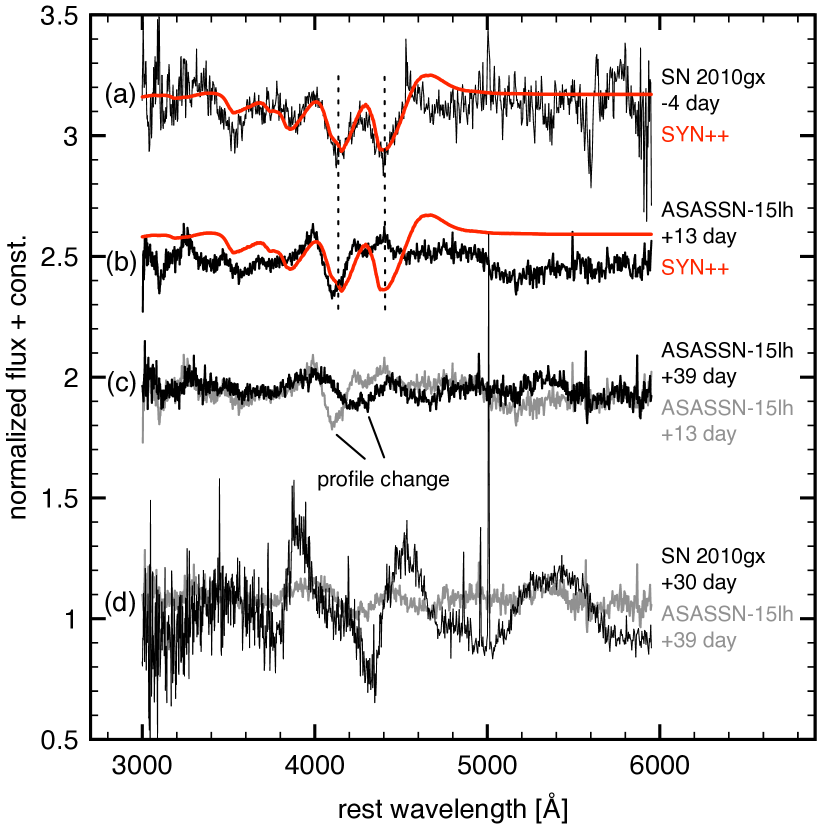
In addition, we re-evaluated the early optical spectra of ASASSN-15lh and were unable to confirm the likeness to SLSNe reported by Dong et al. (2016). The O II ion, which is commonly observed in SLSNe (Quimby et al., 2011), has a number of distinctive absorption features not observed in ASASSN-15lh (Fig. 6). The strongest two features centered near 4100 and 4400 Å are always observed to be of comparable strength and no reasonable values of temperature or density can change this ratio. ASASSN-15lh only shows the 4100 Å feature (Fig. 6, see also Leloudas et al. 2016). Without the accompanying 4400 Å feature, it is hard to reconcile the proposed association with O II, and thus the spectroscopic connection to SLSNe is not robust.
The spectral features of ASASSN-15lh trend redward over time toward declining velocities. This is similar to the spectral evolution of supernovae where it is attributed to an expanding and cooling photosphere. However, unlike supernovae, the features of ASASSN-15lh do not show traditional P-Cyg profiles and become increasingly inconspicuous. For example, the +30 day spectrum of SN 2010gx exhibits pronounced features, whereas the +39 day ASASSN-15lh spectrum is nearly featureless (Fig. 6). We explored a variety of possible ions using the highly parameterized spectrum synthesis tool, SYN++ (Thomas et al., 2011), to determine whether blending of features could reproduce the spectral features and evolution of ASASSN-15lh, but were unsuccessful.
To our knowledge the only previous examples of spectral features becoming increasingly inconspicuous in the early phases of a supernova involve interaction with dense CSM. SN-CSM interaction can rescale or “mute” the line profile relative to the continuum (Branch et al., 2000). Most confirmed instances of SN-CSM interaction involve H-rich material that can be readily identified by the presence of H Balmer lines that may be narrow ( 100 km s-1) to broad ( km s-1) in width, depending on their origin of formation. The hydrogen-poor SLSN iPTF13ehe exhibited H Balmer emission with broad and narrow components +251 days post maximum (Yan et al., 2015). However, no such lines are observed in ASASN-15lh. Interaction with H-poor CSM ejected by rapidly rotating pulsational pair instability supernovae is possible (Chatzopoulos & Wheeler, 2012; Chatzopoulos et al., 2016), but the spectroscopic consequences of such interaction are poorly understood (Chatzopoulos et al., 2013), and the timescales of variability observed in the UV strongly favor against this scenario (section 2.3).
A luminous central source over-ionizing expanding ejecta is a speculative, though attractive, scenario that may explain the spectroscopic evolution of ASASSN-15lh toward a featureless continuum. As there is no precedent for this scenario, the specific spectral signatures are unclear. Certainly, the ionizing photons must be extremely energetic for no strong optical or UV lines to be observable. An analogous phenomenon may be variable UV absorption commonly seen in Seyfert galaxies (Maran et al., 1996; Crenshaw et al., 2000). In some cases variability in the form of absorption components appearing and disappearing, or decreasing outflow velocities (Gabel et al., 2003), can result from changes in the ionizing flux (Kraemer et al., 2002). ASASSN-15lh may be an extreme version of these processes.
3. Interpretation
3.1. The “Reprocessing Picture”
Although the mechanisms behind SLSNe powered by a stellar-mass compact objectsuch as a magnetar and the tidal disruption and accretion of a star by a SMBH do differ significantly, the basic physical process driving the light curves of these events may be similar. A central source of UV/X-ray radiation (an accreting SMBH or the pulsar wind nebula of a rapidly spinning neutron star, NS) is absorbed by a dense column of gas, and downgraded into optical radiation, where the lower opacity allows the radiation to more readily escape. Such a “reprocessing” picture has been applied to explain both TDEs (Loeb & Ulmer 1997; Guillochon & Ramirez-Ruiz 2013; Metzger & Stone 2016) and SLSNe (Kasen & Bildsten 2010; Woosley 2010; Metzger et al. 2014).
Consider the characteristic timescale of the central engine in a magnetar-powered SLSN and TDE scenarios. In a magnetar-powered SLSN, the central engine lifetime is the magnetic dipole spin-down timescale of the magnetar:
| (1) |
where , ms, and are, respectively, the mass, initial spin period, and dipole surface magnetic field strength of the magnetar (e.g. Spitkovsky 2006). The maximum energy of the engine is limited to the rotational energy of the NS,
| (2) |
which can vary from erg for the minimum value of the spin-period set by the mass shedding limit, depending on the mass of the NS (Metzger et al. 2015). In order to simultaneously explain the large radiated energy and duration of ASASSN-15lh with a magnetar, we require a maximally spinning neutron star () and a relatively weak magnetic field G (e.g., Metzger et al. 2015, see also Dong et al. 2016; Chatzopoulos et al. 2016; Bersten et al. 2016; Sukhbold & Woosley 2016).
In the TDE scenario, the engine lifetime is uncertain, but is commonly attributed to the fall-back time of the most tightly bound stellar debris following the disruption (e.g., Guillochon & Ramirez-Ruiz 2013; Stone et al. 2013),
| (3) |
where and are the mass of the SMBH and the star, respectively, and we have assumed a stellar mass-radius relationship appropriate to lower main-sequence stars. The maximum radiated energy is that liberated by the accretion of the half of the stellar mass which remains bound to the SMBH,
| (4) |
where the radiative efficiency for geometrically thin accretion varies from , depending on the spin of the SMBH and its orientation relative to the angular momentum of the accreting gas.
In the TDE scenario, the energetics of ASASSN-15lh are reasonably accommodated by the accretion of a solar-mass star. However, the high mass SMBH inferred from the host of ASASSN-15lh, would appear to predict a long duration of the transient 2 year, inconsistent with the much shorter observed decay time of the first peak of a few weeks. This inconsistency could be solved by considering that a main-sequence star can only be disrupted by such a massive black hole if the SMBH is spinning in a prograde direction with respect to the orbit of the disrupted star (e.g. Kesden 2012). Precession of the star during the phase of tidal compression due to the BH spin may substantially enhance the spread in the energy distribution of the stellar debris as compared to the Newtonian case, by partially aligning the direction of the hydrodynamic bounce with the velocity vector of the star (Metzger & Stone 2016; Leloudas et al. 2016). More tightly bound debris has a shorter orbital period, which could significantly speed-up the flare evolution timescale as compared to the Newtonian gravity estimate in Equation 3. Though promising, general relativistic numerical simulations are needed to confirm this possibility.
In addition to possibly speeding up the flare evolution, the high BH spin required to explain ASASSN-15lh as a TDE would (i) naturally result in a large value of the accretion efficiency , accounting for its high luminosity; (ii) possibly aid in the process of debris circularization by inducing precession of the stellar debris streams (e.g. Dai et al. 2015, Hayasaki et al. 2016, Bonnerot et al. 2016). Precession of the streams out of the orbital plane due to misaligned BH spin could also help make the geometry of the reprocessing material relatively spherical (e.g., Guillochon & Ramirez-Ruiz 2015), consistent with the low measured optical polarization of ASASSN-15lh reported by Brown et al. (2016b).
3.2. X-rays Escape and the Ionization Break-Out
In both the magnetar SLSN and TDE scenarios, UV/X-ray radiation from the central source may ionize its way through the ejecta at late times. This process can result in the direct escape of UV/soft X-ray radiation while having an indirect influence on the observed optical light curve by changing the ejecta opacity (Sec. 3.3).
Approximating the ejecta as a homogeneously expanding sphere of mass , velocity cm s-1, and radius , the neutral column density is
| (5) |
where is the neutral fraction. This is much higher than the inferred X-ray absorption column of cm-2 towards ASASSN-15lh, requiring a very low neutral fraction if the X-ray source is related to the optical transient. This is consistent with the very low N(HI) inferred by Leloudas et al. (2016) from Ly-.
The ejecta from TDEs and SLSNe are expected to have markedly different chemical composition. In a TDE the ejecta has nearly solar composition (e.g. Kochanek 2016) and the escape of soft X-rays is inhibited primarily by the bound-free opacity of neutral helium (Metzger & Stone 2016; Roth et al. 2015). By contrast, in a H-poor SLSN, X-rays are blocked more severely by neutral oxygen and carbon (Metzger et al. 2014).
A central engine with an UV/X-ray luminosity releases an energy in ionizing radiation on a timescale . If the ejecta contains a mass fraction of elements with atomic number , the radiation ionizes its way through the ejecta on a timescale
| (8) |
where and K is the temperature of electrons in the recombination layer and
| (9) |
is the ratio of absorptive and scattering opacity in the ejecta (Metzger et al., 2014).
For typical parameters and an engine similar to ASASSN-15lh with ergs, we have month in the case of a He-rich composition () of a TDE-like scenario. By contrast, for a CO-rich composition of an exploding massive star (), we have months, making break-out harder to achieve. In the latter case, X-ray break-out is even less likely considering that the K-shell valence electrons of oxygen have a binding energy of keV, while the measured keV X-ray luminosity of ASASSN-15lh erg s-1 is much less than the optical/UV luminosity (in other words, the true value of to use in Equation 8 should be much lower than erg).
We conclude that an ionization break-out could allow the escape of X-rays in the TDE scenario, but is probably not sufficient to do so in the case of a H-poor supernova given the observed soft X-ray spectrum.
3.3. The double-humped light-curve of ASASSN-15lh
The ionization of the ejecta reduces the bound-free opacity, allowing the escape to the observer of UV and X-ray radiation with energies above the ionization threshold. This process is unlikely to explain the observed UV re-brightening by itself, as even the highest frequency UV bands of Swift-UVOT are below the first ionization energies of the most abundant elements (H, He, C, O). However, an ionization break-out may have an indirect effect on the light-curve via the continuum opacity.
At early times the ejecta is largely neutral and the opacity at optical frequencies is dominated by electron scattering, while the opacity at UV frequencies is dominated by line transitions of metals. However, once the ejecta becomes ionized by the central engine, the electron scattering opacity will increase, while the UV opacity will decrease as the ionized atoms have fewer bound-bound transitions. Therefore, following ionization break-out we expect a shift of the peak of the spectral energy distribution from optical to UV frequencies. The appeal of this model is that a single central-engine timescale would naturally reproduce the double-peaked temporal structure of ASASSN-15lh, which has no analogue in previously observed TDE or SLSN light curves. As a comparison, the TDE model invoked by Leloudas et al. (2016) combines two luminosity mechanisms, which result into two different timescales.
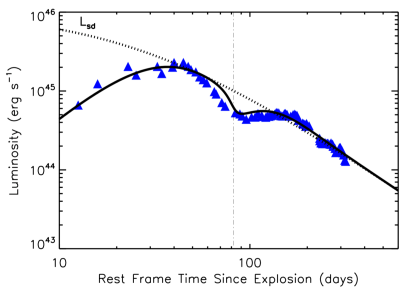
While accurate modeling, beyond the scope of this paper, is necessary to understand if this effect alone can quantitatively explain the observations of ASASSN-15lh, here we consider a toy model to illustrate the basic principles. For illustrative purposes we use the spin down luminosity of a magnetar as the central source of ionizing photons. In particular, we consider a magnetar light-curve with parameters ms and G, similar to that described in Metzger et al. (2015), and a total ejecta mass of . However, we artificially change the grey opacity from cm2 g-1 to cm2 g-1 at a time corresponding to ionization break-out of about 50 days. As shown in Fig. 7, this produces a minimum/flattening in the bolometric light curve, similar to that observed in ASASSN-15lh. Although we have applied the model to a magnetar for concreteness (and since the process of debris circularization in TDEs remains uncertain), a similar result applies to the TDE case if the central UV/X-ray accretion power smoothly rises on a timescale of a few weeks and then decays at later times. We also caution that a simple change in the grey opacity is unlikely to accurately predict the effect of wavelength-dependent opacity change created by an ionization break-out.
4. Summary and Conclusions
We presented evidence for luminous, soft and persistent X-ray emission at the location of ASASSN-15lh, and discussed its origin in the context of multi-wavelength observations of the transient, which include constraints on its radio emission and early and late-time optical spectroscopy. Our re-analysis of early-time spectra does not confirm the robust association of ASASSN-15lh with SLSNe claimed by previous studies, and invites us to be open-minded about the nature of ASASSN-15lh. Late-time spectra reveal the emergence of narrow emission features from the host galaxy, while we associate the most prominent broad spectral features to the underlying stellar population. No clear evidence is found for broad spectral features associated with the transient at late times.
We propose a model that explains the double-peaked temporal structure of ASASSN-15lh in the optical/UV band as originating from the temporal evolution of the ejecta opacity, which changes as a result of persistent ionizing flux from a long-lived central source (either a magnetar or an accreting SMBH). We speculate that the evolution of ASASSN-15lh towards a featureless spectrum also results from the presence of a persistent central source of ionizing photons. The exceptionally long active time-scale and high luminosity of the ionizing central source powering ASASSN-15lh (i.e. months) is most likely the key physical property that distinguishes ASASSN-15lh from all the TDEs and SLSNe discovered so far.
The optical/UV spectral evolution of ASASSN-15lh, its peculiar re-brightening and the presence of soft and persistent X-ray emission are indeed unprecedented among SLSNe and TDEs and suggest two scenarios: (i) either ASASSN-15lh is the first member of a class of stellar explosions with extreme properties that are intrinsically rare or that have been overlooked because of the very close location to the host-galaxy nucleus or, alternatively, (ii) ASASSN-15lh results from refreshed nuclear activity of the host-galaxy SMBH.
In the first scenario the detected X-ray emission is physically unrelated to the transient and most likely originates from the host galaxy nucleus. We thus expect no fading of the X-ray source over the time scales of years.
Instead, if the X-ray emission is physically associated with the optical/UV transient, then ASASSN-15lh is unlikely to originate from a stellar explosion and an association with the activity of the host nucleus is favored. In this case, ASASSN-15lh would be a TDE from the most massive spinning SMBH observed to date. The fast initial decay timescale of the transient is challenging to understand based on the fall-back timescale of the disrupted star in Newtonian gravity, possibly suggesting that BH spin plays a key role in enhancing the energy spread of the disrupted star. ASASSN-15lh and similar events discovered in the future would then constitute direct probes of matter under strong gravity around very massive, dormant, spinning SMBH in galaxies. We emphasize that this scenario predicts significant temporal evolution of the X-ray emission over the next few years, as we expect a TDE to have a non-negligible impact on the inner part of the accretion disk even in the case of a pre-existing weak AGN.
Continued deep X-ray monitoring of ASASSN-15lh will constrain the temporal evolution of the X-ray source and its fading, revealing in this way if the X-ray source is indeed physically related to the optical/UV transient. Future X-ray observations thus hold the keys to unveil the true nature of ASASSN-15lh.
References
- Alexander et al. (2016) Alexander, K. D., Berger, E., Guillochon, J., Zauderer, B. A., & Williams, P. K. G. 2016, ApJ, 819, L25
- Allington-Smith et al. (1994) Allington-Smith, J., et al. 1994, PASP, 106, 983
- Berger et al. (2012) Berger, E., Zauderer, A., Pooley, G. G., Soderberg, A. M., Sari, R., Brunthaler, A., & Bietenholz, M. F. 2012, ApJ, 748, 36
- Bersten et al. (2016) Bersten, M. C., Benvenuto, O. G., Orellana, M., & Nomoto, K. 2016, ApJ, 817, L8
- Bonnerot et al. (2016) Bonnerot, C., Rossi, E. M., Lodato, G., & Price, D. J. 2016, MNRAS, 455, 2253
- Branch et al. (2000) Branch, D., Jeffery, D. J., Blaylock, M., & Hatano, K. 2000, PASP, 112, 217
- Breeveld et al. (2011) Breeveld, A. A., Landsman, W., Holland, S. T., Roming, P., Kuin, N. P. M., & Page, M. J. 2011, in American Institute of Physics Conference Series, Vol. 1358, American Institute of Physics Conference Series, ed. J. E. McEnery, J. L. Racusin, & N. Gehrels, 373
- Brown et al. (2016a) Brown, J. S., W.-S Holoien, T., Auchettl, K., Stanek, K. Z., Kochanek, C. S., Shappee, B. J., Prieto, J. L., & Grupe, D. 2016a, ArXiv e-prints
- Brown et al. (2009) Brown, P. J., et al. 2009, AJ, 137, 4517
- Brown et al. (2016b) Brown, P. J., et al. 2016b, ArXiv e-prints
- Bruzual & Charlot (2003) Bruzual, G., & Charlot, S. 2003, MNRAS, 344, 1000
- Burrows et al. (2005) Burrows, D. N., et al. 2005, Space Sci. Rev., 120, 165
- Cenko et al. (2012) Cenko, S. B., et al. 2012, ApJ, 753, 77
- Chabrier (2003) Chabrier, G. 2003, PASP, 115, 763
- Chandra & Frail (2012) Chandra, P., & Frail, D. A. 2012, ApJ, 746, 156
- Chatzopoulos & Wheeler (2012) Chatzopoulos, E., & Wheeler, J. C. 2012, ApJ, 760, 154
- Chatzopoulos et al. (2013) Chatzopoulos, E., Wheeler, J. C., Vinko, J., Horvath, Z. L., & Nagy, A. 2013, ApJ, 773, 76
- Chatzopoulos et al. (2016) Chatzopoulos, E., Wheeler, J. C., Vinko, J., Nagy, A. P., Wiggins, B. K., & Even, W. P. 2016, ArXiv e-prints
- Chevalier & Fransson (2006) Chevalier, R. A., & Fransson, C. 2006, ApJ, 651, 381
- Chomiuk et al. (2011) Chomiuk, L., et al. 2011, ApJ, 743, 114
- Chomiuk et al. (2012) Chomiuk, L., Soderberg, A., Margutti, R., Berger, E., Milisavljevic, D., & Sanders, N. 2012, The Astronomer’s Telegram, 3931
- Chornock et al. (2014) Chornock, R., et al. 2014, ApJ, 780, 44
- Crenshaw et al. (2000) Crenshaw, D. M., Kraemer, S. B., Hutchings, J. B., Danks, A. C., Gull, T. R., Kaiser, M. E., Nelson, C. H., & Weistrop, D. 2000, ApJ, 545, L27
- Dai et al. (2015) Dai, L., McKinney, J. C., & Miller, M. C. 2015, ApJ, 812, L39
- Dai et al. (2016) Dai, Z. G., Wang, S. Q., Wang, J. S., Wang, L. J., & Yu, Y. W. 2016, ApJ, 817, 132
- Dong et al. (2016) Dong, S., et al. 2016, Science, 351, 257
- Drout et al. (2014) Drout, M. R., et al. 2014, ApJ, 794, 23
- Dwarkadas & Gruszko (2012) Dwarkadas, V. V., & Gruszko, J. 2012, MNRAS, 419, 1515
- Filippenko (1982) Filippenko, A. V. 1982, PASP, 94, 715
- Gabel et al. (2003) Gabel, J. R., et al. 2003, ApJ, 595, 120
- Gal-Yam (2012) Gal-Yam, A. 2012, Science, 337, 927
- Gezari et al. (2012) Gezari, S., et al. 2012, Nature, 485, 217
- Godoy-Rivera et al. (2016) Godoy-Rivera, D., et al. 2016, ArXiv e-prints
- Guillochon & Ramirez-Ruiz (2013) Guillochon, J., & Ramirez-Ruiz, E. 2013, ApJ, 767, 25
- Guillochon & Ramirez-Ruiz (2015) Guillochon, J., & Ramirez-Ruiz, E. 2015, ApJ, 809, 166
- Hayasaki et al. (2016) Hayasaki, K., Stone, N., & Loeb, A. 2016, MNRAS, 461, 3760
- Holoien et al. (2016a) Holoien, T. W.-S., et al. 2016a, ArXiv e-prints
- Holoien et al. (2016b) Holoien, T. W.-S., et al. 2016b, MNRAS, 455, 2918
- Holoien et al. (2014) Holoien, T. W.-S., et al. 2014, MNRAS, 445, 3263
- Jeffery et al. (2007) Jeffery, D. J., Ketchum, W., Branch, D., Baron, E., Elmhamdi, A., & Danziger, I. J. 2007, The Astrophysical Journal Supplement Series, 171, 493
- Kalberla et al. (2005) Kalberla, P. M. W., Burton, W. B., Hartmann, D., Arnal, E. M., Bajaja, E., Morras, R., & Pöppel, W. G. L. 2005, A&A, 440, 775
- Kasen & Bildsten (2010) Kasen, D., & Bildsten, L. 2010, ApJ, 717, 245
- Kennicutt (1998) Kennicutt, R. C., Jr. 1998, ARA&A, 36, 189
- Kesden (2012) Kesden, M. 2012, Phys. Rev. D, 86, 064026
- Kewley et al. (2006) Kewley, L. J., Groves, B., Kauffmann, G., & Heckman, T. 2006, MNRAS, 372, 961
- Kim & Fabbiano (2004) Kim, D.-W., & Fabbiano, G. 2004, ApJ, 611, 846
- Kochanek (2016) Kochanek, C. S. 2016, MNRAS, 458, 127
- Komossa (2015) Komossa, S. 2015, Journal of High Energy Astrophysics, 7, 148
- Kool et al. (2015) Kool, E. C., Ryder, S. D., Stockdale, C. J., Romero-Canizales, C., Prieto, J. L., & Kotak, R. 2015, The Astronomer’s Telegram, 8388
- Kozyreva et al. (2016) Kozyreva, A., Hirschi, R., Blinnikov, S., & den Hartogh, J. 2016, MNRAS, 459, L21
- Kraemer et al. (2002) Kraemer, S. B., Crenshaw, D. M., George, I. M., Netzer, H., Turner, T. J., & Gabel, J. R. 2002, ApJ, 577, 98
- Kriek et al. (2009) Kriek, M., van Dokkum, P. G., Labbé, I., Franx, M., Illingworth, G. D., Marchesini, D., & Quadri, R. F. 2009, ApJ, 700, 221
- Leaman et al. (2011) Leaman, J., Li, W., Chornock, R., & Filippenko, A. V. 2011, MNRAS, 412, 1419
- Leloudas et al. (2016) Leloudas, G., et al. 2016, ArXiv e-prints
- Levan et al. (2013) Levan, A. J., Read, A. M., Metzger, B. D., Wheatley, P. J., & Tanvir, N. R. 2013, ApJ, 771, 136
- Loeb & Ulmer (1997) Loeb, A., & Ulmer, A. 1997, ApJ, 489, 573
- Lunnan et al. (2014) Lunnan, R., et al. 2014, ApJ, 787, 138
- Lunnan et al. (2015) Lunnan, R., et al. 2015, ApJ, 804, 90
- Mangano et al. (2016) Mangano, V., Burrows, D. N., Sbarufatti, B., & Cannizzo, J. K. 2016, ApJ, 817, 103
- Maran et al. (1996) Maran, S. P., Crenshaw, D. M., Mushotzky, R. F., Reichert, G. A., Carpenter, K. G., Smith, A. M., Hutchings, J. B., & Weymann, R. J. 1996, ApJ, 465, 733
- Margutti et al. (2016) Margutti, R., et al. 2016, ArXiv e-prints
- Margutti et al. (2014a) Margutti, R., et al. 2014a, ApJ, 780, 21
- Margutti et al. (2014b) Margutti, R., et al. 2014b, ApJ, 797, 107
- Margutti et al. (2013a) Margutti, R., et al. 2013a, ApJ, 778, 18
- Margutti et al. (2013b) Margutti, R., et al. 2013b, MNRAS, 428, 729
- Melchior et al. (2015) Melchior, P., Drlica-Wagner, A., Bechtol, K., Rykoff, E., Hartley, W., & Dark Energy Survey Collaboration. 2015, The Astronomer’s Telegram, 7843
- Metzger et al. (2015) Metzger, B. D., Margalit, B., Kasen, D., & Quataert, E. 2015, MNRAS, 454, 3311
- Metzger & Stone (2016) Metzger, B. D., & Stone, N. C. 2016, MNRAS, 461, 948
- Metzger et al. (2014) Metzger, B. D., Vurm, I., Hascoët, R., & Beloborodov, A. M. 2014, MNRAS, 437, 703
- Miller et al. (2015) Miller, J. M., et al. 2015, Nature, 526, 542
- Nicholl et al. (2016) Nicholl, M., et al. 2016, ArXiv e-prints
- Pasham et al. (2015) Pasham, D. R., et al. 2015, ApJ, 805, 68
- Pastorello et al. (2010) Pastorello, A., et al. 2010, ApJ, 724, L16
- Perley et al. (2016) Perley, D. A., et al. 2016, ArXiv e-prints
- Quimby et al. (2011) Quimby, R. M., et al. 2011, Nature, 474, 487
- Rees (1988) Rees, M. J. 1988, Nature, 333, 523
- Roth et al. (2015) Roth, N., Kasen, D., Guillochon, J., & Ramirez-Ruiz, E. 2015, ArXiv e-prints
- Schlafly & Finkbeiner (2011) Schlafly, E. F., & Finkbeiner, D. P. 2011, ApJ, 737, 103
- Spitkovsky (2006) Spitkovsky, A. 2006, ApJ, 648, L51
- Stone et al. (2013) Stone, N., Sari, R., & Loeb, A. 2013, MNRAS, 435, 1809
- Sukhbold & Woosley (2016) Sukhbold, T., & Woosley, S. E. 2016, ApJ, 820, L38
- Thomas et al. (2011) Thomas, R. C., Nugent, P. E., & Meza, J. C. 2011, PASP, 123, 237
- van Eerten et al. (2010) van Eerten, H., Zhang, W., & MacFadyen, A. 2010, ApJ, 722, 235
- van Velzen et al. (2016) van Velzen, S., et al. 2016, Science, 351, 62
- van Velzen et al. (2013) van Velzen, S., Frail, D. A., Körding, E., & Falcke, H. 2013, A&A, 552, A5
- Woosley (2010) Woosley, S. E. 2010, ApJ, 719, L204
- Yan et al. (2015) Yan, L., et al. 2015, ArXiv e-prints
- Yaron & Gal-Yam (2012) Yaron, O., & Gal-Yam, A. 2012, PASP, 124, 668
- Zauderer et al. (2013) Zauderer, B. A., Berger, E., Margutti, R., Pooley, G. G., Sari, R., Soderberg, A. M., Brunthaler, A., & Bietenholz, M. F. 2013, ApJ, 767, 152
Appendix A X-ray and UV/optical Photometry Tables
| Date (MJD) | Instrument | Exposure (ks) | Unabsorbed Flux () | Spectral Model |
|---|---|---|---|---|
| 57046-57591 | Swift/XRT | 270 | BB | |
| PL | ||||
| 57338 | CXO | 10 | PL | |
| BB | ||||
| 57344 | XMM | 9 | PL | |
| BB | ||||
| 57369 | CXO | 10 | PL | |
| BB | ||||
| 57438 | CXO | 40 | PL | |
| BB | ||||
| 57619 | CXO | 30 | PL | |
| BB |
| Date | v (mag) | Date | b (mag) | Date | u (mag) | Date | w1 (mag) | Date | w2 (mag) | Date | m2 (mag) |
|---|---|---|---|---|---|---|---|---|---|---|---|
| 197.10444Dates are in MJD-57000 (days). | 16.86(0.07) | 197.09 | 16.76(0.04) | 197.09 | 15.39(0.04) | 197.09 | 15.27(0.04) | 197.10 | 15.63(0.04) | 197.10 | 15.25(0.04) |
| 199.79 | 16.85(0.07) | 199.79 | 16.82(0.04) | 199.79 | 15.43(0.04) | 199.79 | 15.33(0.04) | 199.79 | 15.67(0.04) | 199.79 | 15.35(0.04) |
| 201.82 | 16.93(0.08) | 201.82 | 16.87(0.04) | 201.82 | 15.48(0.04) | 201.82 | 15.40(0.04) | 201.82 | 15.83(0.04) | 201.82 | 15.48(0.05) |
| 205.64 | 16.98(0.08) | 205.64 | 16.94(0.05) | 205.64 | 15.54(0.04) | 205.63 | 15.56(0.04) | 205.64 | 15.88(0.04) | 205.64 | 15.58(0.04) |
| 208.66 | 17.05(0.08) | 208.66 | 17.03(0.05) | 208.66 | 15.72(0.04) | 208.66 | 15.74(0.04) | 208.66 | 16.07(0.04) | 208.67 | 15.76(0.04) |
| 211.66 | 17.07(0.09) | 211.66 | 17.05(0.05) | 211.66 | 15.77(0.04) | 211.66 | 15.83(0.05) | 211.66 | 16.18(0.05) | 211.66 | 15.94(0.04) |
| 221.69 | 17.27(0.13) | 214.68 | 17.09(0.05) | 214.68 | 15.85(0.04) | 214.67 | 15.95(0.05) | 214.68 | 16.35(0.04) | 214.68 | 16.06(0.05) |
| 223.52 | 17.32(0.10) | 221.68 | 17.29(0.07) | 216.56 | 15.90(0.03) | 219.79 | 16.26(0.06) | 217.01 | 16.48(0.04) | 221.69 | 16.52(0.05) |
| 231.07 | 17.51(0.08) | 223.51 | 17.27(0.06) | 221.68 | 16.03(0.06) | 221.68 | 16.31(0.06) | 220.69 | 16.71(0.05) | 223.52 | 16.68(0.05) |
| 244.89 | 17.54(0.11) | 229.27 | 17.41(0.06) | 220.52 | 16.08(0.04) | 223.51 | 16.45(0.05) | 223.51 | 16.90(0.05) | 229.27 | 16.99(0.05) |
| 255.12 | 17.58(0.07) | 232.89 | 17.45(0.06) | 223.51 | 16.18(0.05) | 229.27 | 16.74(0.06) | 229.27 | 17.25(0.06) | 232.90 | 17.26(0.06) |
| 268.79 | 17.59(0.12) | 244.88 | 17.71(0.07) | 229.27 | 16.39(0.05) | 232.89 | 16.99(0.06) | 232.89 | 17.50(0.06) | 244.89 | 17.70(0.06) |
| 310.35 | 17.80(0.08) | 250.70 | 17.49(0.09) | 232.89 | 16.48(0.05) | 244.88 | 17.43(0.07) | 244.88 | 17.99(0.07) | 250.71 | 17.81(0.10) |
| 383.29 | 18.18(0.32) | 253.70 | 17.66(0.10) | 244.88 | 16.76(0.06) | 250.70 | 17.31(0.10) | 250.71 | 18.07(0.11) | 253.63 | 17.76(0.13) |
| 214.68 | 17.16(0.09) | 259.40 | 17.87(0.08) | 250.70 | 16.83(0.09) | 253.67 | 17.43(0.08) | 253.70 | 18.11(0.12) | 259.41 | 18.09(0.08) |
| 226.52 | 17.39(0.07) | 265.56 | 17.82(0.07) | 253.70 | 16.68(0.08) | 259.40 | 17.55(0.08) | 259.40 | 18.46(0.10) | 268.79 | 18.08(0.09) |
| 241.13 | 17.57(0.09) | 268.79 | 17.89(0.08) | 259.40 | 16.97(0.07) | 265.56 | 17.51(0.07) | 267.22 | 18.29(0.08) | 283.28 | 17.45(0.06) |
| 248.47 | 17.51(0.09) | 309.34 | 18.06(0.06) | 265.56 | 17.05(0.06) | 268.78 | 17.51(0.07) | 283.88 | 17.82(0.04) | 290.87 | 17.37(0.06) |
| 262.73 | 17.67(0.10) | 313.24 | 17.95(0.09) | 268.79 | 17.00(0.07) | 282.88 | 17.18(0.06) | 290.88 | 17.71(0.06) | 293.56 | 17.03(0.06) |
| 272.67 | 17.68(0.10) | 383.28 | 18.59(0.16) | 282.88 | 16.89(0.05) | 283.41 | 17.14(0.06) | 293.57 | 17.56(0.06) | 296.62 | 17.06(0.06) |
| 277.36 | 17.55(0.07) | 226.52 | 17.35(0.04) | 283.41 | 16.93(0.05) | 290.87 | 17.16(0.06) | 296.63 | 17.50(0.05) | 299.51 | 17.14(0.06) |
| 284.57 | 17.77(0.07) | 241.12 | 17.58(0.05) | 290.87 | 16.93(0.05) | 293.56 | 17.03(0.06) | 299.52 | 17.51(0.05) | 302.57 | 17.06(0.06) |
| 298.65 | 17.84(0.11) | 248.47 | 17.60(0.05) | 293.56 | 16.99(0.05) | 296.62 | 16.90(0.05) | 302.57 | 17.55(0.05) | 307.46 | 16.97(0.05) |
| 305.49 | 17.90(0.10) | 262.73 | 17.88(0.06) | 296.62 | 17.02(0.05) | 299.51 | 16.96(0.06) | 307.45 | 17.28(0.06) | 309.68 | 16.95(0.06) |
| 317.77 | 17.93(0.14) | 272.67 | 17.83(0.05) | 299.52 | 16.96(0.05) | 302.57 | 17.00(0.05) | 309.68 | 17.30(0.07) | 311.31 | 16.81(0.05) |
| 330.19 | 17.93(0.11) | 277.36 | 17.72(0.05) | 302.57 | 16.90(0.05) | 307.45 | 16.93(0.06) | 311.31 | 17.20(0.06) | 313.24 | 16.93(0.05) |
| 346.20 | 17.92(0.10) | 284.57 | 17.86(0.05) | 307.45 | 16.91(0.06) | 309.67 | 16.81(0.07) | 313.24 | 17.27(0.06) | 353.56 | 16.96(0.07) |
| 371.42 | 18.19(0.17) | 298.64 | 18.09(0.07) | 309.68 | 16.84(0.08) | 311.30 | 16.85(0.06) | 353.63 | 17.30(0.10) | 356.22 | 17.12(0.07) |
| 393.66 | 18.10(0.15) | 255.69 | 17.74(0.05) | 311.30 | 16.92(0.07) | 313.23 | 16.83(0.06) | 356.23 | 17.21(0.05) | 359.31 | 17.04(0.07) |
| 447.41 | 18.49(0.29) | 305.49 | 17.98(0.06) | 313.23 | 16.93(0.07) | 353.56 | 16.91(0.07) | 359.32 | 17.29(0.06) | 362.84 | 17.21(0.08) |
| 398.03 | 18.02(0.11) | 317.77 | 17.91(0.07) | 353.57 | 16.94(0.09) | 356.23 | 16.96(0.06) | 362.84 | 17.23(0.06) | 365.09 | 17.19(0.07) |
| 432.60 | 18.59(0.19) | 330.18 | 18.08(0.08) | 356.23 | 17.01(0.06) | 359.32 | 17.05(0.06) | 365.73 | 17.26(0.06) | 374.40 | 17.14(0.07) |
| 452.20 | 18.33(0.17) | 346.19 | 18.10(0.06) | 359.32 | 16.89(0.06) | 362.84 | 16.96(0.07) | 374.41 | 17.51(0.06) | 377.19 | 17.23(0.07) |
| 456.92 | 18.24(0.17) | 366.43 | 18.15(0.11) | 362.84 | 17.22(0.08) | 365.10 | 17.13(0.07) | 377.20 | 17.42(0.05) | 380.91 | 17.16(0.07) |
| 472.23 | 18.35(0.39) | 371.41 | 18.36(0.10) | 365.10 | 17.16(0.07) | 368.95 | 16.99(0.07) | 380.92 | 17.53(0.06) | 384.52 | 17.31(0.09) |
| 477.55 | 18.22(0.26) | 393.66 | 18.35(0.11) | 368.95 | 17.04(0.07) | 374.40 | 17.17(0.07) | 384.51 | 17.35(0.06) | 226.52 | 16.89(0.05) |
| 533.61 | 18.74(0.51) | 427.75 | 18.64(0.13) | 374.41 | 17.23(0.07) | 377.19 | 17.29(0.08) | 226.52 | 17.16(0.05) | 241.13 | 17.61(0.05) |
| 552.75 | 18.26(0.25) | 447.41 | 19.10(0.22) | 377.20 | 17.20(0.08) | 380.92 | 17.25(0.07) | 241.12 | 17.77(0.06) | 248.48 | 17.83(0.06) |
| 554.88 | 18.02(0.17) | 396.75 | 18.56(0.13) | 380.92 | 17.22(0.08) | 384.51 | 17.18(0.08) | 248.47 | 18.12(0.06) | 262.73 | 18.16(0.07) |
| 557.37 | 18.52(0.17) | 399.25 | 18.62(0.14) | 384.51 | 17.22(0.09) | 226.52 | 16.62(0.05) | 262.73 | 18.38(0.07) | 272.68 | 17.88(0.07) |
| 560.22 | 18.57(0.19) | 433.43 | 18.86(0.10) | 226.52 | 16.30(0.04) | 241.12 | 17.25(0.05) | 272.67 | 18.22(0.06) | 277.33 | 17.62(0.07) |
| 563.21 | 18.82(0.40) | 452.19 | 18.91(0.14) | 241.12 | 16.63(0.05) | 248.47 | 17.43(0.06) | 277.36 | 17.87(0.05) | 284.57 | 17.32(0.05) |
| 569.44 | 18.42(0.27) | 456.91 | 18.91(0.13) | 248.47 | 16.78(0.05) | 262.73 | 17.55(0.06) | 298.64 | 17.54(0.05) | 298.65 | 17.11(0.05) |
| 472.22 | 19.14(0.30) | 262.73 | 17.08(0.06) | 272.67 | 17.39(0.05) | 255.70 | 18.29(0.07) | 255.66 | 18.02(0.09) | ||
| 477.55 | 19.03(0.21) | 272.88 | 17.01(0.07) | 277.35 | 17.15(0.05) | 305.49 | 17.34(0.05) | 305.50 | 17.03(0.06) | ||
| 533.61 | 18.79(0.23) | 277.36 | 16.95(0.05) | 284.37 | 17.11(0.05) | 317.77 | 17.39(0.06) | 317.77 | 16.83(0.09) | ||
| 552.75 | 19.01(0.19) | 284.37 | 16.97(0.05) | 298.64 | 17.01(0.05) | 330.19 | 17.28(0.05) | 330.19 | 16.97(0.05) | ||
| 554.88 | 19.13(0.16) | 298.64 | 16.88(0.05) | 255.69 | 17.51(0.06) | 346.20 | 17.35(0.05) | 346.20 | 16.98(0.06) | ||
| 557.36 | 19.09(0.12) | 255.69 | 16.91(0.05) | 284.77 | 17.12(0.06) | 371.42 | 17.41(0.05) | 371.43 | 17.25(0.07) | ||
| 560.22 | 19.12(0.13) | 272.60 | 16.96(0.05) | 305.48 | 16.87(0.05) | 316.24 | 17.27(0.05) | 316.23 | 16.98(0.07) | ||
| 563.21 | 19.04(0.21) | 284.77 | 16.95(0.05) | 317.73 | 17.02(0.06) | 319.77 | 17.43(0.06) | 319.76 | 17.13(0.07) | ||
| 569.43 | 19.41(0.24) | 305.49 | 16.87(0.05) | 330.18 | 16.92(0.05) | 325.34 | 17.52(0.06) | 322.75 | 17.19(0.07) | ||
| 317.77 | 16.94(0.06) | 346.19 | 17.02(0.05) | 328.53 | 17.30(0.05) | 325.33 | 17.22(0.07) | ||||
| 330.18 | 17.00(0.06) | 366.39 | 17.08(0.07) | 331.06 | 17.24(0.05) | 328.52 | 16.96(0.06) | ||||
| 346.19 | 16.97(0.05) | 371.41 | 17.16(0.06) | 334.58 | 17.32(0.06) | 331.05 | 17.03(0.07) | ||||
| 366.43 | 17.18(0.08) | 316.23 | 16.95(0.06) | 343.44 | 17.34(0.06) | 334.58 | 17.02(0.07) | ||||
| 371.41 | 17.17(0.07) | 321.23 | 16.98(0.06) | 349.22 | 17.27(0.06) | 343.43 | 17.06(0.06) | ||||
| 316.24 | 16.87(0.06) | 325.34 | 16.98(0.06) | 393.66 | 17.55(0.05) | 349.21 | 16.94(0.07) | ||||
| 319.76 | 17.01(0.06) | 328.53 | 16.78(0.06) | 427.75 | 18.16(0.07) | 393.67 | 17.37(0.07) | ||||
| 325.34 | 16.92(0.06) | 331.05 | 16.82(0.06) | 447.41 | 18.06(0.07) | 427.75 | 17.83(0.08) | ||||
| 328.53 | 16.86(0.05) | 334.58 | 16.80(0.06) | 396.76 | 17.55(0.06) | 447.41 | 17.87(0.08) | ||||
| 331.05 | 16.86(0.06) | 343.43 | 16.93(0.06) | 399.25 | 17.41(0.06) | 396.76 | 17.31(0.07) | ||||
| 334.58 | 16.97(0.06) | 349.21 | 16.88(0.06) | 429.65 | 18.06(0.09) | 399.25 | 17.29(0.07) | ||||
| 343.43 | 17.03(0.06) | 393.66 | 17.27(0.06) | 433.51 | 18.15(0.09) | 429.65 | 17.83(0.10) | ||||
| 349.21 | 16.98(0.06) | 427.74 | 17.59(0.07) | 437.32 | 18.16(0.08) | 435.30 | 17.84(0.08) | ||||
| 393.66 | 17.37(0.07) | 447.41 | 17.73(0.09) | 450.04 | 18.09(0.08) | 450.04 | 18.00(0.09) | ||||
| 427.75 | 17.73(0.09) | 396.75 | 17.20(0.07) | 454.22 | 18.17(0.08) | 454.22 | 17.90(0.09) | ||||
| 447.41 | 18.00(0.12) | 399.25 | 17.27(0.07) | 457.64 | 18.19(0.10) | 456.09 | 17.89(0.09) | ||||
| 396.75 | 17.36(0.08) | 429.64 | 17.74(0.10) | 456.08 | 18.03(0.07) | 465.55 | 18.01(0.08) | ||||
| 399.25 | 17.33(0.07) | 433.50 | 17.76(0.10) | 465.56 | 18.17(0.07) | 470.33 | 17.92(0.07) | ||||
| 431.64 | 17.85(0.10) | 437.32 | 17.71(0.09) | 470.34 | 18.19(0.06) | 472.23 | 18.05(0.16) | ||||
| 437.32 | 17.75(0.11) | 450.03 | 17.82(0.12) | 472.23 | 18.18(0.13) | 475.67 | 17.94(0.08) | ||||
| 450.03 | 17.85(0.13) | 454.21 | 17.78(0.09) | 475.68 | 18.29(0.07) | 477.55 | 18.06(0.11) | ||||
| 454.21 | 17.80(0.11) | 457.64 | 17.92(0.12) | 477.55 | 18.26(0.10) | 480.30 | 18.20(0.09) | ||||
| 456.91 | 17.81(0.08) | 456.07 | 17.83(0.08) | 480.30 | 18.39(0.07) | 487.48 | 18.29(0.15) |