ALMA view of the Galactic Center 50km/s molecular cloud
keywords:
Galaxy: center, ISM: clouds, ISM: structureWe have observed the Galactic Center 50km/s molecular cloud (50MC) with ALMA to search for filamentary structures. In the CS emission line channel maps, we succeeded in identifying 27 molecular cloud filaments using the DisPerSE algorithm. This is the first attempt of “filament-finding” in the Galactic Center Region. These molecular cloud filaments strongly suggest that the molecular cloud filaments are also ubiquitous in the molecular clouds of the Galactic Center Region.
1 Introduction
In molecular clouds of the Galactic Disk Region(GDR), a number of filamentary structures have been found by Herschel survey observations ([Pilbratt et al. 2010]). It has been revealed that the molecular clouds ubiquitously exist as filamentary structures in the GDR with or without star formation. The widths of these filamentary structures are always pc even though the column densities vary by 1 or more orders of magnitude () ([Pilbratt et al. 2011]). Prestellar dense cores and deeply embedded protostars exist along with the filamentary structures of which column densities are more than . In contrast, the non-star-forming filaments have much lower column densities which are up to ([André et al. 2011]). Thus, the column densities of the filamentary structures in the molecular clouds are closely related to the star formation in the GDR.
The Central Molecular Zone (CMZ) is a molecular cloud complex in the Galactic Center(GC) region inner pc region. In the CMZ, the molecular gas is very dense and warm and its velocity dispersion is very large compared to the GDR. Filamentary structures have not been found in the CMZ except for G0.253+0.016([Rathborne et al. 2015]) and have never been identified. Therefore, we observed the GC 50km/s molecular cloud (50MC) to search for filaments.
| region | Width | Column Density N | Line Mass | Critical Line Mass 1 |
|---|---|---|---|---|
| (pc) | () | () | () | |
| 50MC | ||||
| (ave.) | (ave.) | (ave.) | (assuming 50K) | |
| GDR |
Notes:
1 where and G are the sound velocity and the gravitational constant, respectively.
2 Filament Identification in the 50MC
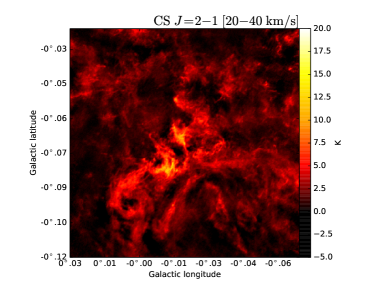
We observed the 50MC located at in ALMA cycle 1(2012.1.00080. S,PI M.Tsuboi). The whole of the 50MC was covered with mosaic observations. Many emission lines are included (, , and so on). The angular resolution is improved by a factor of 10 compared to those of the previous works. The integrated intensity map of the emission line is shown in Fig. 1(left). In the map, the 50MC is clearly resolved into fine structures down to the size of pc. In addition, many filamentary structures can be discerned in the 50MC. The existence of a number of filaments in the 50MC strongly suggests that the filamentary structures are also ubiquitous in the molecular clouds in the GC region. We corrected the CS intensity maps for the optical depth effect using the comparison between the emission line intensities of and for the following analysis.
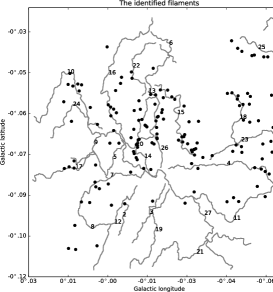
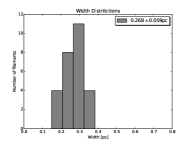
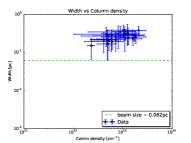
We identified the filamentary structures as molecular cloud filaments (MCF) using the DisPerSE algorithm. Finally, we found 27 MCFs shown in Fig.1(middle). We estimated the widths in FWHM of the MCFs using the Gaussian fitting. The distribution of the widths is shown in Fig.1(upper right) and the mean width of the MCFs in the 50MC ( pc) is larger than that in the Galactic disk region ( pc). In addition, the H2 column densities and line masses of the MCFs were estimated. The relation between the column density and the width is shown in Fig.1(lower right). The width range is as narrow as pc independently of the large variation of the column density. The width, column density, line mass and critical line mass of the MCFs in the CMZ and the GDR are summarized in the Table.1.
In addition, almost all MCFs in the 50MC are supercritical filaments () and 89 cores (56.0 %) among the 159 dense cores identified are located on the MCFs shown in Fig.1(middle). The high mass star formation is expected on the MCFs in the 50MC.
References
- [André et al. 2011] André, P., Men’shchikov, A., Bontemps, S., et al. 2010, A&A, 518, L102
- [Pilbratt et al. 2011] Arzoumanian, D., André, P., Didelon, P., et al. 2011, A&A, 529, L6
- [Pilbratt et al. 2010] Pilbratt, G. L., Riedinger, J. R., Passvogel, T., et al. 2010, A&A, 518, L1
- [Rathborne et al. 2015] Rathborne, J. M., Longmore, S. N., Jackson, J. M., et al. 2015, Apj, 802, 125