Transcriptional and translational regulation in Arc protein network of Escherichia coli’s stress response
Sutapa Mukherji,
Department of Protein Chemistry and Technology, Central Food Technological Research Institute, Mysore-570 020, India
* sutapa@cftri.res.in
Abstract
In the recent past, there has been a lot of effort in understanding sRNA mediated regulation of gene expression and how this mode of regulation differs from transcriptional regulation. In Escherichia coli, in the presence of oxidative stress, the synthesis of the sigma factor, , is regulated through an interesting mechanism wherein sRNA mediated translational regulation is combined with transcriptional regulation. The key regulatory factors involved in transcriptional and translational regulation are ArcA and ArcB proteins and a small regulatory RNA (sRNA), ArcZ, respectively. The phosphorylated ArcA protein functions through a feedforward mechanism wherein it represses the transcription of ArcZ sRNA, a post-transcriptional activator for and also directly represses the transcription of . Through a feedback mechanisms, ArcZ sRNA destabilises ArcB mRNA and thus regulates the concentration of ArcB protein which is a kinase that phosphorylates ArcA. The oxygen and energy availability is expected to influence the ArcA phosphorylation rate and, as a consequence, in equilibrium, the system is likely to be in either of the two states with high ArcB (low ArcZ) or low ArcB (high ArcZ) concentration. In this work, we formulate a mathematical model that combines two distinctly different mechanisms of regulation at transcriptional and translational levels. Kinetic modelling studies show that the rate of destabilisation of ArcB mRNA by ArcZ sRNA must be appropriately tuned for the cell to achieve the desired state. In particular, in case of a high phosphorylation rate, the transition from a low ArcZ synthesis regime to a high ArcZ synthesis regime with the increase in sRNA-mRNA interaction is similar to the threshold-linear response observed earlier. Further, it is shown that the sRNA mediated mRNA destabilisation might be, in particular, beneficial in the low phosphorylation state for having the right concentration levels of ArcZ and ArcB. Stochastic simulations carried out here suggest that as the ArcZ-ArcB binding affinity is increased, the probability distribution for the number of ArcZ molecules becomes flatter indicating frequently occurring transcriptional bursts of varying strengths. Such a behavior might be useful for switching of the cell from one state to to another.
Introduction
The role of small regulatory RNAs in the regulation of protein synthesis has been explored in various contexts. So far, approximately sRNAs have been identified in Escherichia coli . In the recent past, there have been several evidences that these sRNAs regulate protein synthesis by decreasing the mRNA stability [1, 2] or repressing the translational activity [3, 4]. In certain cases, there are reports of increase in target protein concentrations due to positive regulation by sRNAs [5, 6, 7, 8, 9]. sRNA inhibits translation initiation by base-pairing with the mRNA at the ribosome binding site. In case of translational activation, it promotes ribosome binding by exposing the binding site. In many cases, sRNAs bind tightly to other molecules such as RNA chaperone Hfq which facilitate sRNA binding with mRNA molecules, protect sRNA from degradations etc. Since sRNA molecules are small (50-250 nucleotides long for bacteria) and are not translated, it is believed that sRNA provides a cost effective and rapid way of regulation of gene expression. Although transcriptional regulation by proteins has been under extensive investigation, post transcriptional regulation by sRNA is relatively less understood. It is expected that the non-catalytic nature of sRNA-mRNA interaction would be qualitatively different in nature from the catalytic protein-DNA interaction. This is also evident from some of the recent investigations [10, 11] that report threshold-linear response with tunable threshold, smoothening of gene expression etc., in sRNA mediated gene regulation. In addition, quantitative differences in the time scale of response in case of protein-DNA, sRNA-mRNA and protein-protein interactions have been reported in [12].
In E. coli, in the presence of oxidative stress, the synthesis of factor, , is regulated through an interesting mechanism that involves regulation both at transcriptional and translational levels. In general, the sigma factors are some of the key stress response regulators of the bacterial cells since they play an important role in switching various transcription initiation programs of the cells. RNA polymerase (RNAP) holoenzymes (E), formed upon binding of the core RNA polymerase to a specific sigma factor, are responsible for the transcription initiation. factors can be of different kinds such as etc. and a specific promoter recognition by depends on the particular sigma subunit has. It is found that or the RpoS subunit acts as a key regulator of stress response of E. coli [13]. As a consequence of a high cell density or environmental stress, rapidly multiplying bacterial cells enter into a stationary phase. In the stationary phase, is overexpressed compared to the housekeeping factor which plays a significant role in the growth phase. Measurements of levels of free or bound RNAPs and various sigma factors and subsequent modelling seem to indicate that various factors compete for binding to the core RNAP [14, 15]. The over-expression of in the stationary phase thus results in an increase in the level of holoenzyme in comparison to other forms of . Once bound to the RNAP, regulates the expression of approximately genes responsible for bacterial survival under stress conditions.
In regulatory networks, certain specific patterns of (sub)network are often found in abundance in comparison to other networks that could be constructed, in principle, by joining various nodes with edges [16, 17, 18, 19]. These frequently occurring patterns of (sub)networks are usually referred as network motifs. Examples of these motifs include autoregulatory loops, feedforward loops, feedback loops etc. An autoregulatory loop is the one in which a gene product regulates the expression of its own gene. In case of positive (or negative) autoregulation the gene product activates ( or represses) the transcription of its own gene. Feedforward loops are the ones in which a transcription factor X regulates the transcription of Z directly and also in an indirect way through the regulation of the transcription of Y which in turn regulates the transcription of Z. Thus there is a direct as well as an indirect path of regulation (via regulation of Y) of Z mediated by X. Similar feedforward loop formed by sRNA mediated regulation has also been observed recently [20]. The fact that these network motifs occur more frequently than other possible designs of networks indicates that their presence is beneficial for regulation in comparison to other networks [29]. The regulatory network described below involves two such nontrivially coupled network motifs involving transcriptional and translational regulation.
The cytosolic response regulator, ArcA, and the sensor kinase, ArcB, are known to play important roles in rapid response to oxygen availability to the cell [21, 22, 23, 24, 25]. A two component system formed of ArcA and ArcB has been found to regulate synthesis in E.coli for stress under oxygen and energy supply [26]. Further, recent experiments suggest that in addition to ArcA and ArcB, there exists also a third regulator, a small regulatory RNA (sRNA) known as ArcZ [27]. As shown in figure (1), the network comprises of coupled feedforward and feedback loops involving the three key regulators ArcA, ArcB and ArcZ. The sensor kinase, ArcB, upon autophosphorylation, phosphorylates ArcA. The level of phosphorylated ArcA depends on the oxygen availability since oxidised quinones inhibit the autophosphorylase activity of ArcB. Further, the phosphorylation of ArcA depends on the energy supply since, apart from oxygen supply, the redox state of quinone also depends on the energy available to the system. The feedforward mechanism is due to the phosphorylated ArcA which regulates synthesis in two ways. It represses the transcription of directly, and also affects the synthesis of indirectly through the transcriptional repression of ArcZ which can activate translation [27]. In addition to this, there is a feed back loop through which ArcZ down regulates ArcB by destabilising ArcB mRNA. Intuitively, the design of the network shows the possibility of two distinct states. A state with a high level of ArcB and, consequently, a low level of ArcZ, is expected when the phosphorylation rate is high. With a low phosphorylation rate, we expect a state with low ArcB and high ArcZ concentrations.

The main purpose of this study is to combine two distinct regulation mechanisms involving catalytic and non-catalytic interactions to explore the role of sRNA mediated regulation over the transcriptional regulation by phosphorylated ArcA. Kinetic modelling based analysis suggests that, among all the interactions, the sRNA mediated post transcriptional repression, might be the most crucial one for reaching the desired equilibrium concentration of ArcZ or ArcB. Further, we show that the sRNA mediated regulation might be, in particular, necessary in the low phosphorylation state. This is due to the fact that with the lowering of the phosphorylation rate, the ArcZ concentration saturates to an upper limit dependent on its synthesis and degradation rate. Whether the ArcZ concentration exceeds that of ArcB protein depends on these rates as well as the synthesis and degradation rates of ArcB mRNA and ArcB protein. In such a scenario, the sRNA mediated ArcB destabilisation appears as an additional mechanism to further increase the ArcZ concentration. In the high phosphorylation state, the sRNA-mRNA interaction might not be as crucial as mentioned above since in this case ArcZ concentration can reduce to as small level as required by increasing the phosphorylation rate alone. To study how the stochastic fluctuation in sRNA synthesis is influenced by its auto regulation, we have performed stochastic simulations. Average probability distributions of ArcZ molecules over a fixed time interval are obtained for different ArcZ-ArcB binding affinities. It appears that as the sRNA-mRNA interaction increases, the probability distribution becomes flatter indicating large number of transcriptional bursts of varying strengths. This feature might have deeper implications in the context of switching of the cell from one state to another [28].
Methods
In the kinetic modelling scheme, we write the time evolution of average concentrations of various proteins, mRNAs etc. in terms of differential equations. All the reactions along with the respective rate parameters are presented in figure (2).

The time evolutions of ArcB mRNA and ArcB protein concentrations can be described as
| (1) | |||
| (2) |
where , [Z] and represent concentrations of ArcB mRNA, ArcZ sRNA and ArcB protein, respectively. Here, , denote the concentrations of ArcA and ArcA, ArcB protein complexes, respectively. Further, and denote the rate of supply and degradation, respectively, of ArcB mRNA; and represent the rate of synthesis and degradation, respectively, of ArcB protein. denotes the rate of ArcB mRNA, ArcZ sRNA complex formation. Equilibrium concentrations of various components can be obtained by solving the nonlinear equations obtained upon equating various time derivatives to zero. Using equilibrium condition for the phosphorylation process (details provided in the Supporting Information), we find from equations (1) and (2)
| (3) | |||
| (4) |
Assuming the synthesis rate of ArcZ sRNA and mRNA from active states of the respective genes to be and , respectively, we have
| (5) | |||
| (6) | |||
| (7) | |||
| (8) |
where and (see Supporting Information). Further, , and represent concentrations of mRNA, bound complexes of ArcB mRNA and ArcZ sRNA, bound complexes of mRNA and ArcZ sRNA, respectively. The first terms in (5) and (6) represent the repression activity of phosphorylated ArcA in arcZ and expression, respectively with and denoting the total number of the copies of arcZ and gene, respectively. Equilibrium conditions on (7), (8) and (5) together imply
| (9) |
Results
Steady state solution
Using the equilibrium solution for (see Supporting Information) and equations (3) and (4) for and , we have from (9)
| (10) |
Equation (10) can be solved for the equilibrium ArcZ concentration. The solution for is
| (11) |
where . Here, with , . Although the binding affinity between ArcZ and transcripts does not influence the equilibrium concentrations of ArcZ or ArcB, these concentrations depend on , the binding affinity of ArcB mRNA and ArcZ sRNA. We show in the next subsection that the interaction between ArcZ sRNA and mRNA, however, influences the time scale over which the system reaches equilibrium.
Numercal solutions for various concentrations
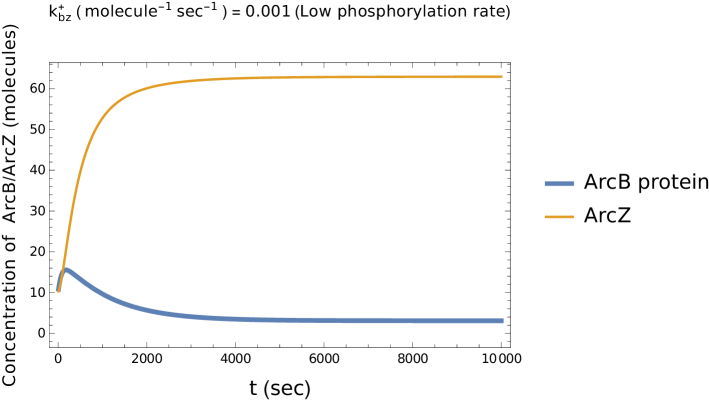
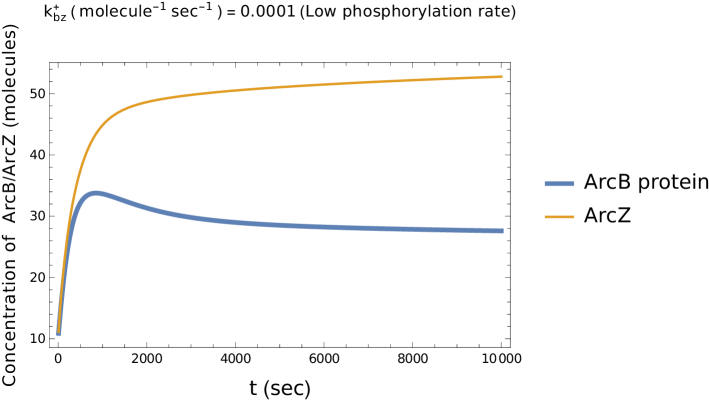
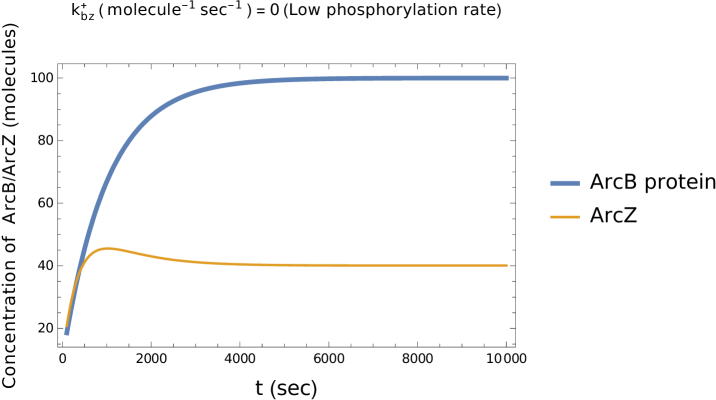
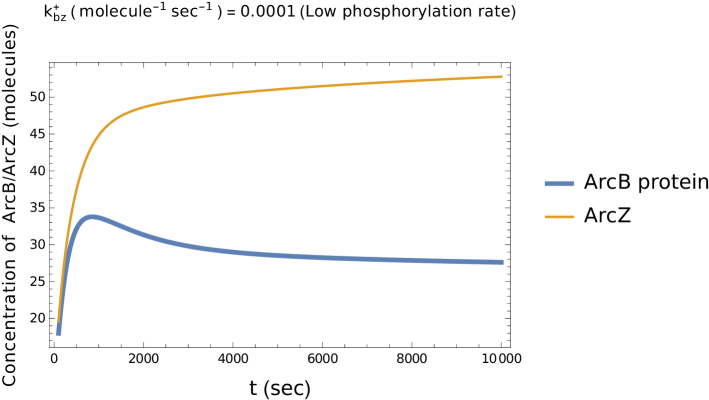
In a quasi steady-state approximation, we solve numerically the time-dependent differential equations (1), (2) and (5)-(8), assuming equilibrium condition for the phosphorylation kinetics. The parameter values used to obtain the solution are displayed in table (1). These are the average values obtained from references [29, 12, 8]. sRNA synthesis rate is considered to be times larger than the mRNA synthesis rates. Values of and are the average values obtained from [29]. Since the detachment rates typically have wide variations depending on the bond strength, we assume () [29]. Using the average values for phosphorylation and dephosphorylation rates (see reference [30]), we find . For low and high phosphorylation rates, we choose , respectively. The nature of the approach to equilibrium and also the equilibrium concentrations of various components for high and low phosphorylation rates are displayed in figures (3), and (4)).
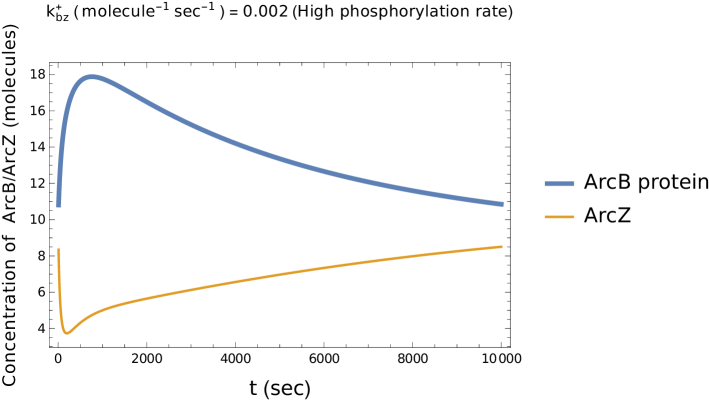
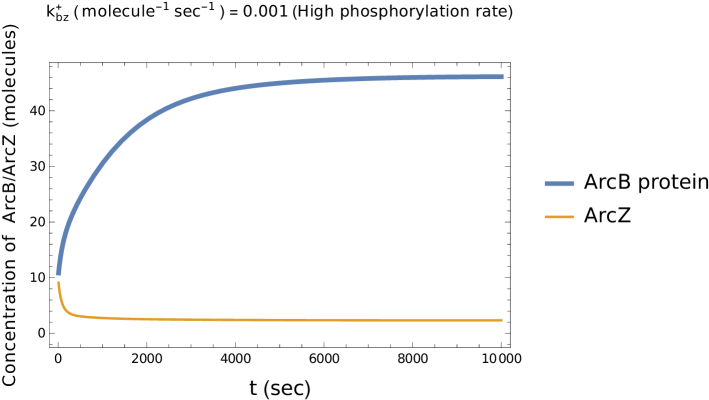
In the high phosphorylation state, the concentration of ArcB is expected to be higher than ArcZ. However, the differential equation based analysis shows that the approach to a high ArcB or a high ArcZ state crucially depends on the sign of the term in (11). For large positive values of this term, which may hold good for high phosphorylation rates, we have a low concentration of ArcZ,
| (12) |
and consequently a high concentration of ArcB due to equations (3) and (4). Further, equation (12) shows that for small binding affinity between ArcZ sRNA and ArcB mRNA i.e. (), the concentration becomes almost independent of (see figure (5)). By tuning , one may, however, see a transition to a high ArcZ state even when the phosphorylation rate is high for which originally a high ArcB state would be expected.

The steady increase in ArcZ is seen when becomes negative with increasing . In the low phosphorylation case, a similar change from a high ArcZ state to a high ArcB state is seen as the value of is decreased below a definite value. The result in equation (11) and figure (5) may be compared with the smoothening of the threshold-linear response seen in case of sRNA mediated mRNA degradation [11]. In the threshold-linear response, the gene expression is completely silenced when the target transcription rate is below a threshold. Above the threshold, mRNAs code for the protein leading to a linear increase in the protein concentration with the target transcription rate. In case of strong sRNA, mRNA interaction, the transition from one gene expression regime to the other is sharp. As the interaction between sRNA and mRNA becomes weaker, the transition becomes smoother although the threshold-linear form is preserved. Figure (5) describes a similar smooth transition from a negligible ArcZ expression regime to a high ArcZ expression regime except for the fact that beyond the threshold the change in concentration with is not linear. As we have discussed later, similar threshold behavior cannot be found by varying any other parameter present in equation (11). Since the sRNA and mRNA binding affinity can be modulated through the use of appropriate RNA chaperone, appears to be an important control parameter for achieving the right concentration level of ArcZ sRNA and ArcB protein.
Role of sRNA mediated destabilisation
In order to understand the specific role of sRNA mediated regulation, we first consider how the concentrations ArcZ and ArcB protein change with time in the absence of sRNA mediated mRNA destabilisation for high and low phosphorylation rates. In the absence of sRNA-mRNA interaction, the equilibrium concentration of ArcB protein and ArcZ are and where is the concentration of the phosphorylated ArcA (see Supporting Information). While for high phosphorylation rate the concentration of ArcZ reduces continuously, for low phosphorylation rate it approaches a maximum saturation value proportional to . Clearly, this saturation to the maximum value, in the low phosphorylation state, arises due to the catalytic nature of transcriptional repression. Thus, whether ArcZ or ArcB has higher concentration in the low phosphorylation scenario is determined completely by the synthesis and degradation rates mentioned above (see figure (6)). There is a significant increase and decrease in ArcZ and ArcB concentrations, respectively, as the ArcZ mediated ArcB destabilisation is turned on (the second panel of figure (6)). From this observation it appears that the while, in the high phosphorylation case, the phosphorylation rate alone can reduce the concentration of ArcZ sRNA, for low phosphorylation case an sRNA mediated destabilisation of mRNA might be important for reaching the required level of concentrations. Further in view of the fact that the synthesis and degradation rates are genetically controlled, this additional control through the binding affinity seems to be an effective means of ArcZ/ArcB regulation for the low phosphorylation case.
Approach to equilibrium
Below, we analyse the approach to the equilibrium by linearising equations (1), (2) and (5)-(8) about the equilibrium concentrations. The approach to the equilibrium can be described by the following matrix equation
| (13) |
where is a column matrix having elements that denote small deviations from the equilibrium concentrations and is a coefficient matrix with elements dependent on various rate constants and equilibrium concentrations denoted as . Explicit forms of these matrices are X=
and A=
The eigenvalues of this matrix give an estimate of the time scale over which the system reaches equilibrium. The dependence of several of the matrix elements on and (the binding and dissociation rates of ArcZ sRNA - mRNA complex) indicate that the eigenvalues i.e. the time scale depends on these rate constants. The numerical evaluation of the eigenvalues indicates that the approach to the equilibrium state is faster as the values of and are decreased and increased, respectively or, in other words, as the -ArcZ complex becomes more short lived.
0.1 Parameter sensitivity
The local parameter sensitivity to different parameters can be directly obtained by differentiating the concentration with respect to appropriate parameters. In order to have an idea in terms of the numbers as how various parameters affect the concentration of ArcZ, we have increased or decreased various parameter values by about the values listed in table 1. While the change in the concentration of ArcZ remains approximately within for change in , and , there might be a change in concentration (between ) as the parameters related to ArcZ synthesis, degradation, concentration of ArcA and degradation of ArcB protein (not mediated by ArcZ) are changed by . The most significant change in ArcZ concentration () is seen as the the ArcZ degradation rate is altered.
Further, it might be emphasised that overall, the most abrupt change in concentration is brought about by . This is evident from the comparison of figure (5) and (7) (figure (7) does not have distinct low and high expression regimes). Equation (11) indicates that other parameters except would also give rise to similar increase or decrease in concentration as shown in figure (7) without any threshold behavior in particular. From this it appears that in addition to the phosphorylation rate, , i.e the strength of sRNA and mRNA interaction, might be a key parameter for regulating the concentration levels of ArcZ and ArcB.

Results from stochastic simulations
In the last section, we have studied differential equations that describe the time evolution of the average concentrations of various proteins, RNAs etc. Results from stochastic simulations using Gillespie algorithm [31] describe the noisy nature of protein or mRNA concentrations. These results also show how the binding affinity between ArcB mRNA and ArcZ sRNA influences the nature of the final equilibrium state. Since ArcZ sRNA upregulates its own transcription by destabilising the ArcB mRNA, one of our aims is to study how this sRNA mediated non-catalytic reaction alters the time course of ArcZ expression whose transcription is otherwise repressed through the phosphorylation activity of ArcB kinase.
The reaction rate of the th reaction listed in the Supporting Information is denoted below as . Results of stochastic simulations done for parameter values , , , , , , , and , , , , , , , , and are presented in the following. Values of and indicating the association and dissociation rates of ArcB mRNA and ArcZ, respectively, are changed in the simulation.
Autoregulation by ArcZ sRNA
In case of only transcriptionally repressed gene expression, it is known that the protein synthesis is associated with transcriptional bursts which occur due to occasional leakage in mRNA transcription and subsequent translation of the mRNA leading to an abrupt increase in the protein concentration. In contrast to this, for sRNA mediated translational repression, the gene expression is found to be much smoother [10, 11]. In the latter case, although transcription events are frequent, sRNAs reduce the bursts. The difference in the noise properties are expected to be crucial since large transcriptional bursts may give rise to switching of the cell from one state to another [28]. A quantitative description of the noise characteristics can be obtained through the probability distribution of the protein concentrations over a time interval. It has been found that the probability distributions in case of sRNA mediated translational repression has less variance in comparison with the transcriptional repression [11].
In order to understand how the autoregulation by ArcZ sRNA influences the temporal behavior of its own synthesis, we show how the time course of arcz expression during a single run of stochastic simulation changes as the ArcZ-ArcB binding affinity is changed (see figure (8)). The figure shows that with the increase in , transcriptional bursts with widely varying strengths become more frequent.

In order to further understand the noise characterisitcs for different values of , we have obtained the probability distributions of the number of ArcZ molecules over the time course of ArcZ synthesis during a fixed time interval. Probability distributions obtained upon averaging over 20 cells (samples) are displayed in figure (9).

With the increase in ArcZ mediated ArcB destabilisation, the probability distribution becomes flatter due to frequent transcriptional bursts of varying strengths (see figure (8)).
| Reaction | Rate Constants | Parameter Values |
|---|---|---|
| ArcZ synthesis | 0.1 (molecule/sec) | |
| ArcZ degradation | 0.0025 () | |
| -mRNA synthesis | 0.02 (molecule/sec) | |
| -mRNA degradation | 0.002 () | |
| ArcB mRNA synthesis | 0.02 (molecule/sec) | |
| ArcB mRNA degradation | 0.002 () | |
| ArcB protein synthesis | 0.01 () | |
| ArcB protein degradation | 0.001 () | |
| ArcB-ArcZ mRNA complex formation | 0.01 () | |
| ArcB-ArcZ mRNA complex dissociation (ArcZ mediated degradation of ArcB) | 0.01 () | |
| mRNA-ArcZ complex formation | 1 () | |
| mRNA-ArcZ complex dissociation | 0.02 () | |
| Repression of arcZ gene by ArcA-P | 0.1 () | |
| Repression of gene by ArcA-P | 0.1 () | |
| Phosphorylation activity | 0.1 or 0.001 () |
Discussion
In this paper, we have studied how transcriptional and translational regulation combinedly influence protein and sRNA synthesis in a particular stress response network of E.coli. This network regulates the synthesis of the -factor, , in response to oxygen and energy availability to the cell. It has been found experimentally that this regulatory network functions through feedforward as well as feedback mechanisms involving ArcA, ArcB proteins and ArcZ sRNA as the major regulators. The phosphorylation activity of ArcB kinase depends on the oxygen and energy availability to the cell. Upon phosphorylation by ArcB, the phosphorylated ArcA protein functions as a transcriptional repressor for as well as for ArcZ which activates synthesis post transcriptionally. The regulation of synthesis by ArcA thus happens through a feedforward mechanism. In addition to this, ArcZ sRNA destabilises ArcB mRNA through a feedback mechanism. In case of aerobic growth, the phosphorylation activity of ArcB is reduced. As a consequence of this, ArcZ synthesis is enhanced causing enhanced downregulation of ArcB. In case of anaerobic growth, the rate of ArcA phosphorylation increases causing a significant repression of ArcZ synthesis and hence a high ArcB concentration.
The main purpose of the present study is to explore the combined effect of catalytic and non-catalytic interactions associated with transcriptional and translational regulation, respectively. Some of the recent studies [10, 11] have demonstrated that sRNA mediated non-catalytic regulation may give rise to interesting features such as tunable threshold-linear response of gene expression, smoothening of fluctuations in gene expression etc. In view of these results, it seems interesting to ask what the combined effect of both transcriptional and translational regulation would be on various gene expressions. This analysis also helps us understand the role of sRNA in attaining certain properties which cannot be attained otherwise through transcriptional regulation alone.
Our main observations are listed in the following. Qualitatively, depending on the phosphorylation activity, the system can have a high ArcZ (consequently a low ArcB) state or a low ArcZ (high ArcB) state. (a) Based on experimental observations, earlier, there were speculations that this regulation mechanism could give rise to bi-stability. The present analysis, however, leads to a single equilibrium solution for ArcZ concentration which varies continuously from a high to a low value as, for example, the phosphorylation rate is increased. ArcB concentration, being inversely related to ArcZ concentration, correspondingly increases as the phosphorylation rate is increased. In addition to the phosphorylation rates, the equilibrium concentrations depend on several other parameters such as various synthesis and degradation rates and the binding affinity between the ArcZ sRNA and its target, ArcB mRNA. We show that, among various parameters, the binding affinity between the sRNA and mRNA plays a distinct role in regulating the concentrations. In particular, in the high phosphorylation state, the dependence of ArcZ concentration on the binding affinity is similar to the smooth threshold-linear mode found earlier [10, 11]. In the present case, however, the dependence of ArcZ concentration on the binding affinity beyond the threshold is not linear. For example, although in case of high phosphorylation rate one expects a low ArcZ concentration, this might not be possible in case of strong destabilisation of ArcB mRNA by ArcZ sRNA. A strong destabilisation of ArcB by ArcZ leads to low ArcA/ArcB mediated repression of ArcZ synthesis resulting in a high ArcZ concentration. In a similar manner, in case of a low phosphorylation rate, a high ArcZ state may not be achievable if ArcZ mediated destabilisation of ArcB mRNA is weak. As has been shown, this kind of threshold behavior can affect the concentration levels abruptly. Although other synthesis and degradation rates influence the concentration levels significantly, none of these rate constants shows such threshold behavior. Further, given that the synthesis and degradation rates of various proteins and mRNAs are genetically controlled, this kind of threshold behavior due to sRNA-mRNA interaction might be particularly beneficial for stress response. (b) In contrary to the above observation, the binding affinity between ArcZ sRNA and mRNA has marginal influence on the equilibrium state. We show that this interaction influences only the time scale over which the system approaches the equilibrium. (c) We show that the sRNA mediated destabilisation of mRNA might be particularly crucial in the low phosphorylation state. Since ArcZ synthesis is transcriptionally repressed by phosphorylated ArcA, due to the catalytic nature of transcriptional repression, ArcZ concentration saturates to an upper limit in the low phosphorylation state. We show that the sRNA mediated target destabilization is crucial here for further increase in ArcZ concentration. The sRNA-mRNA interaction might not be as crucial as this in case of high phosphorylation state since, in this state, the transcriptional repression alone is enough to reduce ArcZ concentration to any small value. (d) In order to understand how ArcZ sRNA autoregulates its synthesis by destabilising ArcB mRNA, we find the probability distributions for ArcZ concentration from the noisy gene expression data obtained from stochastic simulations over a given time interval. The average probability distribution (averaged over samples) are obtained for different values of ArcB-ArcZ binding affinities. With the increase in ArcB-ArcZ interaction, the probability distribution becomes flatter indicating increased number of transcriptional bursts with varying strengths. This feature might have larger implications in terms of switching of the cell from one stable state to another [28].
Since the focus of the present work is on the role of ArcZ sRNA on regulating the concentration levels of ArcB and ArcZ, we have not considered a third layer of regulation of through the proteolysis of . It has been found that, in a branched pathway, ArcB phosphorylates ArcA as well as another response regulator RssB which is a proteolytic target factor for [26]. Although ArcA phosphorylation rate is found to be times faster than that of RssB, it is believed that they compete for phosphotransfer from ArcB and RssB phosphorylation might be sensitive to slight changes in ArcA concentration in case of a limited supply of ArcB-P. Further, it is also found that might affect the expression level of ArcA [26]. In the present analysis, we have restricted ourselves to transcripts and we have not considered the translation part. At this level, this branched pathway and mediated regulation of ArcA expression may affect our main result on ArcZ concentration by altering effectively the ArcA and ArcB concentration by a fraction without changing the main conclusion on the role of ArcZ mediated regulation. Since, the regulation by RssB and the associated competition for phosphotransfer can lead to an interesting regulation mechanism for , an extended analysis of regulation will be published elsewhere. Additionally, it would be interesting to combine this along with a detailed stochastic analysis to find what the impact of wide stochastic fluctuations in ArcZ synthesis would be on synthesis.
In conclusion, the present analysis suggests multiple roles of sRNA in regulating its own concentration as well as that of other proteins and mRNAs. Regulation by sRNAs is typically due to their base-pairing with mRNAs. Previous studies show that this base-pairing of bacterial sRNA is often facilitated by the action of RNA chaperone, Hfq. For example, Hfq might give rise to conformational changes in the target mRNA and promote accessibility for the sRNA and hence the binding between the mRNA and the sRNA [27, 9]. Independent experimental studies have previously revealed ArcZ sRNA as one of the targets of Hfq [32, 33, 34, 35]. In Salmonella enterica, ArcZ is involved in Hfq-dependent post-transcriptional repression of tpx and sdaCB genes [36]. The fact that the binding affinity of ArcZ sRNA and ArcB mRNA plays an important role in achieving the desired equilibrium concentrations indicates the need for molecules such as Hfq or similar ones to appropriately tune the interaction between ArcZ sRNA and ArcB mRNA. Additional experimental studies would help explore such possibilities.
Acknowledgement
I thank Abhishek Acharya for many useful discussions.
Supporting Information
S1 Appendix.
Reaction processes and details on the phosphorylation kinetics and the repressor activity The appendix lists all the reactions and provides differential equations describing phosphorylation kinetics and the repressor activity of ArcA.
References
- 1. Mass E and Gottesman S A small RNA regulates the expression of genes involved in iron metabolism in Escherichia coli. Proc Natl Acad Sci 2002; 99: 4620-4625.
- 2. Prevost K, Desnoyers G, Jacques JF, Lavoie F and Mass E Small RNA-induced mRNA degradation achieved through both translation block and activated cleavage. Genes Dev 2011; 25: 385-396.
- 3. Kawamoto H, Koide Y, Morita T and Aiba H Base-pairing requirement for RNA silencing by a bacterial small RNA and acceleration of duplex formation by Hfq. Mol. Microbiol 2006; 61: 1013-1022
- 4. Darfeuille F, Unoson C, Vogel J and Wagner EG An antisense RNA inhibits translation by competing with standby ribosomes. Mol Cell 2007; 26: 381-392.
- 5. Vasudevan S, Tong Y and Steitz JA Switching from repression to activation: microRNAs can up-regulate translation. Science 2007; 318: 1931-1934.
- 6. Ghosh T, Soni K, Scaria V, Halimani M, Bhattacharjee C and Pillai B MicroRNA-mediated up-regulation of an alternatively polyadenylated variant of the mouse cytoplasmic beta-actin gene. Nuclic Acid Res 2008; 36: 6318-6332.
- 7. Ma F, Liu X, Li D, Wang P, Li N, Lu L and Cao X MicroRNA-466l upregulates IL-10 expression in TLR-triggered macrophages by antagonizing RNA-binding protein tristetraprolin-mediated IL-10 mRNA degradation., J Immunol 2010; 184: 6053-6059.
- 8. Gokhale SA and Gadgil CJ Analysis of miRNA regulation suggests an explanation for ’unexpected’ increase in target protein levels. Mol Biosyst 2012; 8: 760-765.
- 9. Papenfort K and Vanderpool CK Target activation by regulatory RNAs in bacteria. FEMS Microbiol Rev 2015; 39: 362-378.
- 10. Levine E and Hwa T Small RNAs establish gene expression thresholds. Curr Opinion in Microbiol 2008; 11: 574-579.
- 11. Levine E, Zhang Z, Kuhlman T and Hwa T Quantitative characteristics of gene regulation by small RNA. PLoS Biol 2007; 5: e229.
- 12. Shimoni Y, Friedlander G, Hetzroni G, Niv G, Altuvia S, Biham O and Margalit H Regulation of gene expression by small non-coding RNAs: a quantitative view. Mol Syst Biol 2007; 3: 138.
- 13. Klauck E and Hengge R, controlling networks in Escherichia coli. in Bacterial Regulatory Networks (ed. A. Filloux), Horizon Scientific Press, Norwich, UK, pp. 1-25, 2012.
- 14. Grigorova IL, Phelger NJ, Mutalik VK and Gross CA Insights into transcriptional regulation and competition from an equilibrium model of RNA polymerase binding to DNA. Proc Natl Acad Sci 2006; 103: 5332-5337
- 15. Mauri M and Klumpp S A model for Sigma Factor Competition in Bacterial Cells. PLoS Comput Biol 2014; 10: e1003845.
- 16. Mangan S and Alon U Structure and function of the feed-forward loop network motif. Proc Natl Acad Sci 2003; 100: 11980-11985.
- 17. Rosenfeld N, Elowitz MB, Alon U Negative autoregulation speeds the response times of transcription networks. J Mol Biol 2002; 323: 785-793.
- 18. Shen-orr SS, Milo R, Mangan S and Alon U, Network motifs in the transcriptional regulation network of Escherichia coli. Nat Genet 2002; 31: 64-68.
- 19. Ghosh B, Karmakar R and Bose I, Noise characteristics of feed forward loops. Phys Biol 2005; 2: 36-45.
- 20. Papenfort K, Espinosad E, Casadesus J, and Vogel J Small RNA-based feedforward loop with AND-gate logic regulates extrachromosomal DNA transfer in Salmonella Proc. Natl. Acad. Sci. USA 2015; E4772.
- 21. Georgellis D, Kwon O, Lin E, Quinones as the redox signal for the arc two-component system of bacteria Science 2001; 292: 2314-2316.
- 22. Lin E, Iuchi S, Regulation of gene expression in fermentative and respiratory systems in Escherichia coli and related bacteria Annu Rev Genet 1991; 25: 361-387.
- 23. Lynch A, Lin E, Transcriptional control mediated by the ArcA two-component response regulator protein of Escherichia coli: Characterization of DNA binding at target promoters J Bacteriol 1996;178: 6238?6249.
- 24. Peercy BE, Cox S J, Shalel-Levanon S, San KY, Bennett G A kinetic model of oxygen regulation of cytochrome production in Escherichia coli J Theor Biol 2006; 242: 547-563.
- 25. Kiley PJ and Donohue TJ Global responses of bacteria to oxygen deprivation. in Bacterial stress responses (ed. G. Storz and R. Hengge), ASM Press, Washington DC, 175-204.
- 26. Mika F and Hengge R A two-component phosphotransfer network involving ArcB, ArcA, and RssB coordinates synthesis and proteolysis of sigmaS (RpoS) in E. coli. Genes Dev 2005; 19: 2770-2781.
- 27. Mandin P and Gottesman S, Integrating anaerobic/aerobic sensing and the general stress response through the ArcZ small RNA. EMBO J 2010; 29: 3094-3107.
- 28. Chalancon G, Ravarani CNJ, Balaji S, Martinez-Arias A, Aravind L, Jothi R and Madan Babu M Interplay between gene expression noise and regulatory network architecture. Trends in Genetics 2012; 28: 221-232.
- 29. Alon U Introduction to Systems Biology. London: Chapman and Hall/CRC (2006)
- 30. Miller CA and Beard DA The effects of reversibility and noise on stochastic phosphorylation cycles and cascades. Biophys. J. 2008; 96: 2183-2192.
- 31. Gillespie DT A general method for numerically simulating the stochastic time evolution of coupled chemical reactions. J Comput Phys 1976; 22: 403-434.
- 32. Wassarman KM, Repoila F, Rosenow C, Storz G and Gottesman S Identification of novel small RNAs using comparative genomics and microarrays. Genes Dev 2001; 15: 1637-1651.
- 33. Zhang A, Wassarman KM, Rosenow C, Tjaden BC, Storz G and Gottesman S Global analysis of small RNA and mRNA targets of Hfq. Mol Microbiol 2003; 50: 1111-1124.
- 34. Sittka A, Lucchini S, Papenfort K, Sharma CM, Rolle K, Binnewies TT, Hinton JCD, Vogel J Deep sequencing analysis of small noncoding RNA and mRNA targets of the global post-transcriptional regulator, Hfq. PLoS Genet 2008; 4: e1000163.
- 35. Sittka A, Sharma CM, Rolle K and Vogel J Deep sequencing of Salmonella RNA associated with heterologous Hfq proteins in vivo reveals small RNAs as a major target class and identifies RNA processing phenotypes. RNA Biol, 2009; 6: 266-275.
- 36. Papenfort K, Said N, Welsink T, Lucchini S, Hinton JCD and Vogel J Specific and pleiotropic patterns of mRNA regulation by ArcZ, a conserved, Hfq-dependent small RNA. Mol Microbiol 2009; 74: 139-158.