Present address: ]School of Physics and Astronomy, the University of Edinburgh, James Clerk Maxwell Building, Peter Guthrie Tait Road, Edinburgh, EH9 3FD, UK
First direct measurement of the 11CN stellar reaction by an extended thick-target method
Abstract
The 11CN reaction is an important -induced reaction competing with -limited hydrogen-burning processes in high-temperature explosive stars. We directly measured its reaction cross sections both for the ground-state transition and the excited-state transitions and at relevant stellar energies 1.3–4.5 MeV by an extended thick-target method featuring time of flight for the first time. We revised the reaction rate by numerical integration including the and contributions and also low-lying resonances of using both the present and the previous experimental data which were totally neglected in the previous compilation works. The present total reaction rate lies between the previous rate and the total rate of the Hauser-Feshbach statistical model calculation, which is consistent with the relevant explosive hydrogen-burning scenarios such as the -process.
pacs:
29.30.Ep,26.30.-k,24.30.-v,25.55.-eI Introduction
Hydrogen burning at high temperatures of the order of –1 ( represents 1 GK) is of great importance in terms of production of heavy elements beyond iron and energy generation in various high-temperature and explosive astrophysical sites, such as supermassive metal-poor stars, type-I x-ray bursts, and core-collapse supernovae. The nucleosynthesis paths and the timescale of the -process in such stellar environments depend on the simultaneously occurring -process Wallace and Woosley (1981). This process breaks out from the hot CNO cycle and bypasses slower -decays by sequences of reactions and proton captures up to mass number , drastically depending on temperature. In type-I x-ray bursts, which are the most frequent nuclear explosion in the universe Fisker et al. (2008), the -process may determine the time evolution of energy release which varies by 2–3 orders of magnitude in about 1 second, and thus several key reactions, e.g. 14OF and 18NeNa, have been investigated Mohr and Matic (2013). Some studies for metal-poor stars Wiescher et al. (1989) and the -process Wanajo et al. (2011) suggest that several -induced reaction sequences, such as 7Be11CN and 7BeBC, also may appear significant in –3. These sequences are shown to bridge the mass gap at comparably to the triple- process, which may even affect the abundances of -nuclei around Wanajo et al. (2011).
The current problem in nucleosynthesis is that most of the relevant
reaction rates have been estimated only through
studies on resonances, time-reversal reactions,
or other indirect methods, with only a
few direct measurements
Sonzogni et al. (2000); Bradfield-Smith et al. (1999); Groombridge et al. (2002); Notani et al. (2004).
These direct measurements provided limited results
due to experimental difficulties, such as detection efficiency,
production of radioactive ion beams,
determination of reaction points in the 4He gas target,
identification of the final excited states, etc.
Recently, some research projects for direct measurement of
reactions of astrophysical interest are ongoing
using an ambitious detection
system such as HELIOS (Helical Orbit Spectrometer
Wuosmaa et al. (2007); Lighthall et al. (2010)),
which has been used for reaction measurements,
yet under commissioning
for reaction measurements.
Besides these works,
we have successfully
performed a direct measurement of the 11CN reaction
for the first time
by a simple experimental configuration,
leading one of the most comprehensive results
among the above crucial nucleosynthesis paths.
The 11CN reaction rates currently available
are reported in compilations by
Caughlan and Fowler Caughlan and Fowler (1988) (hereafter “CF88”),
and NACRE collaboration Angulo et al. (1999).
Both of them are based on studies of the time-reversal reaction 14NC by the activation method Shrivastava et al. (1968); Jacobs et al. (1974); Casella et al. (1978); Epherre and Seide (1971); Ingalls et al. (1976); Bida et al. (1980),
which thus provide information only on the transition
to the ground state of 14N
(hereafter “”), but
not to the excited states (hereafter “”, “”, etc.).
Indeed, in nuclear astrophysics, transitions to excited states are
rarely investigated experimentally in spite of their importance.
In the CF88 compilation, the astrophysical -factor
of this reaction as well as that of the time-reversal reaction
were adopted from the lowest-energy study
by Ingalls et al. Ingalls et al. (1976)
which approximated the cross section over several resonances
by a smooth function.
The NACRE compilation derived the -factor
of the time-reversal reaction
from 6 data sets Shrivastava et al. (1968); Jacobs et al. (1974); Casella et al. (1978); Epherre and Seide (1971); Ingalls et al. (1976); Bida et al. (1980)
with improvement at higher energies,
but it obviously underestimated the lowest energy part
which is important for the reaction rate near temperatures.
An alternative compilation work on the 14NC reaction
by Takács et al. Takács et al. (2003)
has applied the Padé approximation to the excitation functions
of 13 data sets up to
MeV
in the 11C + center-of-mass system
reproducing resonances more properly,
but the resonances below MeV were again
just smoothed out.
A direct measurement is able to address the above omissions
in the reaction rate evaluations, and also
enables us to observe such excited-state transitions
and also has an advantage
to validate the cross sections measured by the activation method.
II Experimental method and data analysis
The experiment was performed in inverse kinematics
using the unstable nuclide 11C as the projectile
covering a center-of-mass energy range 0–4.5 MeV
based on the thick target method Artemov et al. (1990).
The 11C beams were produced by the in-flight technique
with CRIB
(Center for Nuclear Study Radioactive
Ion Beam separator Yanagisawa et al. (2005)).
A 11B3+ primary beam at 4.6 MeV/nucleon with a typical
intensity of 1 pA was provided by the RIKEN AVF cyclotron, and
bombarded the cryogenic hydrogen
gas target Yamaguchi et al. (2008)
with a typical thickness of 1.7 mg/cm2,
confined by 2.5-m-thick Havar foils at beam entrance and exit.
The secondary 11C ions
produced via the 1HB,11C
reaction were purified by the double achromatic system and
the following Wien filter of CRIB.
The experimental setup at the final focal plane,
illustrated in Fig. 1,
consisted of two beam-line monitors,
a 4He gas target, and
three sets of E-E position-sensitive
silicon detector telescopes.
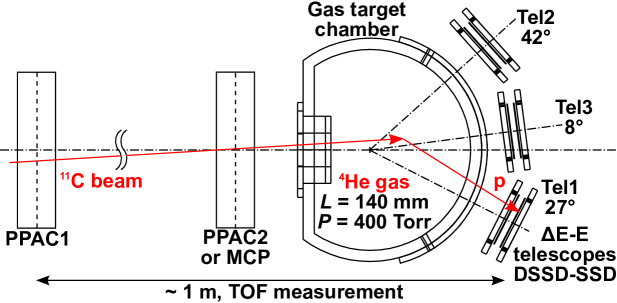
A Parallel Plate Avalanche Counter (PPAC) Kumagai et al. (2001)
was used for the first beam-line monitor,
and another PPAC and a MicroChannel Plate detector (MCP)
Hayakawa (2008)
were switchable for the second monitor; the employed experimental setup allowed us
to alternate between two different on-target energies
by the different thicknesses
of the second beam-line monitors,
thus scanning a wide excitation-energy
range in two measurements
without altering the CRIB optical condition.
This setup
was also helpful to confirm self-consistency of our measurement
by checking the data in the overlapping energy region
of the lower- and the higher-energy run,
as mentioned later.
These two monitors
tracked each beam particle event-by-event,
and the first monitor also acted as the time reference
of the measurement.
The data acquisition was triggered by
the sum of the downscaled signal of the first PPAC
and the coincident signal of the first PPAC with the silicon detectors,
which thus canceled out the PPAC efficiency for the absolute cross section
determination.
The two resulting beam energies
were directly measured with a silicon detector
at the target position, to be
10.120.46 MeV and 16.860.36 MeV
in full width at half maximum,
covering center-of-mass energy ranges
0–2.7 MeV and 2.3–4.5 MeV, respectively.
The secondary-beam ions were identified event by event
from the time of flight (TOF) information between the two beam-line monitors
and the TOF with respect to the cyclotron radio-frequency signal,
thus the beam contaminants were easily distinguished in the analysis.
The 11C6+ purity was
determined to be higher than 97%,
and the rest was mostly 11B5+ and trace amounts of 11C5+.
The 11C beam spot was well focused on the target window
with a diameter of 30 mm so that
78% of the 11C beam particles eventually entered the target chamber,
and the on-target average intensities
of the lower- and the higher-energy 11C beams were
3.1105 pps and 1.0105 pps,
respectively.
The 4He gas target was sealed with 2.5-m-thick Havar foil
at the entrance window,
and 25-m-thick Mylar foil at the exit window
which is in a cylindrical shape and has a sufficiently large area
for the full detection acceptance.
The energy straggling of the ejected proton through this exit window is
estimated at only 20 keV at most, which is negligible.
The silicon telescopes were mounted at three different laboratory angles, 27∘, 42∘ and 8∘ (labeled as “Tel1”, “Tel2” and “Tel3”, respectively), facing the geometrical center of the arc of the exit window of the gas target. The active area of each silicon detector was 5050 mm2, and the E layers were double-sided stripped silicon detectors (DSSDs) with 16 strips in two orthogonal dimensions with typical thicknesses of 30-60 m, and the E layers were single-pad (SSDs) with typical thicknesses of 1.5 mm in which the protons were fully stopped. The observed particles with the E-E telescopes are mostly identified as protons and alphas with sufficient resolution, together with a few deuterons and 3He ions.
The present experimental setup is remarkable in terms of the
use of an extended gas target with a length of 140 mm along the beam axis
at a pressure of 400 Torr, which enables separation of
each transition to the 14N excited state
( MeV, 3.948 MeV, etc.)
to be observed in different TOF between the first PPAC and the SSDs.
A similar idea was previously proposed in Ref. Fu et al. (2007)
and two experiments at CRIB Jung et al. (2012); Kim et al. (2015),
but none of them actually deduced cross sections
for excited-state transitions separately.
A more detailed explanation
of this technique
was given by Ref. Rogachev et al. (2010)
for separation of proton elastic and inelastic scatterings
with a 7Be beam.
However, again they did not demonstrate the TOF separation
of the actual data due to insufficient time difference
for the first excitation energy of 7Be 0.43 MeV,
but showed the separation in the energy correlation between
the light and the heavy recoil particles
with the hybrid thick/thin target method.
Thus here we have for the first time made the full proof of principle
for the reaction measurement with the TOF technique
in a comprehensive way.
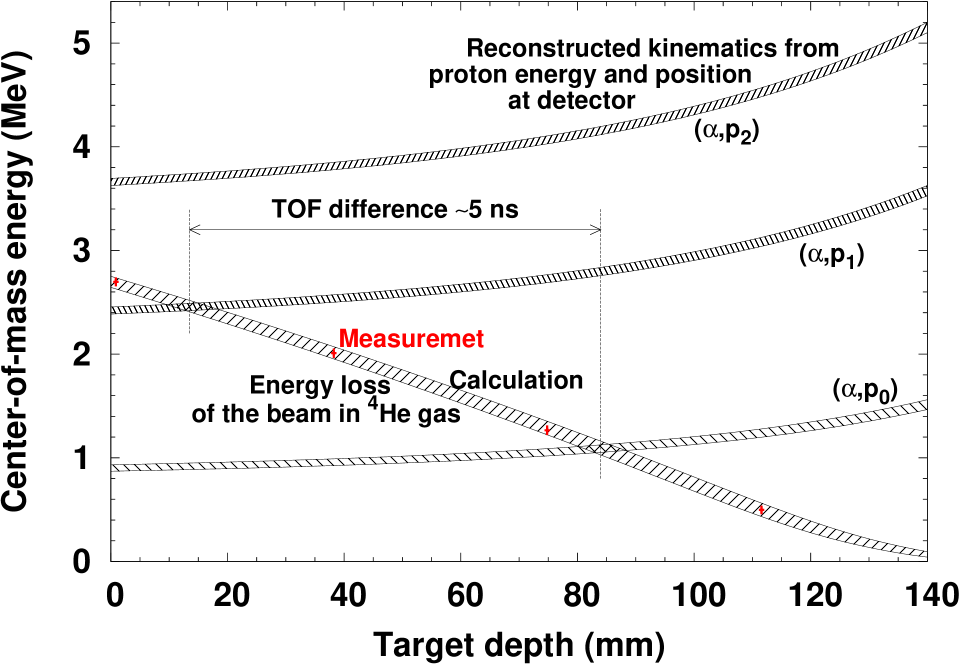
Figure 2 illustrates how to determine
the center-of-mass energies as well as the target position
for a reaction event,
under a given condition with
a proton kinetic energy of 5 MeV,
a scattering angle of 40∘,
and the lower beam energy.
For the basis of this method, we directly measured
the energy loss (red cross) and straggling (vertical error bar)
of the 11C beam particles
at several 4He gas target depths
with a silicon detector inside the gas,
and confirmed consistency with energy loss calculation
Ziegler et al. (2010) shown as a decreasing function.
On the other hand,
the increasing functions represent possible kinematic conditions
of different excited-state transitions for
a detected proton taking into account energy loss in the target gas
with the above given energy and angle.
The widths of these functions represent the systematic uncertainties.
Therefore one can determine the reaction energy and position
simultaneously as the vertex of these functions.
The typical distance between reaction positions of and calculated by this method
is about 70 mm, where the equivalent TOF difference
becomes about 5 ns.
This TOF difference enables one to identify
which excited state in 14N the reaction reaches
event by event.
With a Monte Carlo simulation,
we estimated the accuracy
of the center-of-mass energy 45–65 keV depending on the
intrinsic energy resolution of each silicon telescope and
the reaction angle; we found that
the typical determination accuracy of reaction position is about 5 mm,
implying that the uncertainty in the solid angle is
eventually smaller than the statistical error we observed.
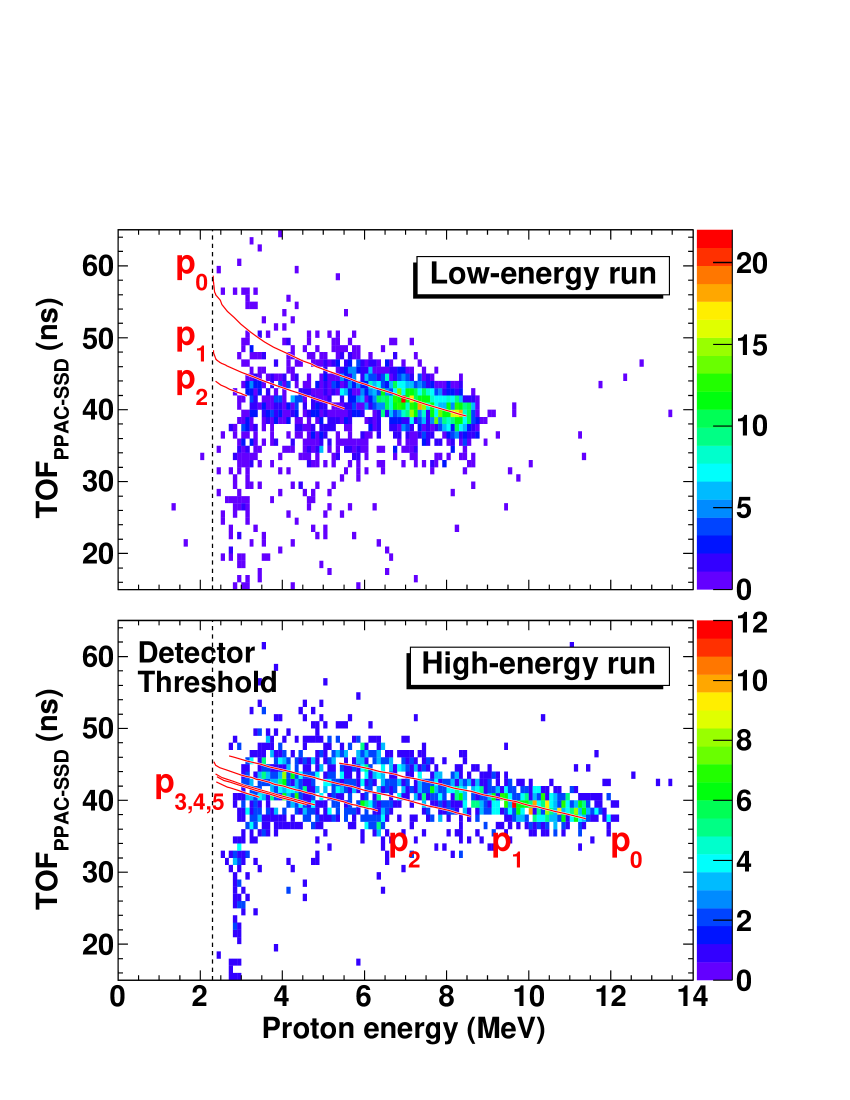
Figure 3 shows the relation between
the TOF from the first PPAC to the SSD
against the energy of protons detected in Tel1
of the lower- and
the higher-energy runs. The calculated TOF values are shown
as solid lines for several allowed
excited-state transitions,
of which the properties such as the onset of energy
and the gradient
nicely agree with the measured distributions in the plot.
The energy dependence of the time resolution of the SSDs
was apparently independent from the choice of the beam condition,
thus it was estimated from the time broadening of
-only loci of the lower- and the higher-energy 11C beam data
and the 11B primary beam data.
The time broadening gradually increases from 1 ns to 3 ns as the proton energy decreases
from 12 MeV to 4 MeV,
and almost diverges very close to the energy threshold limited by
the E thickness, appearing in Fig. 3.
Such a time broadening can be regarded as the intrinsic SSD resolution
as the effects of the proton
scattering angle or the beam energy broadening are expected
to be sufficiently small.
Although the separation of different excited-state loci was not perfect due to the time broadening,
we successfully extracted their mixing ratios
by fitting Gaussian functions to the time spectra within limited energy bins as described below.
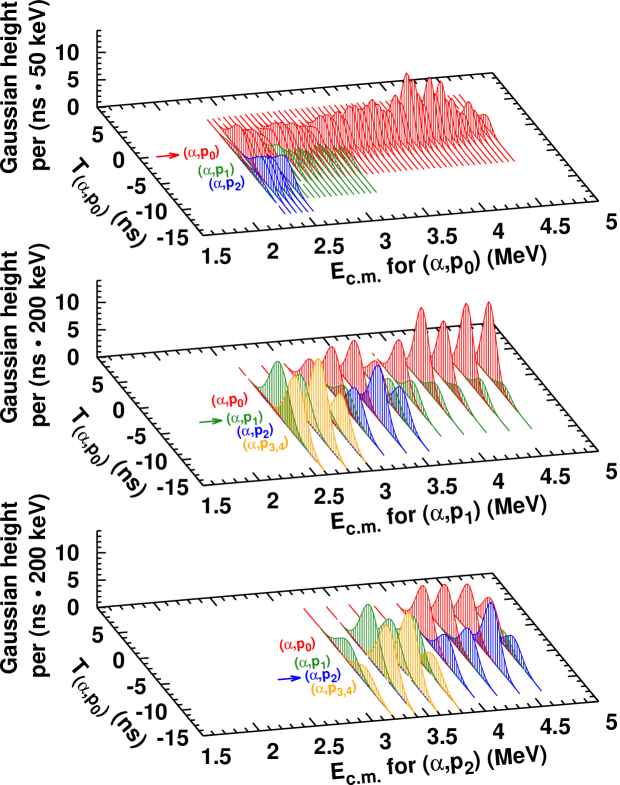
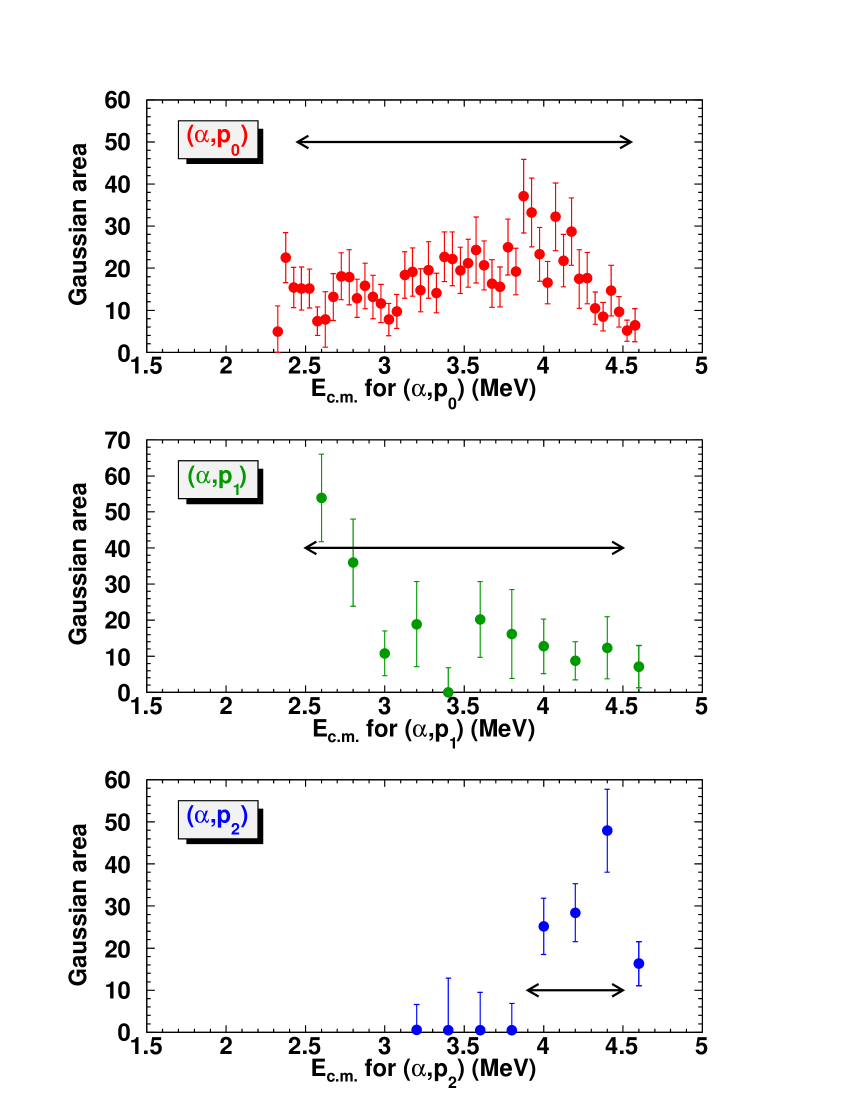
Figure 4 and 5 demonstrate the procedure to determine the number of events
for each excited-state transition
from the same data (Tel1, higher-energy run)
as Fig. 3.
We fitted those data
projected to the time axis
by Gaussian functions
at each calculated peak within each energy bin.
The result of the fitting is shown in Fig. 4.
Note that the origin of the time axis of Fig. 4
is realigned to the calculated locus,
which leads better separation between different loci
within a finite size of an energy bin.
The energy axes in Fig. 4 and 5
are converted to the center-of-mass energies
reconstructed with the -values for
(top panel, MeV),
(middle panel, MeV)
and (bottom panel, MeV), respectively.
The bin sizes were 50 keV for , and 200 keV for
and .
Each excited-state locus in Fig. 4
is labeled as etc.,
and the arrows indicate which locus is extracted.
Figure 5 shows the
extracted numbers of events of , and as the area of the corresponding Gaussian function
defined by
| (1) |
where and are the height and the width of the Gaussian function respectively, and ns is the bin size of the normalized time . Thus the error of the counts , namely, that of the area of the Gaussian function can be defined as
| (2) |
where and are the error of the fitted parameters.
The arrows in Fig. 5
indicate the energy ranges selecting only the reliable data,
eliminating the data at the ends of the energy ranges,
and the data below the onset energy of
as they overlap considerably.
We repeated the same procedure for the data of the other telescopes,
and also for the lower-energy run.
We also performed a measurement with the same setup but the
gas target filled with argon gas of an equivalent thickness
in order to subtract background protons which reached only
the most forward telescope (Tel3) passing through the gas target windows
from upstream in coincidence with the beam particles triggering.
Such protons were also identified by the TOF-versus-energy
information in a larger time range
and mostly separated from the reaction events.
The only influential case was protons from the Mylar foil of the
second PPAC produced by elastic scattering of beam particles,
which partially overlapped with the and the data of comparable intensity.
We only eliminated these data, otherwise
the angular distribution of the background-subtracted data
of Tel3 were basically consistent with the corresponding data
of Tel1 and Tel2 within the errors,
which were taken into account to the angle-averaged cross sections
as discussed later.
III Astrophysical -factors
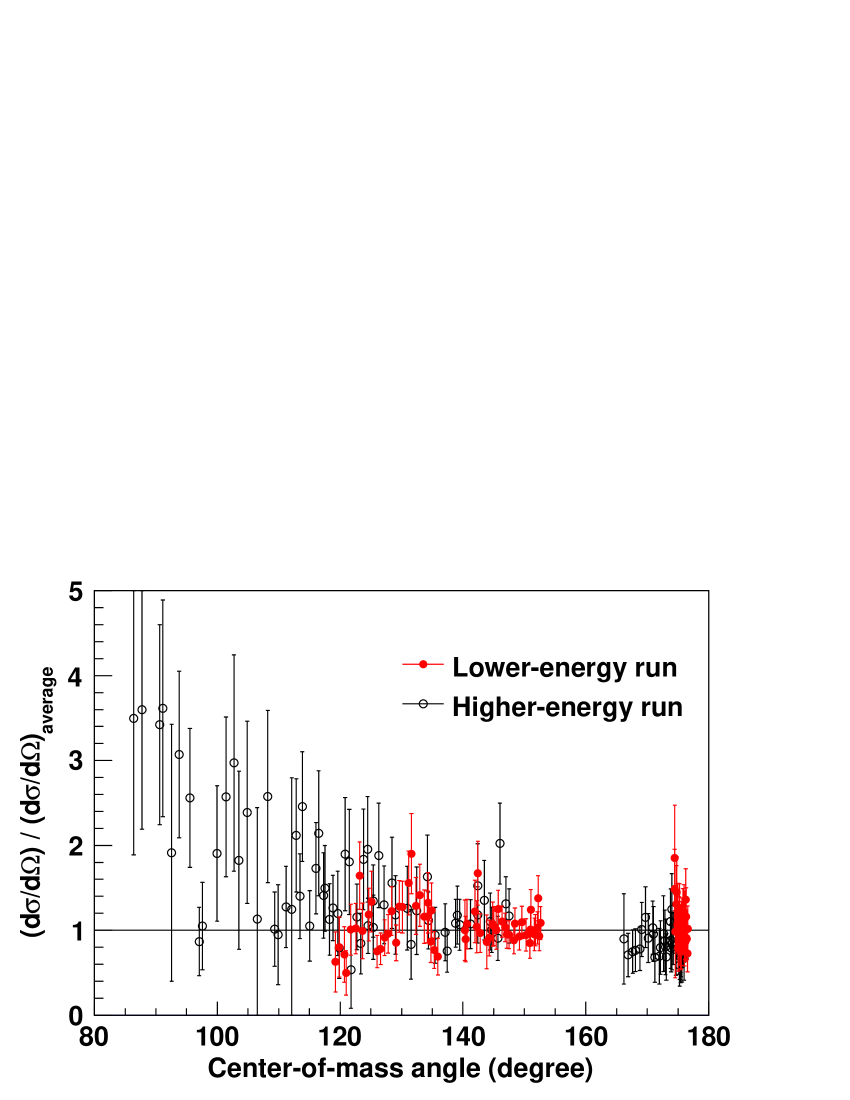
The present data appear to be nearly isotropic, because 94% of the data points are located within a factor of 2 or less from the weighted mean value of the angular distribution spread at each energy. This is shown up in Fig. 6 as the ratio of the observed differential cross section to that of the weighted average at each energy versus the center-of-mass angle. The angular distributions of the lower- and the higher-energy runs in their overlapping range from 2.30 MeV to 2.75 MeV were also in agreement within their errors, which confirms the self-consistency of our measurements.
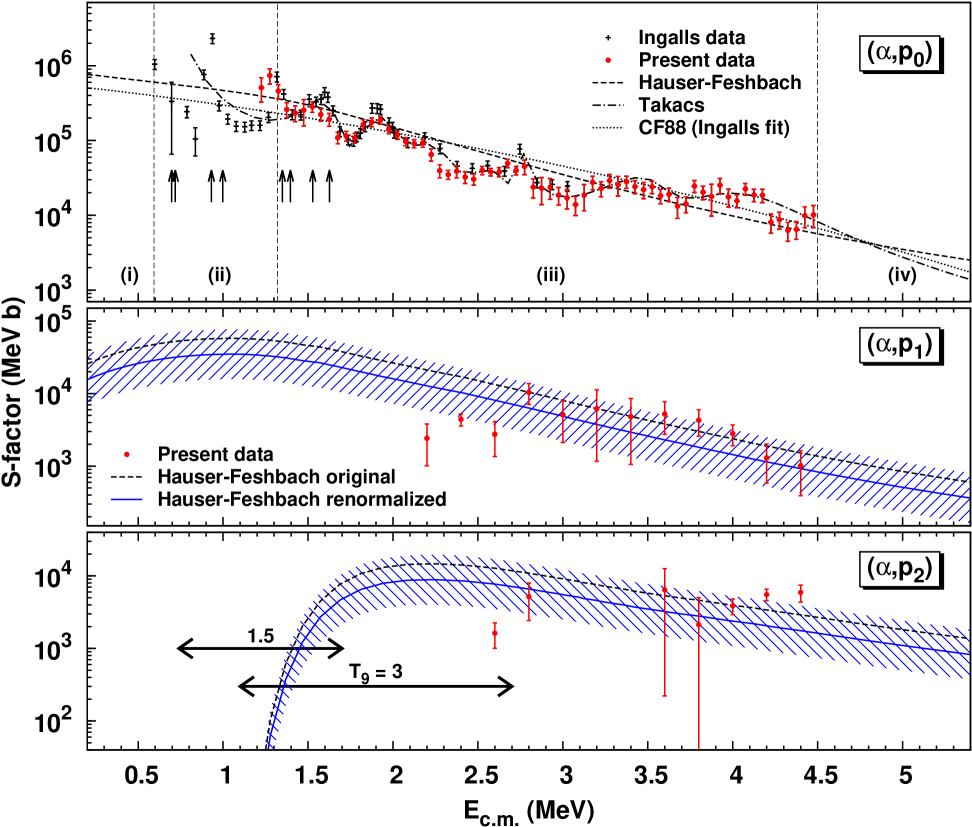
In Fig. 7,
the newly obtained astrophysical -factors
of both the lower-energy run and the higher-energy run for ,
and are plotted as red solid circles with error bars.
The crosses with error bars are from the time-reversal reaction data
Ingalls et al. (1976) with the detailed balance theorem.
The Gamow windows of and 3 are indicated with arrows in the
bottom panel.
For comparison,
the Hauser-Feshbach model calculations for each transition
by the code non-smoker Descouvemont and Rauscher (2006); rau
are shown as the dashed curve in the respective panels,
and the -factors of CF88 Caughlan and Fowler (1988)
(dotted curve)
and that of Takács et al. Takács et al. (2003) (dashed-dotted curve)
are shown together in the top panel.
The -factor by the Hauser-Feshbach calculation
roughly agrees with the present experimental data
within a factor of 2 over a several MeV range,
but obviously overestimates the rate at the lowest energies.
One can see that the present data are mostly consistent with the previous data
by Ref. Ingalls et al. (1976) and Takács et al. (2003)
over most of the energy range except near the lower energy limit of the measurement
around 1.3 MeV.
The peak position in the present work near the known resonance at
1.349 MeV looks shifted to a slightly lower energy.
At the lowest energies below MeV,
the yield of the events
rapidly dropped, and not all of the three telescopes
counted reliable events.
Thus the angle-integrated cross section of these data
are lacking over some angular ranges,
and so we adopted the data only above that energy
for the reaction rate calculation.
The 8 arrows in the top panel indicate
the positions of the known low-lying resonances with significant total widths,
corresponding well to the peaks appearing in the experimental data.
For known excited levels
Ajzenberg-Selove (1991)
in the corresponding energy region,
most resonance energies and total widths
have been well determined via proton elastic and inelastic
scattering on 14N,
and some spins, parities and orbital angular momenta
were assigned by -matrix analysis West et al. (1969); Radović et al. (2008),
but no partial widths were known.
Here we do not demonstrate -matrix analysis on these data,
because we have only limited statistics for each resonances,
the resonance widths are comparable to the energy resolution,
and the most resonances overlap each other,
which would unlikely lead any new information or
constraints beyond what was determined in the previous works.
We also observed the excitation function of the
elastic scattering down to MeV
with some resonant structure at the most forward angles
even below the Coulomb barrier of 3.5 MeV.
However,
no useful information could be extracted
in the lower energy range
to which the reaction rate below is sensitive.
Thus we neglected to pursue further analysis of these data
in this paper.
The present and the cross sections come out
about one order of magnitude lower than the one,
and those of the Hauser-Feshbach calculation
appear to be larger than the present experimental data.
For the reaction rate calculation,
we extrapolated those -factors toward the full energy range
using the shape of the Hauser-Feshbach calculations
renormalizing to the present data
by the logarithmic least-squares method.
Note that the utilization of the statistical model
is not to justify its applicability
to such a light nuclear system,
but rather to reveal difference of its absolute value.
The renormalized Hauser-Feshbach curves
are shown in addition to the original ones
in the middle and the bottom panels of Fig. 7.
The normalization factors for and are 0.61 and 0.69,
and their logarithmic standard deviations are 2.2
and 2.6, respectively, as drawn with hatched areas.
IV Reaction rates
To derive the total reaction rate of 11CN, we adopted new -factors based on all presently available data as follows. The data were selected from each energy section defined as (i)–(iv) by vertical dashed lines in Fig. 7; (i) the CF88 smooth curve, (ii) the data points of the time-reversal reaction Ingalls et al. (1976), (iii) the present data points, (iv) the compilation of Ref. Takács et al. (2003) up to 25 MeV. For and , we adopted the present data points for the measured energy regions, otherwise the renormalized Hauser-Feshbach curves as extrapolation.
We performed numerical integration of those -factors
based on Simpson’s rule
in energy ranges where the integrated values converged well.
For the integration,
the values at energies in between data points
were linearly interpolated from the neighboring values.
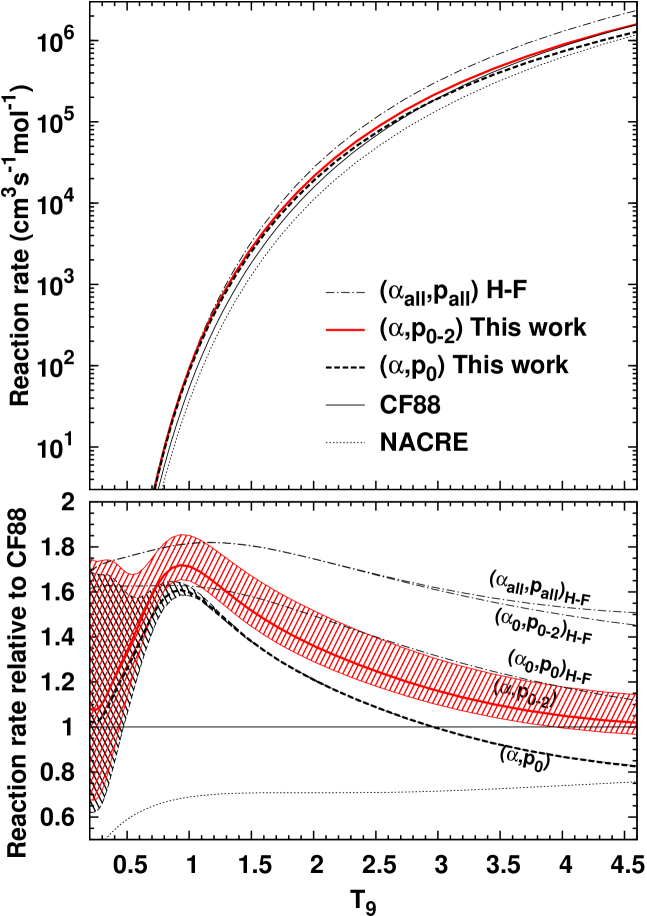
Figure 8 shows
the absolute reaction rates (upper)
and the reaction rates relative to the CF88 rate (lower)
of the present data and
several previously reported ones.
The hatched regions in the lower panel indicate the errors of the present rates.
The error of arises only from an uncertainty of
a factor of 1.65 in the energy section (i)
estimated as the logarithmic standard deviation of the present data
against the CF88 curve,
while those of and from the uncertainties of the
renormalized Hauser-Feshbach functions.
In the -process temperature range (–3)
Wanajo et al. (2011),
the present reaction rate
is enhanced from the CF88 rate
by about 40% at most,
mainly due to the resonances around 0.9 MeV
and 1.35 MeV
which were not taken into account at all in neither CF88,
NACRE nor Ref. Takács et al. (2003).
The contribution from the and reaction rate
to the total reaction rate is about 20% of the at most,
and the error of the total reaction rate
results in about 15%.
The Hauser-Feshbach rate for overestimates at low temperatures
and approaches to the experimental rates as the temperature increases,
as expected from the behavior of its -factor in
Fig. 7.
The Hauser-Feshbach model calculation for the excited states shows an
insignificant difference between the rates
and the total rate ,
which suggests the present measurement up to is sufficient.
As for the astrophysical implications of the present work,
it turns out that the enhancement of the 11CN reaction rate by less than a factor of two
would not be a big impact to
change the relevant nuclear-burning scenarios;
by the present reaction rate,
the deviation of the branching condition
between the 11CN reaction and the 11C -decay
from the previous condition Wiescher et al. (1989)
is negligible,
as the neighbor branching conditions of other reactions
are located so far from that of this reaction
by many order of magnitude
in the density-energy dependency
investigated for metal-poor stars.
Therefore we conclude that the present result
could also support the validity of this reaction
as a possible path which breaks out from the -chain region
to the CNO-cycle region in the -process Wanajo et al. (2011).
V Summary
We have performed a direct measurement of the 11CN reaction cross section at stellar energies of 1.3–4.5 MeV by the extended thick-target method, which enabled separation of both the , and transitions in time of flight. The present measurement provided one of the most comprehensive results among relevant stellar reactions under explosive burning conditions. The new total reaction rate lies between the previous rate and the total Hauser-Feshbach rate, which still supports the validity of relevant explosive hydrogen-burning process scenarios such as the -process that it proceeds via the 11CN reaction in addition to the triple- process. We expect that the present extended thick-target method with the TOF technique is widely applicable to other - or even proton-induced reaction or scattering measurements.
Acknowledgements.
We thank the accelerator staff at RIKEN and CNS, Prof. T. Rauscher for his help with the non-smoker calculations, and Dr. S. Wanajo for productive discussions on the -process. This work was partly supported by JSPS KAKENHI (Grant No. 25800125 and 21340053).References
- Wallace and Woosley (1981) R. K. Wallace and S. E. Woosley, Astrophys. J. Suppl. Ser. 45, 389 (1981).
- Fisker et al. (2008) J. L. Fisker, H. Schatz, and F.-K. Thielemann, Astrophys. J. Supp. Ser. 174, 261 (2008).
- Mohr and Matic (2013) P. Mohr and A. Matic, Phys. Rev. C 87, 035801 (2013).
- Wiescher et al. (1989) M. Wiescher, J. Gorres, S. Graff, L. Buchmann, and F.-K. Thielemann, Astrophys. J. 343, 352 (1989).
- Wanajo et al. (2011) S. Wanajo, H. T. Janka, and S. Kubono, Astrophys. J. 729, 46 (2011).
- Sonzogni et al. (2000) A. A. Sonzogni, K. E. Rehm, I. Ahmad, F. Borasi, D. L. Bowers, F. Brumwell, J. Caggiano, C. N. Davids, J. P. Greene, B. Harss, A. Heinz, D. Henderson, R. V. F. Janssens, C. L. Jiang, G. McMichael, J. Nolen, R. C. Pardo, M. Paul, J. P. Schiffer, R. E. Segel, D. Seweryniak, R. H. Siemssen, J. W. Truran, J. Uusitalo, I. Wiedenhöver, and B. Zabransky, Phys. Rev. Lett. 84, 1651 (2000).
- Bradfield-Smith et al. (1999) W. Bradfield-Smith, T. Davinson, A. Di Pietro, A. M. Laird, A. N. Ostrowski, A. C. Shotter, P. J. Woods, S. Cherubini, W. Galster, J. S. Graulich, P. Leleux, L. Michel, A. Ninane, J. Vervier, J. Görres, M. Wiescher, J. Rahighi, and J. Hinnefeld, Phys. Rev. C 59, 3402 (1999).
- Groombridge et al. (2002) D. Groombridge, A. C. Shotter, W. Bradfield-Smith, S. Cherubini, T. Davinson, A. Di Pietro, J. Görres, J. S. Graulich, A. M. Laird, P. Leleux, A. Musumarra, A. Ninane, A. N. Ostrowski, J. Rahighi, H. Schatz, M. Wiescher, and P. J. Woods, Phys. Rev. C 66, 055802 (2002).
- Notani et al. (2004) M. Notani, S. Kubono, T. Teranishi, Y. Yanagisawa, S. Michimasa, K. Ue, J. J. He, H. Iwasaki, H. Baba, M. Tamaki, T. Minemura, S. Shimoura, N. Hokoiwa, Y. Wakabayashi, T. Sasaki, T. Fukuchi, A. Odahara, Y. Gono, Z. Fülöp, E. K. Lee, K. I. Hahn, J. Y. Moon, C. C. Yun, J. H. Lee, C. S. Lee, and S. Kato, Nucl. Phys. A 746, 113c (2004).
- Wuosmaa et al. (2007) A. H. Wuosmaa, J. P. Schiffer, B. B. Back, C. J. Lister, and K. E. Rehm, Nucl. Instrum. Methods A 580, 1290 (2007).
- Lighthall et al. (2010) J. C. Lighthall, B. B. Back, S. I. Baker, S. J. Freeman, H. Y. Lee, B. P. Kay, S. T. Marley, K. E. Rehm, J. E. Rohrer, J. P. Schiffer, D. V. Shetty, A. W. Vann, J. R. Winkelbauer, and A. H. Wuosmaa, Nucl. Instrum. Methods A 622, 97 (2010).
- Caughlan and Fowler (1988) G. R. Caughlan and W. A. Fowler, At. Data Nucl. Data Tables 40, 283 (1988).
- Angulo et al. (1999) C. Angulo, M. Arnould, M. Rayet, P. Descouvemont, D. Baye, C. Leclercq-Willain, A. Coc, S. Barhoumi, P. Aguer, C. Rolfs, R. Kunz, J. W. Hammer, A. Mayer, T. Paradellis, S. Kossionides, C. Chronidou, K. Spyrou, S. Degl’Innocenti, G. Fiorentini, B. Ricci, S. Zavatarelli, C. Providencia, H. Wolters, J. Soares, C. Grama, J. Rahighi, A. Shotter, and M. L. Rachti, Nucl. Phys. A 656, 3 (1999).
- Shrivastava et al. (1968) P. Shrivastava, F. Boreli, and B. Kinsey, Phys. Rev. 169, 842 (1968).
- Jacobs et al. (1974) W. W. Jacobs, D. Bodansky, D. Chamberlin, and D. L. Oberg, Phys. Rev. C 9, 2134 (1974).
- Casella et al. (1978) V. R. Casella, D. R. Christman, T. Ido, and A. P. Wolf, Radiochimica Acta 25, 17 (1978).
- Epherre and Seide (1971) M. Epherre and C. Seide, Phys. Rev. C 3, 2167 (1971).
- Ingalls et al. (1976) P. D. Ingalls, J. S. Schweitzer, B. D. Anderson, and M. Rios, Phys. Rev. C 13, 524 (1976).
- Bida et al. (1980) G. T. Bida, T. J. Ruth, and A. P. Wolf, Radiochimica Acta 27, 181 (1980).
- Takács et al. (2003) S. Takács, F. Tárkányi, A. Hermanne, and R. P. de Corcuera, Nucl. Instrum. Methods B 211, 169 (2003).
- Artemov et al. (1990) K. P. Artemov, O. P. Belyanin, A. L. Vetoshkin, R. Wolski, M. S. Golovkov, V. Z. Goldberg, M. Madeja, V. V. Pankratov, I. N. Serikov, V. A. Timofeev, V. N. Shadrin, and J. Szmider, Sov. J. Nucl. Phys. 52, 408 (1990).
- Yanagisawa et al. (2005) Y. Yanagisawa, S. Kubono, T. Teranishi, K. Ue, S. Michimasa, M. Notani, J. J. He, Y. Ohshiro, S. Shimoura, S. Watanabe, N. Yamazaki, H. Iwasaki, S. Kato, T. Kishida, T. Morikawa, and Y. Mizoi, Nucl. Instrum. Methods A 539, 74 (2005).
- Yamaguchi et al. (2008) H. Yamaguchi, Y. Wakabayashi, G. Amadio, S. Hayakawa, H. Fujikawa, S. Kubono, J. J. He, A. Kim, and D. N. Binh, Nucl. Instrum. Methods A 589, 150 (2008).
- Kumagai et al. (2001) H. Kumagai, A. Ozawa, N. Fukuda, K. Sümmerer, and I. Tanihata, Nucl. Instrum. Methods A 470, 562 (2001).
- Hayakawa (2008) S. Hayakawa, Master’s thesis, Department of Physics, the University of Tokyo (2008).
- Fu et al. (2007) C. Fu, V. Z. Goldberg, A. M. Mukhamedzhanov, G. G. Chubarian, G. V. Rogachev, B. Skorodumov, M. McCleskey, Y. Zhai, T. Al-Abdullah, G. Tabacaru, L. Trache, and R. E. Tribble, Phys. Rev. C 76, 021603 (2007).
- Jung et al. (2012) H. S. Jung, C. S. Lee, Y. K. Kwon, J. Y. Moon, J. H. Lee, C. C. Yun, S. Kubono, H. Yamaguchi, T. Hashimoto, D. Kahl, S. Hayakawa, S. Choi, M. J. Kim, Y. H. Kim, Y. K. Kim, J. S. Park, E. J. Kim, C.-B. Moon, T. Teranishi, Y. Wakabayashi, N. Iwasa, T. Yamada, Y. Togano, S. Kato, S. Cherubini, and G. G. Rapisarda, Phys. Rev. C 85, 045802 (2012).
- Kim et al. (2015) A. Kim, N. H. Lee, M. H. Han, J. S. Yoo, K. I. Hahn, H. Yamaguchi, D. N. Binh, T. Hashimoto, S. Hayakawa, D. Kahl, T. Kawabata, Y. Kurihara, Y. Wakabayashi, S. Kubono, S. Choi, Y. K. Kwon, J. Y. Moon, H. S. Jung, C. S. Lee, T. Teranishi, S. Kato, T. Komatsubara, B. Guo, W. P. Liu, B. Wang, and Y. Wang, Phys. Rev. C 92, 035801 (2015).
- Rogachev et al. (2010) G. V. Rogachev, E. D. Johnson, J. Mitchell, V. Z. Goldberg, K. W. Kemper, and I. Wiedenhöver, AIP Conf. Proc. 1213, 137 (2010).
- Ziegler et al. (2010) J. F. Ziegler, M. D. Ziegler, and J. P. Biersack, Nucl. Instrum. Methods B 268, 1818 (2010).
- Descouvemont and Rauscher (2006) P. Descouvemont and T. Rauscher, Nucl. Phys. A 777, 137 (2006).
- (32) T. Rauscher (private communication).
- Ajzenberg-Selove (1991) F. Ajzenberg-Selove, Nucl. Phys. A 523, 1 (1991).
- West et al. (1969) M. West, C. Jones, J. Bair, and H. Willard, Phys. Rev. 179, 1047 (1969).
- Radović et al. (2008) I. B. Radović, Z. Siketić, M. Jakšić, and A. F. Gurbich, J. Appl. Phys. 104, 074905 (2008).