Highly Enriched 7Be in the ejecta of Nova Sagittarii 2015 No. 2 (V5668 Sgr) and the Galactic 7Li origin
Abstract
We report on the evidence of highly blue-shifted resonance lines of the singly ionised isotope of 7Be ii in high resolution UVES spectra of Nova Sagittarii 2015 No. 2 (V5668 Sgr). The resonance doublet lines 7Be ii at 313.0583, 313.1228 nm are clearly detected in several non saturated and partially resolved high velocity components during the evolution of the outburst. The total absorption identified with Be ii has an equivalent width much larger than all other elements and comparable to hydrogen. We estimate an atomic fraction 53-69 from unsaturated and resolved absorption components. The detection of 7Be in several high velocity components shows that 7Be has been freshly created in a thermonuclear runaway via the reaction during the Nova explosion, as postulated by Arnould & Norgaard (1975), however in much larger amounts than predicted by current models. 7Be ii decays to 7Li ii with a half-life of 53.22 days, comparable to the temporal span covered by the observations. The non detection of 7Li i requires that 7Li remains ionised throughout our observations. The massive Be ii ejecta result into a 7Li production that is 4.7-4.9 dex above the meteoritic abundance. If such a high production is common even in a small fraction (5%) of Novae, they can make all the stellar 7Li of the Milky Way.
keywords:
stars: individual V5668 Sgr; stars: novae – nucleosynthesis, abundances; Galaxy: evolution – abundances1 Introduction
7Li is a unique element that shows a large variety of production processes. These include primordial nucleosynthesis, spallation processes by high energy cosmic rays in the interstellar medium, stellar flares in low mass stars, Cameron-Fowler mechanism in Asymptotic Giant Branch (AGB) stars and Novae, and neutrino induced nucleosynthesis in SNae explosions. Observations show that 7Li has a constant abundance among metal-poor stars and begins to rise at [Fe/H] -1 to reach the meteoritic value at solar metallicities (Rebolo, Beckman & Molaro, 1988) requiring a net 7Li production (Romano et al., 1999). The rate of the Li increase favours AGB stars and Novae as the most significant sources. Although 7Li has been observed in AGB stars the observational evidence for Novae has only recently been found by Izzo et al. (2015) with the first detection of the 7Li i 6708 line in the spectra of Nova Centauri 2013 (V1369 Cen) and by Tajitsu et al. (2015) with the first detection of 7Be in the post-outburst spectra of the classical Nova Delphini 2013 (V339 Del).
Here, we report a study of the Be ii by means of UVES observations of Nova Sagitarii 2015 No. 2 (V5668 Sgr). A spectrum from the High Dispersion Spectrograph of the Subaru Telescope taken at day 63 after maximum has been discussed by Tajitsu et al. (2016) who reported the presence of 7Be ii in this Nova, and also in V2944 Oph.
2 Observations
2.1 Evidence for 7Be ii
Nova Sagittarii 2015 No. 2 was discovered by Seach (2015) on 15 March 2015 and reached the first maximum on 21 March at 04h 04m UT with a magnitude of . The Nova re-brightened several times and remained bright for about 80 days before declining due to dust formation. Soon after the discovery we started a DDT program with the UVES spectrograph at the ESO-VLT. Several UVES spectra were obtained at +58, 63, 69, 73, 82 and 89 days from maximum as reported in Table 1. The settings with central wavelength of 346 nm (range 305-388 nm), 437 nm (375-499 nm), 564 nm (460-665 nm) and 760 nm (570-946 nm), were used, thus covering the full optical range from the atmospheric cutoff to the red edge of 946.0 nm with small gaps of 10 nm around the red central wavelengths. The resolving power was for the blue arm and for the red arm. Overlapping spectra have been combined for each epoch to maximise the signal-to-noise.
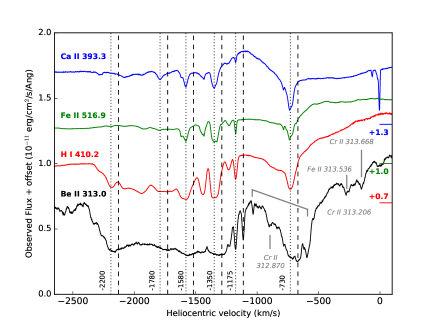
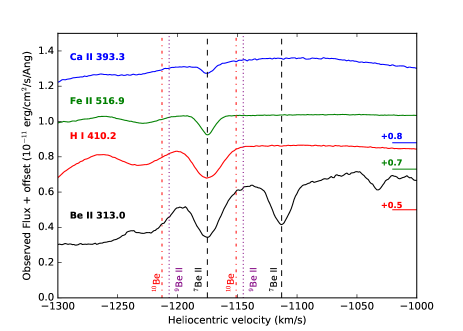
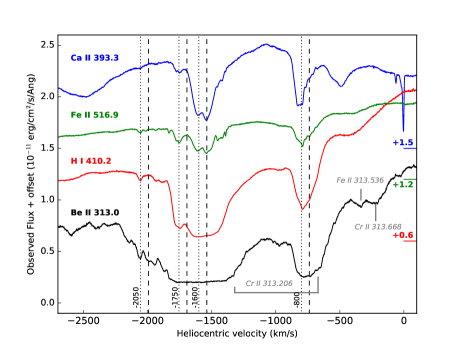
At early epochs the spectra of the Nova show several broad emission lines of neutral hydrogen and other permitted transitions of neutral or singly ionised species often accompanied by sharp and blue-shifted multiple absorption components reaching blue edge velocities of -2300 km s-1. Fig 1 displays portions of the Nova spectrum of day 58 in the proximity of H , Ca ii K , Fe ii 519.0 and Be ii 313.0 nm lines. These lines show several absorption components at heliocentric and km s-1with the more prominent ones marked with vertical black dotted lines in the figure. Ca ii K shows also narrow absorption components at and km s-1 velocities caused by intervening Galactic interstellar medium. At the wavelength of the Be ii 313.1 nm doublet there is P-Cygni profile with a huge blue-shifted absorption that Tajitsu et al. (2016) identified as 7Be . In Fig 2 we zoomed the component at km s-1which is seen only at this epoch and provides a robust identification. The two sharp absorption components (FWHM 0.19 Å) are separated by 0.654 Å which corresponds precisely to the separation of the 7Be ii resonance doublet of 313.0583, 313.1228 nm. Moreover, the component is perfectly aligned in radial velocity with the other species providing evidence that it is 7Be ii and not 9Be ii which has an isotopic shift of km s-1. The dips of each line of the 7Be ii doublet can be identified also at km s-1in Fig 1 , but become hard to see in the flat bottoms of the other components. At velocities km s-1 the absorption profile ascribable to Be follows mainly the hydrogen lines rather than the metallic lines which are very weak or absent. If based only on this spectrum the identification of this part of absorption with 7Be ii would therefore be controversial.
| Date | UT | MJD | Day | 346 | 437 | 564 | 760 |
|---|---|---|---|---|---|---|---|
| 2015 | h m | 57000 | a.m. | s | s | s | s |
| 05-19 | 08 49 | 161.36 | 58.7 | 400 | 2x150 | 2x100 | 2x150 |
| 05-24 | 05 49 | 166.24 | 63.6 | 2x400 | 2x150 | 4x100 | 2x150 |
| 05-30 | 03 20 | 172.14 | 69.5 | 400 | 100 | 9x7 | 3x10 |
| 06-03 | 05 18 | 176.22 | 73.6 | 400 | 100 | 9x7 | 3x7 |
| 06-12 | 05 25 | 185.23 | 82.6 | 400 | 60 | 9x7 | 2x10 |
| 06-19 | 01 29 | 192.06 | 89.4 | 2x602 | 2x60 | 22x15 | 3x15 |
The bottoms of the strong lines in Fig 1 are totally flat suggesting that the absorption is saturated but with the absorbing material only partially covering the background light source. The Balmer lines also show flat bottoms. At this epoch in correspondence of the 7Be ii the intensities are 50 % but the intensity value varies with the day and the geometry of the outburst.
The 7Be ii absorption may be contaminated by the presence of other Fe-peak elements. Evidence is found for the presence of Cr ii (5) multiplet. The Cr ii 313.2056 nm line is observed resolved both in the , km s-1components. The Cr ii (5) 313.6680 and 312.8699 nm and the Fe ii (82) 313.5360 nm lines are now seen at km s-1. The Cr ii 312.4978 nm line of the same multiplet (5) and with comparable intensity should therefore be present and contribute to the main absorption. Other lines show up on day 82 and are listed in Table 2.
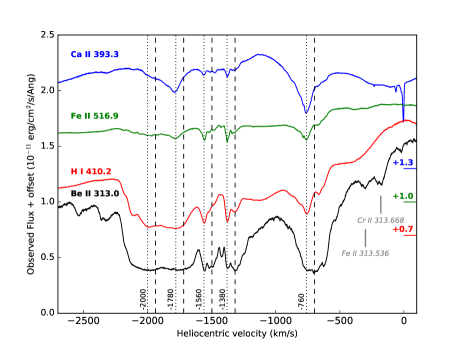
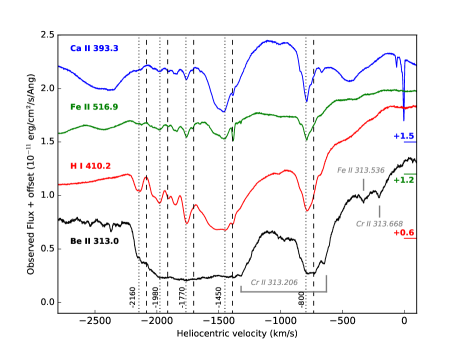
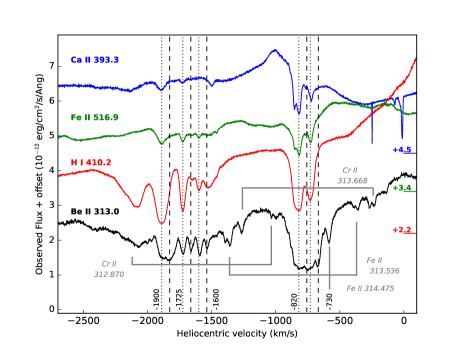
Fig 3 displays portions of the Nova spectrum obtained on day 63. The components at velocities and km s-1become sharper and it is possible to identify the partially resolved component of the 7Be ii 313.1228 nm line shown in the figure by vertical blue dashed lines. In addition, some absorption consistent with its presence can be observed in the km s-1component as well as in all other lines. It is quite remarkable that while H shows some structure, 7Be does not, and this is likely due to the presence of the doublet lines filling the inter-component velocity-space. Fig 4 displays the spectrum obtained on day 69 which is very close to the spectrum analysed by Tajitsu et al. (2016). As it can be seen the narrow component identified by Tajitsu et al. (2016) as 7Be ii 313.1228 nm is blended with the km s-1component of the Cr ii 313.2058 nm. Fig 5 displays portions of the spectrum obtained on day 73. At this epoch the high velocity components at km s-1weaken considerably in 7Be ii revealing the presence of the 7Be ii 313.1228 nm line in the components marked with a dashed blue line in the figure. To note that at this day the 7Be ii absorption spans wider velocities than H. Fig 6 displays portions of the spectrum obtained on day 82. At this epoch the high velocity components of 7Be ii weaken considerably revealing few resolved components previously hidden inside the absorption. The 7Be ii 313.1228 nm line is partially resolved in the two components which break up at velocities km s-1and is fully resolved in the components at velocities between and km s-1which were previously strongly saturated. After few days from this observation all the metallic components disappeared and therefore later observations are not considered here. Due to the weakening of the 7Be ii on day 82 also the metallic contaminants due to iron-peak elements appear very clearly. The Cr ii (5) 313.6680 nm and the Fe ii (82) 313.5360 and 314.4751 nm lines are now seen at km s-1and should have been present also in the previous epochs but completely obscured by the strong 7Be ii absorption. The Cr ii (5) 313.6680 and 312.8699 nm and the Fe ii (82) 313.5360 nm lines are now seen at km s-1. Scaling with the relative strengths of the other iron-peak elements we estimate that the combined contributions of these contaminants are 3.5 % of the total equivalent widths of the 7Be ii absorption.
2.2 7Be abundance
The abundance of 7Be can be estimated by comparing the equivalent widths and for unsaturated and resolved lines, assuming that the covering factor of the absorbing expanding shell is constant with wavelength. Ca is not a Nova product and can be taken as a reference element. The more suitable components are the features of 7Be ii and the Ca ii K lines observed at km s-1 on day 82. Though, we are aware that these abundances do not necessarily represent the abundances in the whole materials ejected.
Following Spitzer (1998) and Tajitsu et al. (2015) the ratio of column densities, , can be written as
| (1) |
For the components at km s-1 on day 82 we measured = (0.095 +0.060) = 0.155 Å and the = 0.019 Å which provide a column density ratio of = . Assuming that most of 7Be and Ca are in the singly ionised state as discussed in Tajitsu et al. (2016) these are also the relative elemental abundances. The presence of Na i in the blue-shifted absorption line systems along with the presence of Ca i on day 58 , as shown below, and the absence of doubly ionised iron-peak elements support this assumption. Since our measurement refers to day 82 after maximum and 7Be decays to 7Li via K-electron capture with a half-life of 53.22 days, the amount of 7Be freshly produced by the Nova should have been 3 times larger which gives an atomic fraction of 53. We can determine the 7Be abundance also for the component at km s-1 on day 58, which is fully resolved but slightly saturated. In this case we have = (0.089 +0.073) = 0.162 Å and the = 0.011 Å which provides a = 31.9. Considering that on day 58 the original value should have been a factor 2.15 larger, we obtain an original atomic fraction of 69, which is quite consistent with the former value considering the uncertainties involved. Tajitsu et al. (2016) derived a N(7Be ii)/N(Ca ii) = 8.1 2.0 in the component at 786 km s-1on day 63 without considering 7Be ii decay. Since this component is saturated, the derived abundance is a lower limit and therefore the two measurements are consistent with each other.
2.3 Nova 7Be production
Thermonuclear production of 7Be during the Nova explosions of hydrogen-rich layers containing some 3He has been proposed by Arnould & Norgaard (1975) and Starrfield et al. (1978). Peak temperatures of 150 million K are reached in the burning regions and 7Be is readily formed from the 3He coming from the companion star via the reaction 3He (, )7Be (Hernanz et al., 1996). In this hot environment 7Be can be also destroyed and it needs to be carried to cooler regions by convection on a time scale shorter than the destruction time scale as in the Cameron-Fowler mechanism (Cameron & Fowler, 1971). The cooler regions are subsequently ejected and observed in absorption in the Nova outburst. Carbon and oxygen (CO) Novae destroy less 3He with respect to oxygen and neon (ONe ) Novae, and therefore CO Novae have higher 7Be yields (José & Hernanz, 1998).
The detection of 7Be in the post-outburst spectra of Nova Sagittarii 2015 shows that thermonuclear production of 7Be is effectively taking place. The fact that 7Be is detected at all velocities implies that all the absorption components are made of ejecta which have experienced thermonuclear runaway nucleosynthesis. However, the observed yields are larger by about one order of magnitude than predicted by the models of José & Hernanz (1998)and even more if compared with the models of Boffin et al. (1993). The number of freshly produced 7Be atoms in Nova ejecta is necessarily lower than that of 3He atoms in the accreted gas from the donor star or produced in situ as a result of the so called 3He bump (Denissenkov et al., 2013). This implies that the fraction of (3He/H) should be greater than .
| Lines | (Å) | (mÅ) | (mÅ) | ||
|---|---|---|---|---|---|
| Cr ii (5) | 3120.3691 | 16: 8 | - | ||
| Cr ii (5) | 3124.973 | b | b | ||
| Cr ii (5) | 3128.700 | 25 7 | b | ||
| Cr ii (5) | 3132.053 | b | b | ||
| Fe ii (82) | 3135.360 | 40 7 | 104 10 | ||
| Cr ii (5) | 3136.681 | 45 8 | 51 15 | ||
| Fe ii (82) | 3144.751 | b | 83 10 |
2.4 Nova 7Li production
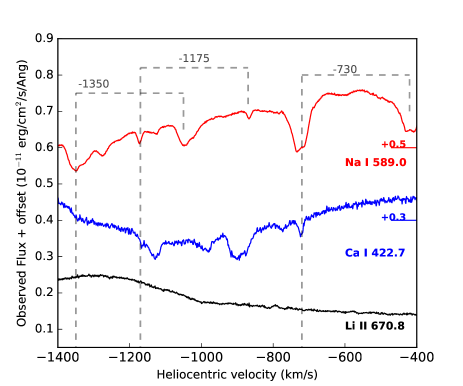
The 7Be decays to 7Li with a half-life of 53.22 days which is comparable with our temporal span. However, we do not detect counterparts of blue-shifted absorption line systems of the 7Li i 670.8 nm in spite of the high signal-to-noise ratios of our spectra. Figure 7 displays the spectrum on day 58 in the vicinity of 7Li i 670.8 nm, Na i D doublet and Ca i 422.7 nm lines. The other epochs are similar with the only difference that the trace Ca i disappears. We note however that while Ca i is non present the Na i D lines are relatively strong and the complete absence of 7Li is rather puzzling. It is interesting to report that these lines have been detected in the first three weeks spectra of Nova Centauri 2013 (Izzo et al., 2015) and that Izzo & et al (2016) detected 7Li i 670.8 nm in spectra of V5668 Sgr taken on day 7. The non detection of 7Li in our observations implies that the ejected gas has a temperature high enough that almost all Li and Ca atoms are ionised. Normally Li is not detected in Novae outburst spectra and the unique Li i detection by Izzo et al. (2015) implies that the physical conditions in the ejecta permit the survival of neutral 7Li i only in the very early stages. Since 7Be ii decays to 7Li ii the non detection of 7Li i in our epochs requires that 7Li remains singly ionised while some Na i survives.
Since 7Be 7Li the fraction derived here corresponds to a 7Li logarithmic overabundances of + 4.7 dex with respect to the meteoritic value (Lodders, Palme & Gail, 2009), which is even higher than the overabundance of 4 dex obtained by Izzo et al. (2015) in Nova Centauri 2013. Theoretically the amount of 7Li is a sensitive function of the conditions achieved in the outburst and from the initial 3He of the companion star, and are expected to vary. The Novae in which 7Li or 7Be have been detected to date are all slow Novae characterised by . However, it is quite remarkable that large 7Be yields are observed in all three Novae where 7Be ii has been searched for. For a total ejected mass of 10 the observed overproduction factor of V5668 Sgr implies a production of 10. The global Nova rate in the Galaxy is known within a factor two ( yr-1) (della Valle & Livio, 1994; Shafter, 2016). and the slow Novae account for 10% of the whole population (della Valle & Duerbeck, 1993). However, a rate of 2 yr-1 of slow Nova events with the observed 7Li overproduction in a Galaxy lifetime of 1010 yr is enough to produce 140 . This is comparable with the 150 estimated to be present in the Milky Way inclusive of the 40 produced in the Big Bang (Fields, Molaro & Sarkar, 2014). Thus, the slow Novae could indeed be the main factories of 7Li in the Galaxy.
3 Summary and conclusions
We have analysed UVES high resolution observations of V5668 covering six outburst phases from day 58 to day 89 from maximum. The evolution of the absorption offers clear evidence in support of the identification of 7Be ii by Tajitsu et al. (2016). In particular, the weakening of the 7Be ii absorptions at a late epoch shows that the iron-peak species are a minor contaminant. By means of unsaturated Be ii components we derived an abundance of 53-69 when the 7Be decay is taken into account. Assuming all the 7Be goes into 7Li this corresponds to a 7Li overproduction of 4.7 - 4.9 dex over the solar-meteoritic value. We then argue that a rate of 2 yr-1 of such events in a Galaxy lifetime, i.e. only a small fraction of all Novae, could be responsible for the production of the whole 7Li required from stellar sources.
We also notice that such a high 7Be production should increase the probability of detecting the 478-keV -ray photons emitted in the 7Be to 7Li reaction which have been so far elusive despite several -ray searches.
Acknowledgments
This is an ESO DDT program and we acknowledge the ESO director for this opportunity and the ESO staff for care and competence in making the observations. LI acknowledges support from the Spanish research project AYA 2014-58381-P.
References
- Arnould & Norgaard (1975) Arnould M., Norgaard H., 1975, A&A, 42, 55
- Boffin et al. (1993) Boffin H. M. J., Paulus G., Arnould M., Mowlavi N., 1993, A&A, 279, 173
- Cameron & Fowler (1971) Cameron A. G. W., Fowler W. A., 1971, ApJ, 164, 111
- della Valle & Duerbeck (1993) della Valle M., Duerbeck H. W., 1993, A&A, 271, 175
- della Valle & Livio (1994) della Valle M., Livio M., 1994, A&A, 286
- Denissenkov et al. (2013) Denissenkov P. A., Herwig F., Bildsten L., Paxton B., 2013, ApJ, 762, 8
- Fields, Molaro & Sarkar (2014) Fields B. D., Molaro P., Sarkar S., 2014, ArXiv e-prints
- Hernanz et al. (1996) Hernanz M., Jose J., Coc A., Isern J., 1996, ApJ, 465, L27
- Izzo et al. (2015) Izzo L. et al., 2015, ApJ, 808, L14
- Izzo & et al (2016) Izzo L., et al, 2016, in preparation
- José & Hernanz (1998) José J., Hernanz M., 1998, ApJ, 494, 680
- Lodders, Palme & Gail (2009) Lodders K., Palme H., Gail H.-P., 2009, Landolt Börnstein
- Rebolo, Beckman & Molaro (1988) Rebolo R., Beckman J. E., Molaro P., 1988, A&A, 192, 192
- Romano et al. (1999) Romano D., Matteucci F., Molaro P., Bonifacio P., 1999, A&A, 352, 117
- Seach (2015) Seach J., 2015, Central Bureau Electronic Telegrams, 4080
- Shafter (2016) Shafter A. W., 2016, ArXiv e-prints
- Spitzer (1998) Spitzer L., 1998, Physical Processes in the Interstellar Medium. p. 335
- Starrfield et al. (1978) Starrfield S., Truran J. W., Sparks W. M., Arnould M., 1978, ApJ, 222, 600
- Tajitsu et al. (2015) Tajitsu A., Sadakane K., Naito H., Arai A., Aoki W., 2015, Nature, 518, 381
- Tajitsu et al. (2016) Tajitsu A., Sadakane K., Naito H., Arai A., Kawakita H., Aoki W., 2016, ApJ, 818, 191