Primeval very low-mass stars and brown dwarfs – I. Six new L subdwarfs, classification and atmospheric properties
Abstract
We have conducted a search for L subdwarf candidates within the photometric catalogues of the UKIRT Infrared Deep Sky Survey and Sloan Digital Sky Survey. Six of our candidates are confirmed as L subdwarfs spectroscopically at optical and/or near-infrared wavelengths. We also present new optical spectra of three previously known L subdwarfs (WISEA J001450.17-083823.4, 2MASS J00412179+3547133 and ULAS J124425.75+102439.3). We examined the spectral type and metallicity classification of subclasses of known L subdwarfs. We summarized the spectroscopic properties of L subdwarfs with different spectral types and subclasses. We classify these new L subdwarfs by comparing their spectra to known L subdwarfs and L dwarf standards. We estimate temperatures and metallicities of 22 late-type M and L subdwarfs by comparing their spectra to BT-Settl models. We find that L subdwarfs have temperatures between 1500 and 2700 K, which are higher than similar-typed L dwarfs by around 100–400 K depending on different subclasses and subtypes. We constrained the metallicity ranges of subclasses of M, L, and T subdwarfs. We also discussed the spectral-type and absolute magnitude relationships for L and T subdwarfs.
keywords:
(:) brown dwarfs – stars: chemically peculiar – stars: individual: ULAS J021642.97+004005.6, ULAS J124947.04+095019.8, SDSS J133348.24+273508.8, ULAS J133836.97022910.7, SDSS J134749.74+333601.7, ULAS J151913.03000030.0 – stars: low-mass – stars: Population II – (:) subdwarfs1 Introduction
Metal-deficient very low-mass stars (VLMS) and brown dwarfs (BDs) are primeval populations in the Galaxy’s ancient halo, and represent extremes in low metallicity and old age among Galactic populations. They can reveal the fundamental interior structure physics around the substellar mass limit, and are crucial to our understanding of complex ultra-cool atmospheres and the star formation mechanisms of the early Universe. VLMS ( 0.5 M☉; Grossman, Hays, & Graboske, 1974; Baraffe et al., 1995) are red dwarfs at the low-mass end of the Hertzsprung–Russell diagram’s stellar main sequence. BDs are substellar objects with masses below the hydrogen burning minimum mass, which ranges from 0.075 to 0.092 M☉ for solar to primordial metallicities according to theoretical models (Burrows et al., 2001). Primeval VLMS with 0.1 M☉ and BD have subsolar metallicity and are generally referred to as ultra-cool subdwarfs (UCSDs).
VLMS and BDs are classified as M, L, T, and Y types according to spectral morphology that is dominated by temperature-dependent chemistry and thermal emission (Kirkpatrick, Henry, & McCarthy, 1991; Kirkpatrick et al., 1999; Martín et al., 1999; Burgasser et al., 2002; Cushing et al., 2011). A massive BD could be a late-type M dwarf when it is about 0.1 Gyr old, but then cools becoming a late-type L dwarf after about 10 Gyr. L subdwarfs represent the lowest mass stars with subsolar metallicity and also include massive metal-poor BDs (e.g. 2MASS J05325346+8246465, referred to as 2M0532; Burgasser et al., 2008b). L subdwarfs (e.g. 2M0532; Burgasser et al., 2003) exhibit characteriztic spectral signatures due to strong metal hydrides (e.g. FeH), weak or absent metal oxides (e.g. VO and CO), and enhanced collision-induced H2 absorption (CIA H2; Bates, 1952; Borysow, Frommhold, & Moraldi, 1989; Borysow, Jorgensen, & Fu, 2001; Abel et al., 2012; Saumon et al., 2012) in the near-infrared (NIR).
Modern large-scale optical and NIR surveys have the capability to identify L subdwarfs, although they are very rare compared to L dwarfs. About 22 L subdwarfs have been reported in the literature from different surveys (see Section 4.3). The Two Micron All Sky Survey (2MASS; Skrutskie et al., 2006) observed in three NIR filters (, and ), and searches therein have yielded eight L subdwarfs (Burgasser et al., 2003; Burgasser, 2004a; Burgasser et al., 2004b, 2008c; Cushing et al., 2009; Kirkpatrick et al., 2010). Scholz, Lodieu, & McCaughrean (2004) discovered an L subdwarf by its high proper motion, measured across 2MASS and SuperCOSMOS Sky Survey epochs (Hambly et al., 2001). The Sloan Digital Sky Survey (SDSS; York et al., 2000) has imaged 14555 deg2 of the sky in five optical bands (), yielding several L subdwarfs with and band detections. In addition two L subdwarfs have been identified using the SDSS spectroscopic survey (e.g. Sivarani et al., 2009; Bowler, Liu, & Dupuy, 2010; Schmidt et al., 2010; Burningham et al., 2010). The UKIRT Infrared Deep Sky Survey (UKIDSS; Lawrence et al., 2007) Large Area Survey (hereafter ULAS) has imaged 3500 deg2 of sky in four NIR filters (, and ), and is about three magnitudes deeper than 2MASS (thus being sensitive to a volume of about 5.5 times larger). UKIDSS has yielded three L subdwarfs to date (e.g. Lodieu et al., 2010, 2012). Most recently the Wide-field Infrared Survey Explorer (WISE; Wright et al., 2010) has revealed eight L subdwarfs (Luhman & Sheppard, 2014; Kirkpatrick et al., 2014, 2016).
Model atmospheres (Allard & Hauschildt, 1995; Witte, Helling, & Hauschildt, 2009) have been developed and used to characterize VLMS and BD (e.g. Burgasser et al., 2009). The BT-Settl models (Allard, Homeier, & Freytag, 2011; Allard et al., 2013; Allard, Homeier, & Freytag, 2014) cover a wide range of metallicity, and their success at reproducing observed L subdwarf spectral energy distributions (SEDs) suggests that they are an effective means to estimate their atmospheric parameters.
The classification scheme for L subdwarfs has not been fully established due to the small number of confirmed objects. A method is proposed to assign spectral types for L subdwarfs by comparing their optical spectra to those of L dwarfs (Burgasser, Cruz, & Kirkpatrick, 2007a). Metallicity subclasses for L subdwarfs are also unclear; however, d/sdL (mildly metal-poor), sdL, and esdL (extremely metal-poor) subclasses have been proposed (e.g. Burgasser, Cruz, & Kirkpatrick, 2007a; Kirkpatrick et al., 2010), and metallicity-sensitive signatures are observed in a number of L subdwarf spectra (e.g. Fig 29 of Kirkpatrick et al., 2010).
To properly understand and characterize L subdwarfs, it is necessary to identify a sample that covers a wide range of effective temperature () and metallicity. In this paper we present the discovery of six new L subdwarfs. Our candidate selection process is presented in Section 2. Section 3 presents the follow up spectroscopic observations. Section 4 describes our spectral classification and characterization of L subdwarfs. Atmospheric properties of UCSDs derived through model comparison are presented in Section 5. Finally, Sections 6 and 7 present further discussion and a summary.
| Name | SpT | SDSS i | SDSS z | UKIDSS Y | UKIDSS J | UKIDSS H | UKIDSS K | Ref |
|---|---|---|---|---|---|---|---|---|
| ULAS J021642.97+004005.6 | sdL4 | 22.140.15 | 20.030.10 | 18.410.05 | 17.300.03 | 16.960.04 | 16.510.04 | 1 |
| ULAS J124947.04+095019.8 | sdL1 | 20.390.04 | 18.660.04 | 17.620.02 | 16.830.02 | 16.400.03 | 16.120.04 | 1 |
| SDSS J133348.24+273508.8 | sdL1 | 20.510.05 | 18.750.04 | 17.470.02 | 17.470.02 | 16.620.01 | 16.000.02 | 1 |
| ULAS J133836.97022910.7 | sdL7 | 22.470.26 | 20.060.14 | 18.560.06 | 17.370.03 | 16.810.04 | 16.370.05 | 1 |
| SDSS J134749.74+333601.7 | sdL0 | 19.870.03 | 18.060.02 | 16.660.01 | 15.850.01 | 15.460.01 | 15.270.02 | 1 |
| ULAS J151913.03000030.0 | esdL4 | 21.460.09 | 19.330.06 | 18.190.03 | 17.210.02 | 17.070.03 | 16.970.04 | 1 |
| ULAS J033350.84+001406.1 | sdL0 | 19.240.02 | 17.870.02 | 16.810.01 | 16.110.01 | 15.770.01 | 15.500.02 | 2 |
| 2MASS J11582077+0435014 | sdL7 | 21.020.08 | 18.150.03 | 16.610.01 | 15.430.00 | 14.880.01 | 14.370.01 | 3 |
| ULAS J124425.90+102441.9 | esdL0.5 | 19.480.02 | 18.010.02 | 16.980.01 | 16.260.01 | 16.000.01 | 15.770.02 | 2 |
| ULAS J135058.86+081506.8 | usdL3 | 21.250.08 | 19.520.06 | 18.660.05 | 17.930.04 | 18.070.10 | 17.950.15 | 4 |
| SDSS J141624.08+134826.7 | sdL7 | 18.370.02 | 15.890.02 | 14.260.00 | 12.990.00 | 12.470.00 | 12.050.00 | 5 |
2 Candidate selection
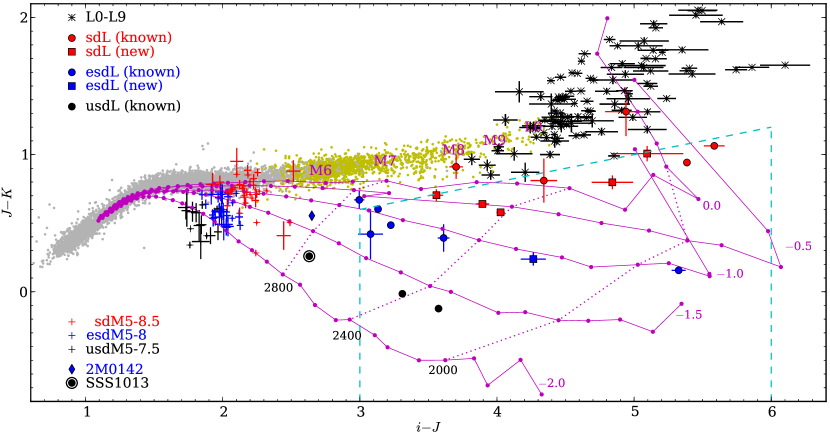
L subdwarfs are kinematically associated with the Galactic halo and thick disc, and thus they generally have high space velocities relative to the Sun, and hence have higher proper motions and larger dispersion of radial velocities than the disc population. L subdwarfs also have bluer optical and NIR colours (e.g. and , see Fig. 1) than L dwarfs due to a variety of factors including flux suppression due to enhanced CIA H2 which is stronger in the band than in the band. We conducted a search for L subdwarf candidates by combining the ULAS and SDSS data bases. We used both photometric and proper motion ( 100 mas yr-1) criteria to select L subdwarf candidates from the 10th data release of ULAS and the 8th data release of SDSS, which have a coverage overlap of over 3000 deg2. Our photometric selection criteria consist of five colour cuts and one magnitude cut:
| (1) | |||
| (2) | |||
| (3) | |||
| (4) | |||
| (5) | |||
| (6) |
These criteria are based on the colours of known L subdwarfs (e.g. table 6 in Kirkpatrick et al., 2014) and consideration of the colours of M, L, and T dwarfs (West et al., 2008; Day-Jones et al., 2013) which we wish to reject. Criterion (1) rejects early-type stars which have bluer colour. Criteria (2) and (3) reject M and L dwarfs which have redder colours. Criteria (4) and (5) reject M subdwarfs and T dwarfs which are bluer and redder (by or colours) than L subdwarfs, respectively. Criterion (6) rejects bright early-type stars and targets which are too faint to have good optical detection by SDSS or difficult for spectroscopic follow up. To take account of a broader range of SDSS imaging, we also performed a visual inspection of candidates using the SDSS Navigate tool. Known L subdwarfs all appear red in the combined false colour images presented by Navigate, and we thus rejected objects that appeared as blue, yellow or orange. Typically, such objects are mismatches or earlier-type objects with poor photometric calibration.
Objects that survived our colour cuts and visual inspection were advanced for proper motion assessment based on ULAS and SDSS multi-epochs imaging (following Zhang et al., 2009). Proper motions were calculated based on coordinate and epoch differences between SDSS and UKIDSS observations. We only use proper motions for 80 percent of our candidates which have baselines of 1–10 yr. Objects with proper motion less than 100 mas yr-1 were rejected unless they had very blue . We thus only used our proper motion criterion for less extreme colours where contamination rates will be greater. The proper motion criterion was not adopted for the 20 percent of objects for which the SDSS–UKIDSS baseline was less than a year.
In this way we selected 66 candidates, which included 5 previously known L subdwarfs. Six of our new candidates were subsequently confirmed spectroscopically as L subdwarfs (see Section 3), and their and colours are plotted in Fig. 1 which provide a comparison with other populations and models. Table 1 presents the photometry of five known and six new L subdwarfs. Another 28 new subdwarfs (including 1 usdL5, 6 esdL0–esdL5, and 21 sdL0–sdT0) spectroscopically confirmed from our sample will be presented in a following paper.
| Name | Telescope | Instrument | UT date | Seeing | Airmass | (VIS) | Slit | (NIR) | Slit | Telluric | SpT | ||
|---|---|---|---|---|---|---|---|---|---|---|---|---|---|
| (′′) | (m) | (arcsec) | (s) | (m) | (arcsec) | (s) | Star | ||||||
| (1) | (2) | (3) | (4) | (5) | (6) | (7) | (8) | (9) | (10) | (11) | (12) | (13) | (14) |
| WISEA J001450.17083823.4 | GTC | OSIRIS | 2015-08-23 | 0.70 | 1.267 | 0.50–1.02 | 0.8 | 1 500 | — | — | — | — | — |
| 2MASS J00412179+3547133 | GTC | OSIRIS | 2015-08-20 | 0.80 | 1.048 | 0.50–0.92 | 0.8 | 1 500 | — | — | — | — | — |
| ULAS J021642.97+004005.6 | VLT | X-shooter | 2012-01-29 | 0.67 | 1.488 | 0.53–1.02 | 0.9 | 4 400 | 0.99–2.48 | 0.9 | 4 490 | HD 16031 | F0V |
| ULAS J021642.97+004005.6 | VLT | X-shooter | 2014-02-17 | 0.98 | 1.252 | 0.53–1.02 | 0.9 | 12 283 | 0.99–2.48 | 0.9 | 12 296 | HD 16031 | F0V |
| 2MASS J061640066407194 | VLT | X-shooter | 2016-01-24 | 1.19 | 1.315 | 0.53–1.02 | 1.2 | 12 290 | 0.99–2.48 | 1.2 | 12 300 | HR 3300 | A0V |
| ULAS J124425.75+102439.3 | Magellan | IMACS | 2010-05-05 | — | 1.298 | 0.65–1.02 | 0.9 | 3 1800 | — | — | — | — | — |
| ULAS J124947.04+095019.8 | Magellan | FIRE | 2012-05-08 | — | 1.284 | — | — | — | 0.82–2.50 | 0.6 | 4 148 | HD110749 | A0V |
| SDSS J133348.24+273508.8 | SDSS | SDSS | 2008-02-18 | 1.52 | 1.112 | 0.38–0.92 | 3.0 | 1 2400 | — | — | — | Unknown | — |
| SDSS J133348.24+273508.8 | GTC | OSIRIS | 2013-12-23 | 1.10 | 1.385 | 0.50–1.00 | 1.0 | 3 900 | — | — | — | — | — |
| ULAS J133836.97022910.7 | Magellan | FIRE | 2012-05-08 | — | 1.122 | — | — | — | 0.82–2.50 | 0.6 | 8 148 | HD110749 | A0V |
| SDSS J134749.74+333601.7 | SDSS | BOSS | 2012-10-24 | 1.37 | 1.030 | 0.36–1.04 | 2.0 | 1 5405 | — | — | — | Unknown | — |
| ULAS J151913.03000030.0 | VLT | X-shooter | 2012-01-29 | 1.33 | 1.819 | 0.53–1.02 | 0.9 | 4 400 | 0.99–2.48 | 0.9 | 4 490 | HD 62388 | A0V |
| ULAS J151913.03000030.0 | VLT | X-shooter | 2013-04-06 | 0.63 | 1.435 | 0.53–1.02 | 0.9 | 4 205 | 0.99–2.48 | 0.9 | 4 290 | HD 130163 | A0V |
| ULAS J151913.03000030.0 | VLT | X-shooter | 2016-03-22 | — | 1.131 | 0.53–1.02 | 1.2 | 12 290 | 0.99–2.48 | 1.2 | 12 300 | HR 6633 | B9/A0III |
3 Spectroscopic observations
A summary of the characteriztics of the spectroscopic observations presented in this paper is given in Table 2. Columns 1–6 give names of targets, telescope, spectrograph, observation date, seeing and airmass. Columns 7–9 and 10–12 give wavelength ranges, slit width (fibre diameter for SDSS), numbers of exposures, and integration times for optical and NIR observations, respectively. Columns 13–14 give telluric stars and their spectral types. Observed spectra are plotted in Figs 2–4.
3.1 New L subdwarfs
ULAS J151913.03000030.0 (UL1519) and ULAS J021642.97+004005.6 (UL0216) were first confirmed with the X-shooter spectrograph (Vernet et al., 2011) on the Very Large Telescope (VLT) on 2012 January 29 with total integration times of 1960 s in the NIR and 1600 s in the visible (VIS), as backup targets of a large programme (Day-Jones et al., 2013; Marocco et al., 2015). X-shooter has a resolving power of 5100 in the NIR arm and 8800 in the VIS arm with a 0.9 arcsec slit. With a 1.2 arcsec slit it has a resolving power of 4000 in the NIR arm and 6700 in VIS arm. A second X-shooter spectrum of UL1519 was observed in much better seeing and at lower airmass on 2013 April 6 with a total integration time of 1160 s in the NIR and 820 s in the VIS arms. We started a follow up programme of known L subdwarfs with X-shooter in 2014. We observed UL0216 on 2014 February 17 with total integration times of 3552 s in the NIR and 3396 s in the VIS. We observed UL1519 on 2016 March 22 with total integration times of 3600 s in the NIR and 3480 s in the VIS. All X-shooter spectra were observed in an ABBA nodding mode, and reduced with ESO Reflex (Freudling et al., 2013). Telluric correction was achieved using telluric standard stars observed on the same night as our targets and at similar airmass; see Table 2 for more details of our observations.
The first and the second spectra of both UL0216 and UL1519 have a signal-to-noise ratio (SNR per pixel) of 2 at 0.9 m. The first and the second spectra of UL0216 have SNR 7 and 10 at 1.3 m, respectively. The first and second spectra of UL1519 both have an SNR of 8 at 1.3 m. The third spectrum of UL1519 has SNR of 12 at both 0.9 and 1.3 m. Two spectra of UL0216 were also combined to produce a better SNR (3 at 0.9m and 12 at 1.3 m) with a total integration time of 5512 s in the NIR and 4996 s in the VIS arm. Three spectra of UL1519 were combined to produce a better SNR (13 at 0.9m and 16 at 1.3 m) with a total integration time of 6720 s in the NIR and 5900 s in the VIS arms. X-shooter spectra plotted in Fig. 2 are smoothed by 100 pixels for the VIS arm and 50 pixels for the NIR arm, which increased the SNR by a factor of 10 and 7 times, respectively and reduced the resolving power to 800 in both VIS and NIR.
ULAS J124947.04+095019.8 (UL1249) and ULAS J133836.97-022910.7 (UL1338) were observed with the Folded-port InfraRed Echellette (FIRE; Simcoe et al., 2008) spectrograph on the Magellan Telescopes on 2012 May 8, using a total integration time of 592 s for UL1249 and 1184 s for UL1338. Spectra were obtained in the prism mode which provides a resolving power of 400 near 1.25 m. Spectra were reduced with the FIREHOSE data reduction pipeline111The pipeline tools are implemented in IDL, and are written by Rob Simcoe, John Bochanski, and Mike Matejek. Many others have contributed unwittingly to the underlying algorithms, including Joe Hennawi, Scott Burles, David Schlegel, and Jason Prochaska. Several of the routines draw from the Spextool pipeline, written by Mike Cushing, Bill Vacca, and John Rayner. which is based on the MASE pipeline (Bochanski et al., 2009), and the telluric correction methodology of Vacca, Cushing, & Simon (2004) as integrated into SpeXtool (Cushing et al., 2003). Telluric absorptions in UL1249 and UL1338 are corrected with an A0V star (see Table 2). Spectra of UL1249 and UL1338 have SNR of 50 and 40, respectively at around 1.3 m.
SDSS J133348.24+273508.8 (SD1333) and SDSS J134749.74+333601.7 (SD1347) were observed by the SDSS Legacy and BOSS spectroscopic surveys, respectively. An optical spectrum of SD1333 was observed with the original SDSS spectrographs on 2008 February 18. The SDSS spectrum of SD1333 has an SNR of about 3 at 0.9 m. Another optical spectrum of SD1333 was obtained with the Optical System for Imaging and low-Intermediate-Resolution Integrated Spectroscopy (OSIRIS; Cepa et al., 2000) instrument on the Gran Telescopio Canaries (GTC). The spectrum was reduced using standard procedures within IRAF222IRAF is distributed by the National Optical Observatory, which is operated by the Association of Universities for Research in Astronomy, Inc., under contract with the National Science Foundation.. It has a mean resolving power of 500 and an SNR of 150 at 0.81 m. A B1-type star, Hilt 600, was used as a standard for flux calibration. Telluric absorptions in the spectrum are not corrected. An optical spectrum of SD1347 was observed with the BOSS Spectrographs on 2012 October 24. The SDSS spectrum of SD1347 has an SNR of 24 at 0.9 m and a resolving power of 2000. Telluric absorptions in SDSS spectra are corrected. The spectrum of SD1347 in Fig. 3 is smoothed by 5 pixels for display.
3.2 Known L subdwarfs
ULAS J124425.75+102439.3 (UL1244) was discovered as an sdL0.5 subdwarf by Lodieu et al. (2012). We observed it as an L subdwarf candidate with the Inamori Magellan Areal Camera and Spectrograph (IMACS; Dressler et al., 2011) Short-Camera on the Baade Magellan Telescope with a total integration time of 5400 s on 2010 May 5. The spectrum covered a wavelength range of 0.65–1.02 m, and has a resolving power of 1000. The spectrum was reduced using standard procedures within IRAF and has an SNR of 60 around 0.81 m. A B9V-type star, Hip 77673, was used as a standard for flux calibration. Telluric absorptions in the spectrum are not corrected.
WISEA J001450.17-083823.4 (WI0014) was discovered as an sdL0 subdwarf in the optical (Kirkpatrick et al., 2014) and NIR (Luhman & Sheppard, 2014). The confirmed optical spectrum of WI0014 has a spectral range covering 0.55–0.8 m, and we obtained a new optical spectrum covering the 0.65–1.02 m with OSIRIS on 2015 August 23. The OSIRIS spectrum of WI0014 has a resolving power of 300, and an SNR of 300 at 0.81 m. 2MASS J00412179+3547133 (2M0041) was identified as an sdL candidate by its NIR spectrum (Burgasser et al., 2004b). There are no optical spectra of 2M0041 in the literature, and we Therefore, obtained an optical spectrum with OSIRIS on 2015 August 20. The OSIRIS spectrum of 2M0041 has a mean resolving power of 300, and an SNR of 70 at 0.81 m. Spectra of WI0014 and 2M0041 were reduced using standard procedures within IRAF. A DZA5.5-type white dwarf, Ross 640, was used as a standard for flux calibration. Telluric absorptions in the spectrum are not corrected.
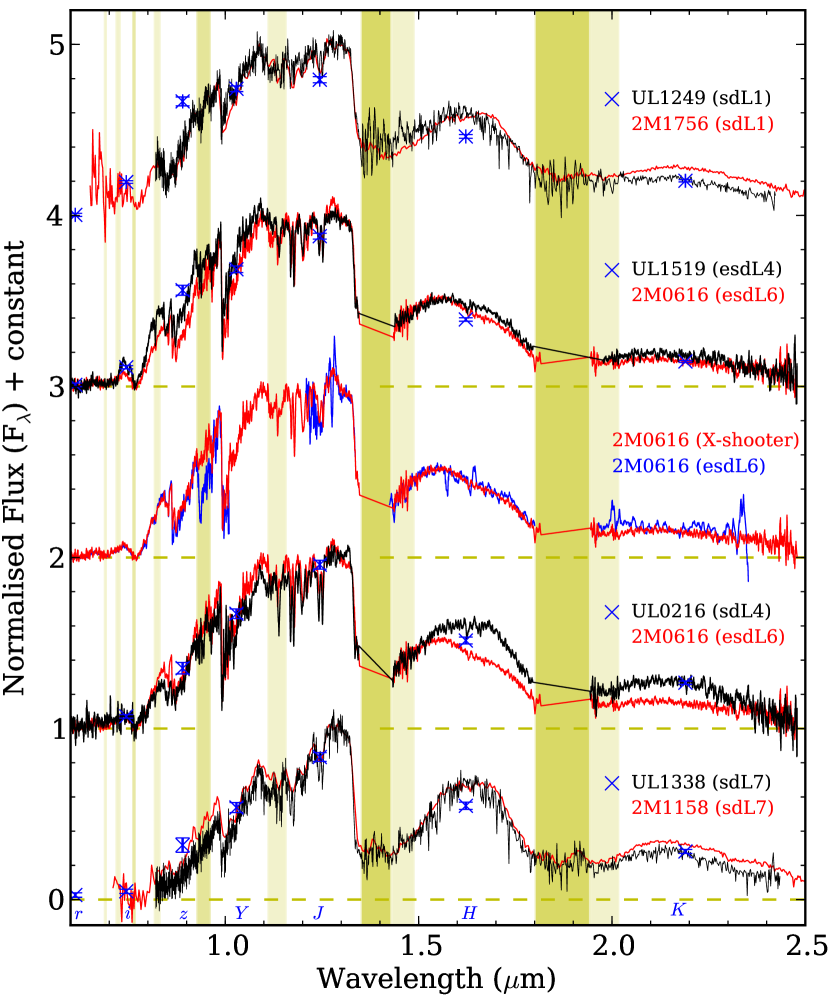
2MASS J061640066407194 (2M0616) was discovered by (Cushing et al., 2009) with optical and NIR spectra observed individually. The 1.0–1.2 m spectrum of 2M0616 is missing. We observed 2M0616 with X-shooter on 2016 January 24. The total integration time is 3600 s in the NIR and 3480 s in the VIS. The observation and data reduction are performed in the same way as UL1519 (see Section 3.1). The spectrum of 2M0616 has SNR of 15 at 0.9 m and 18 at 1.3 m.
4 Classification & characterization
The classification of UCSDs is a challenge for several reasons. First, a wide variety of both optical and NIR spectral features are sensitive not only to changes, but also to a wide range of metallicities. Secondly, the sample of known UCSDs (particularly L type) is small. And thirdly, there are no well-resolved UCSD companions (to the more common subdwarf stars) that can be used to calibrate the metallicity consistency of a classification scheme.
4.1 Classification schemes for ultra-cool subdwarfs
Burgasser, Cruz, & Kirkpatrick (2007a) extended the M subdwarf classification scheme of Gizis (1997) out into the late M- and L-type regimes. Gizis (1997) tested the spectroscopic metallicity scale of their subclasses of M subdwarfs with photometry of globular clusters, but this test was only done for early M spectral types. Kirkpatrick et al. (2016) proposed a spectral sequence of late-type M and L subdwarfs as an extension of the M subdwarf classification scheme of Lépine, Rich, & Shara (2007, hereafter LRS07). LRS07 used a metallicity index to define metallicity subclasses of M subdwarfs. The index is based on CaH2, CaH3 and TiO5 indices, which are calculated from the ratio of the average flux over 6814–6846 Å (CaH2), 6960–6990 Å (CaH3), 7126–7135 Å (TiO5), and 7042–7046Å (Denominator), see table 1 of LRS07). The consistency of as a metallicity index was examined using six resolved binaries (whose components would be expected to share the same metallicity) containing early-type M subdwarfs. The metallicity consistency of subclasses of mid–late types (e.g. sdM3+ and esdM5+) could not be tested due to the lack of binaries with companions in this spectral type/subclass domain.
Fig. 1 shows four objects lying between the esdM5–esdM8 subdwarfs and SSS1013 (which has been classified as esdM9.5 by Burgasser, Cruz, & Kirkpatrick, 2007a), but classified as late-type sdM according to LRS07. This means late-type sdMs classified according to LRS07 could be as metal-poor as mid type esdMs. This is because the metallicity is not consistent across all M subtypes defined by LRS07. The metallicity consistency is tested only for early-type M subdwarfs (<esdM3.5 and <usdM6) in their Fig. 6. The NextGen models (Hauschildt, Allard, & Baron, 1999) supported the metallicity consistency of subclasses for early-type esdM and usdM subdwarfs, but not for the late-types. Fig. 8 of LRS07 shows the isometallicity data points derived from the NextGen model grid and their metallicity subclass boundaries in a space of CaH2+CaH3 versus TiO5. These isometallicity data points with log = –1.0 and –2.0 fit in between the sdM–esdM and esdM–usdM boundaries at CaH2+CaH3 > 1.0 (equivalent to esdM3.5 or usdM3.5). Then these isometallicity data points start to go off the middle of the subclass boundaries, and finally cross these boundaries at around CaH2+CaH3 = 0.5 (equivalent to esdM7.5 or usdM7.5). The solar metallicity model data points do not follow the M dwarf sequence in fig. 8 of LRS07, presumably because M dwarfs have more complicated atmospheres and are more difficult to reproduce with models compared to M subdwarfs.
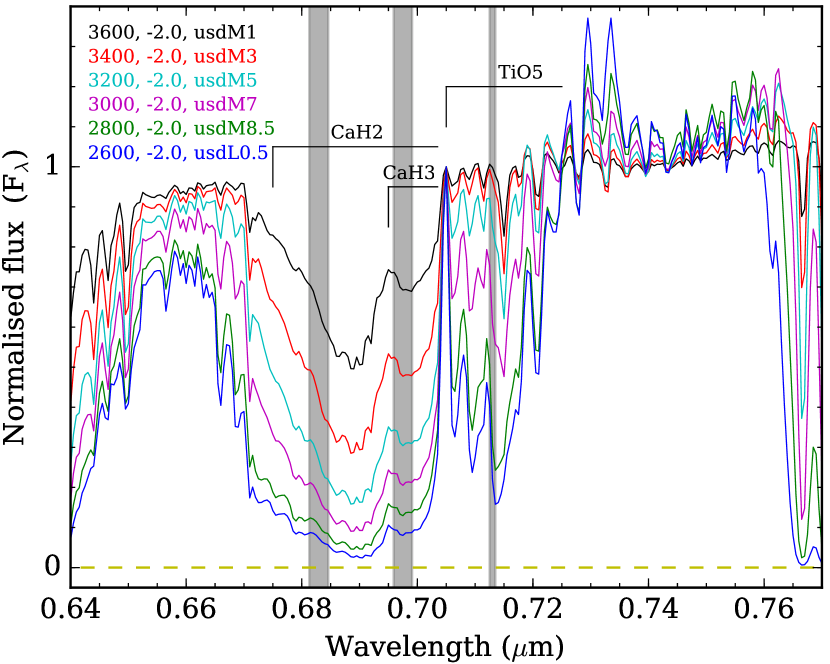
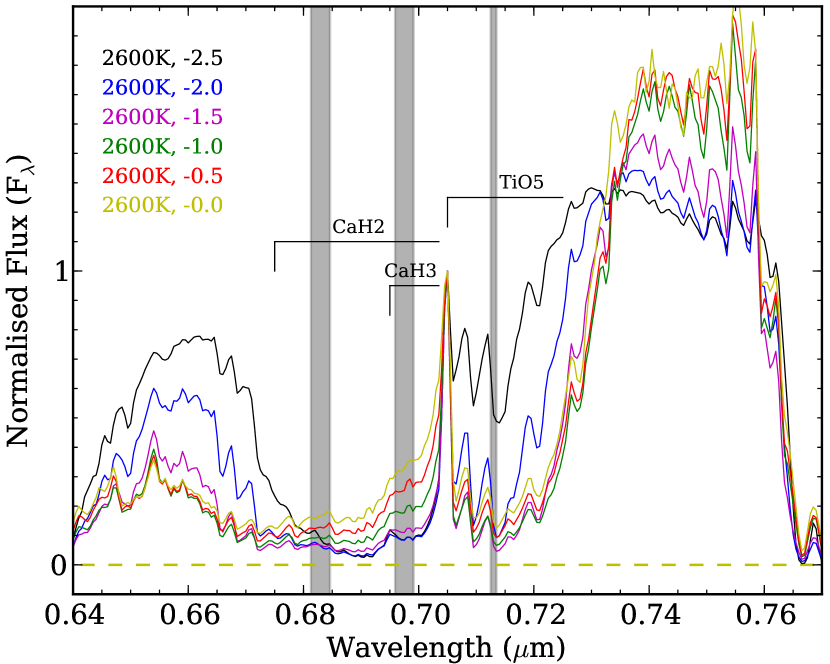
The TiO5 band becomes more sensitive to temperature than metallicity for late-type M subdwarfs. Fig. 5 shows that the CaH absorption bands strengthen with decreasing while the TiO5 band generally remains constant through 3600-3200 K. Then the strengthening of CaH absorption bands slows down and reaches a maximum at 2600 K, being less sensitive to temperature. However, TiO5 absorption band starts to strengthen fast after 3200 K, and becomes very strong at 2600 K. It is thus not a uniform metallicity indicator across all M subtypes. Fig. 6 shows that at 2600 K, the TiO5 absorption band strengthens slowly as [Fe/H] decreases from 0.0 to –1.5, but weakens as [Fe/H] decreases from –1.5 to –2.5. The relationship between the strengths of TiO5 absorption and [Fe/H] is thus not monotonic for late-type M and early-type L subdwarfs. Simple index-based classification (e.g. using TiO and CaH) can Therefore, misrepresent [Fe/H] for later type M subdwarfs. Instead we determine subclasses via an empirical assessment of a broader range of spectral features in the optical and NIR (e.g. 0.8 m VO and 2.3 m CO). However, since the metallicity consistency of early M subclasses has been tested (by LRS07), we aim to anchor our classification scheme within this framework. We use classes d, sd, esd, and usd, and later show (see Section 6.1) that the metallicity ranges of these subclasses are reasonably consistent with those of the early M subdwarfs.
4.2 Spectral classification of L subdwarfs
Spectral types of L subdwarfs are determined by comparing their red optical spectra to those of L dwarf spectral standards (Burgasser, Cruz, & Kirkpatrick, 2007a; Kirkpatrick et al., 1999, 2010). The optical spectra of L subdwarfs and dwarfs are different but comparable. We are mainly considering the 0.73–0.88 m region to make a comparison, because this region changes constantly with type (e.g., Kirkpatrick et al., 1999) and similar features are present in the spectra of both L dwarfs and L subdwarfs. A subclass ‘sdL’ is used to classify L subdwarfs following the ‘sdM’ subclass of M subdwarfs (Gizis, 1997). A subclass ‘esdL’ was proposed for L subdwarfs with very strong metal-poor features (e.g. 2M0532; Kirkpatrick et al., 2010). Some marginal cases are classed as d/sdL (mildly metal-poor) if their spectra have weaker metal-poor features. Burgasser, Cruz, & Kirkpatrick (2007a) defined a d/sdM subclass for late-type M subdwarfs. A d/sdL7 spectral type was used for SDSS J141624.08+134826.7 (SD1416; Burningham et al., 2010), which was classified as sdL7 by Kirkpatrick et al. (2010). For the naming of L subclasses, we followed the basis of LRS07 and Kirkpatrick et al. (2010), in which d/sdL and sdL of Burgasser, Cruz, & Kirkpatrick (2007a) are generally equivalent to sdL and esdL, respectively. We also defined a usdL subclass following the suppression strength of NIR spectra caused by enhanced CIA H2. Here we re-examine the spectral type and metallicity subclasses of some previously defined L subdwarfs, and then use them as spectral standards to classify our new sample.
The K I doublet around 0.77 m is one of the most notable features in the spectra of L dwarfs. This feature is sensitive to and mildly to gravity, keeps broadening from early to late L type, and is one of the main criteria for classifying L dwarfs (e.g. Kirkpatrick et al., 1999). The first known L subdwarf, 2M0532 was classified as sdL71 because its optical spectrum compares well to those of L7 dwarfs (Burgasser et al., 2003). However, Kirkpatrick et al. (2010) propose to classify 2M0532 as an esdL7 to indicate its extreme nature and unusual spectral morphology, and also suggest that 2M0532 may be somewhat later than L7. Fig. 7 shows that 2M0532 compares well with either L7 or L7.5 spectra in the optical. 2M0532 also compares well with the L8 dwarf 2MASS J16322911+1904407 (Kirkpatrick et al., 1999), but compares slightly less well with another L8 dwarf, 2MASS J03105986+1648155 (Kirkpatrick et al., 2000). Although 2M0532 compares well with either L7 or L7.5 dwarfs, we suggest to classify it as esdL7 in the absence of an object with spectral features intermediate between 2M0532 and 2M0616. 2M0616 was found and classified as sdL5 by Cushing et al. (2009). However, Fig. 7 shows that 2M0616 compares rather more favourably with the L6 spectral standard (compared to the L5) in the K I region. We thus adopt a classification of esdL6 for 2M0616 here.
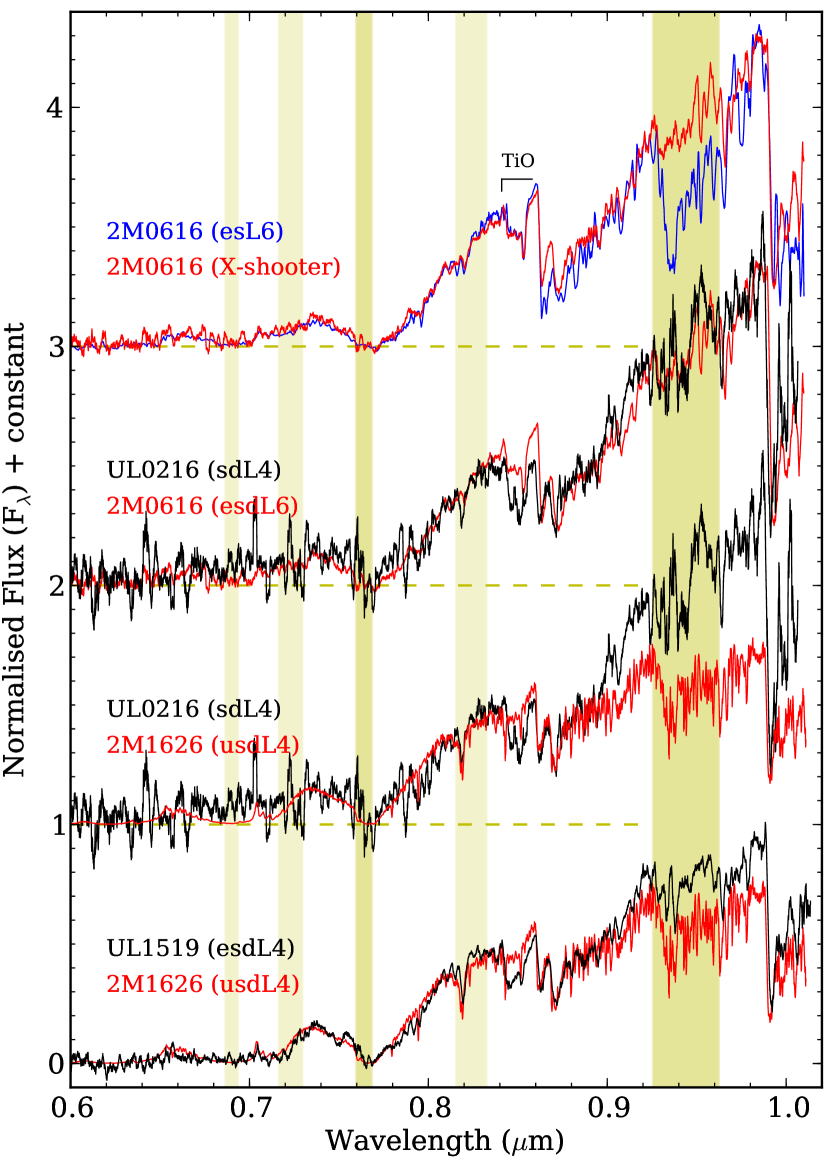
Fig. 8 shows optical spectra of UL1519 and UL0216 compared to those of 2MASS J16262034+3925190 (2M1626; Burgasser, 2004a) and 2M0616. The new spectrum of 2M0616 (observed with X-shooter) compares well with the optical spectrum from Cushing et al. (2009), except for the telluric absorption region around 0.94 m. UL1519 compares well with 2M1626 at 0.6-0.92 m. Stronger TiO absorption at 0.85 m (TiO absorption decreases from [Fe/H] = –1.5 to –2.5; Fig. 6) and extra flux beyond 0.92 m compared to 2M1626 indicate a higher metallicity. UL0216 compares better with 2M1626 than 2M0616 at 0.6-0.89 m. UL0216 has a higher metallicity than 2M1626 and 2M0616 because it has stronger TiO absorption at 0.85 m and a redder spectrum than 2M1626 beyond 0.9 m. Red optical and NIR spectra redden with increasing metallicity, and become bluer with increasing temperature. Therefore, UL0216 could have a similar spectral profile to 2M0616 at 0.9-1.0 m, while their NIR spectra are different due to CIA H2.
The CIA H2 and 2.3 m CO absorption bands are strong indicators of metallicity for L dwarfs and subdwarfs. NIR spectral emission becomes more suppressed at lower metallicity due to enhanced CIA H2. The CO band is present in the spectra of late-type M, L, and early-type T dwarfs (e.g. Kirkpatrick et al., 2010). The CO band weakens as metallicity decreases, and eventually disappears.
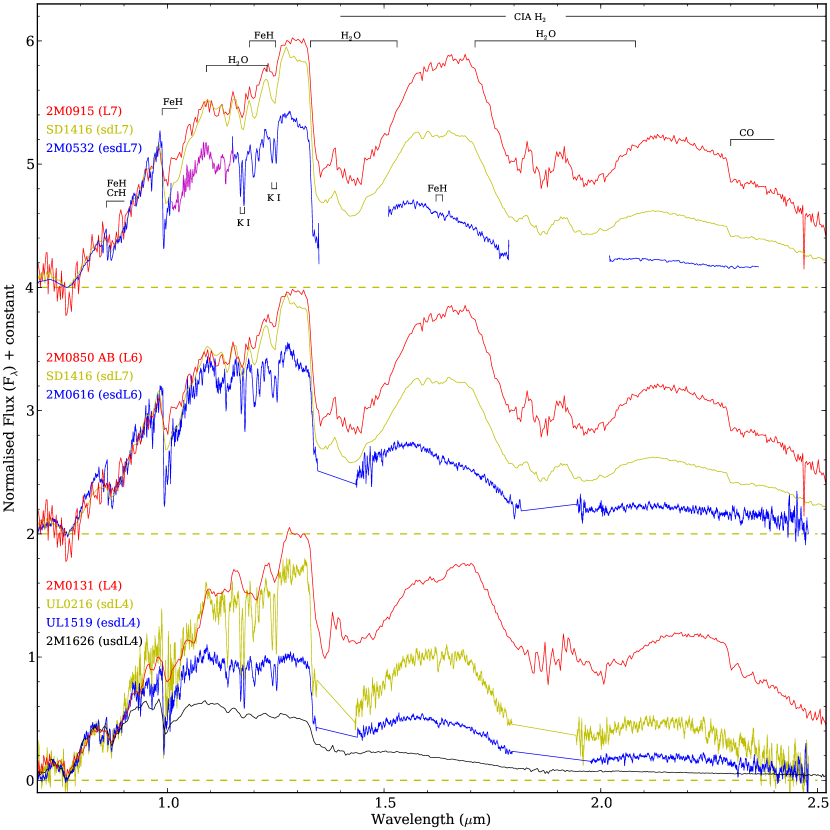
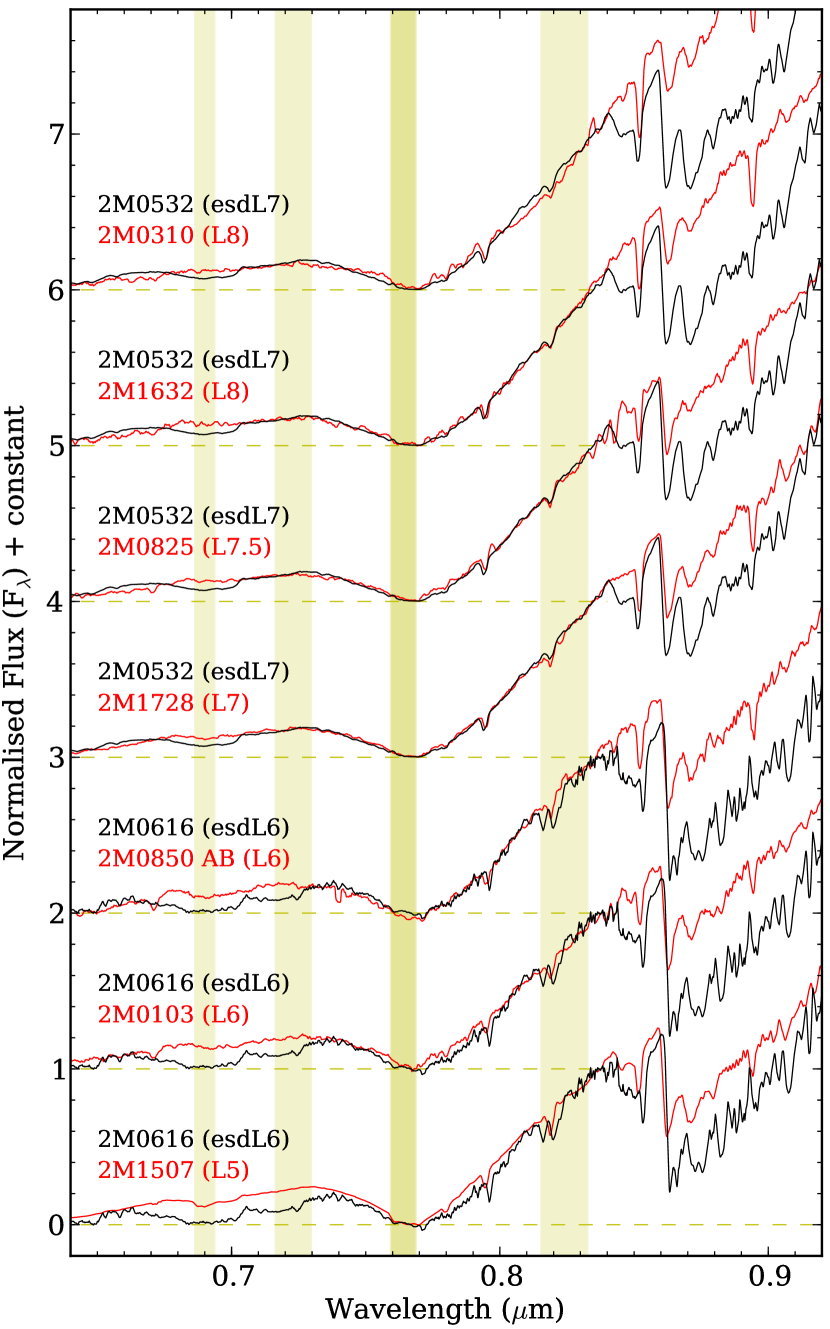
Fig. 9 shows the optical and NIR spectra of L4, L6, and L7 dwarfs and subdwarfs normalised in the optical. The top panel of Fig. 9 shows the spectra of 2MASS J09153413+0422045 (2M0915; Burgasser, 2007b), SD1416 (Schmidt et al., 2010), and 2M0532. Although these objects have very similar optical spectra, they show large diversity in the NIR due to very different metallicity, and can be naturally classified in three different subclasses: L7, sdL7, and esdL7. The 2.3 m CO band gets weaker from L7 to sdL7, and disappears for esdL7. The middle panel of Fig. 9 shows the spectra of 2M0850 AB, 2M0616 and SD1416, which are very similar in the optical but very different in the NIR. There is no sdL6 currently known, so we show the spectra of SD1416 instead. The bottom panel of Fig. 9 shows the spectra of 2MASS J01311838+3801554 (2M0131; Burgasser et al., 2010), UL0216, UL1519, and 2M1626.
We classified UL0216 as sdL4 because it compares well with 2M1626 at 0.6–0.89 m (Fig. 8), and has a suppressed NIR spectrum due to enhanced CIA H2. UL1519 compares well with 2M1626 at 0.6–0.89 m (Fig. 8), and has stronger NIR suppression than UL0216, which is very similar to 2M0616 (Fig. 2). Therefore, we classify UL1519 as an esdL4 subdwarf. 2M1626 was previously classified as sdL4 based on the similarity of its optical spectrum to those of L4 dwarfs (Burgasser, 2007b). However, it has weaker TiO absorption at 0.85 m (Fig. 8) and stronger NIR suppression compared to UL1519 suggesting it should be in a lower metallicity subclass. Therefore, we classify 2M1626 as an usdL4 subdwarf. 2MASS J17561080+2815238 (2M1756) and 2MASS J11582077+0435014 (2M1158) are classified as sdL1 and sdL7 based on their similar optical spectra to sdL1 and sdL7 subdwarfs (Kirkpatrick et al., 2010). Fig. 2 shows that the NIR spectra of UL1249 and UL1338 compare well with 2M1756 and 2M1158; thus, we classify them as sdL1 and sdL7, respectively.
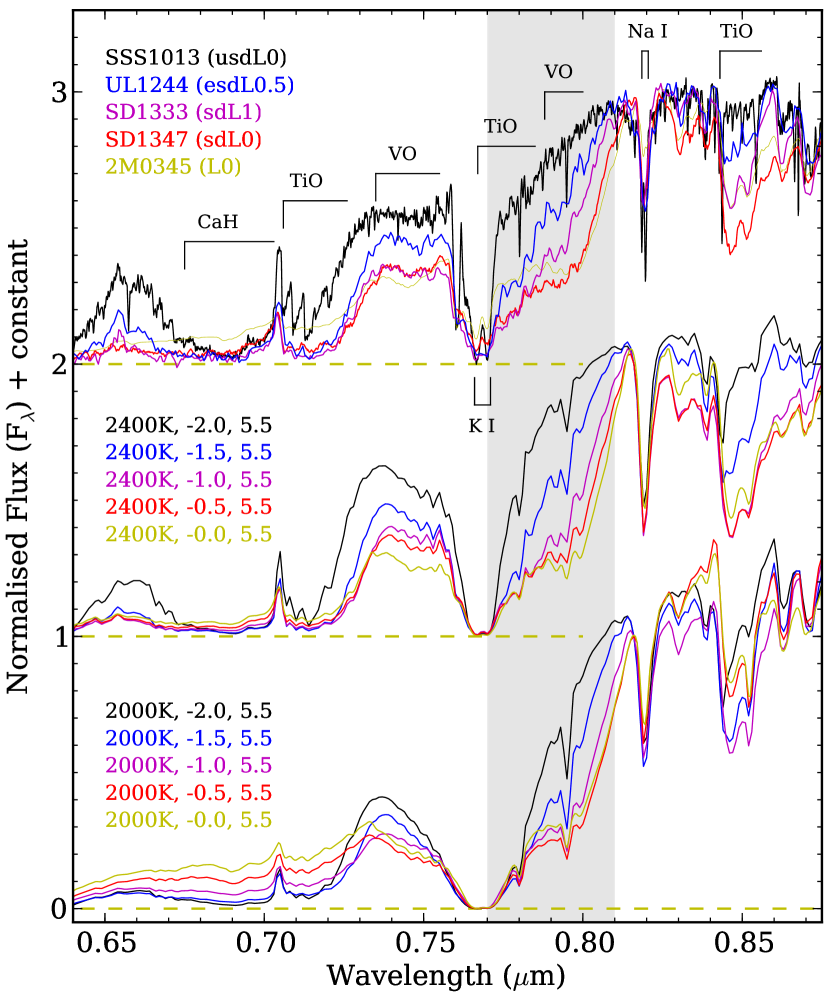
The 0.8 m VO band is present in the spectra of late-type M and early-type L dwarfs (e.g., Bochanski et al., 2007; Zhang et al., 2009). The 0.8 m VO absorption band co-exists with the 2.3 m CO absorption band in early-type sdL subdwarfs (e.g. 2M1756; Kirkpatrick et al., 2010), and is a strong indicator of metallicity. The VO band weakens as metallicity decreases, and eventually disappears. The top panel of Fig. 10 shows optical spectra of early-type L subdwarfs with very different VO band strengths due to different metallicity. This effect is reproduced in the BT-Settl model (Allard, Homeier, & Freytag, 2014) spectra. Middle and bottom panels of Fig. 10 show BT-Settl optical spectra with of 2000 and 2400 K (corresponding to early and mid L types according to Section 5.2). Section 5.1 shows that the best-fitting model parameters for SD1347 are K and and for SSS1013 are K and . The 0.77–0.81 m region changes continuously with decreasing metallicity. We classify objects that have a weaker VO band (compared to L dwarfs) as sdL subdwarfs (e.g. 2M1756), and classify objects without a 0.8 m VO absorption band as esdL. The 0.77–0.81 m spectral profile of an early-type esdL should be well approximated by a straight slope. early-type L subdwarfs with significantly more flux in the 0.77–0.81 m region should be classified as usdL to indicate an even more extreme effect, which is also contributed by a weakening of TiO absorption at 0.77 m (as [Fe/H] changes from –1.5 to –2.5; see Fig. 6).
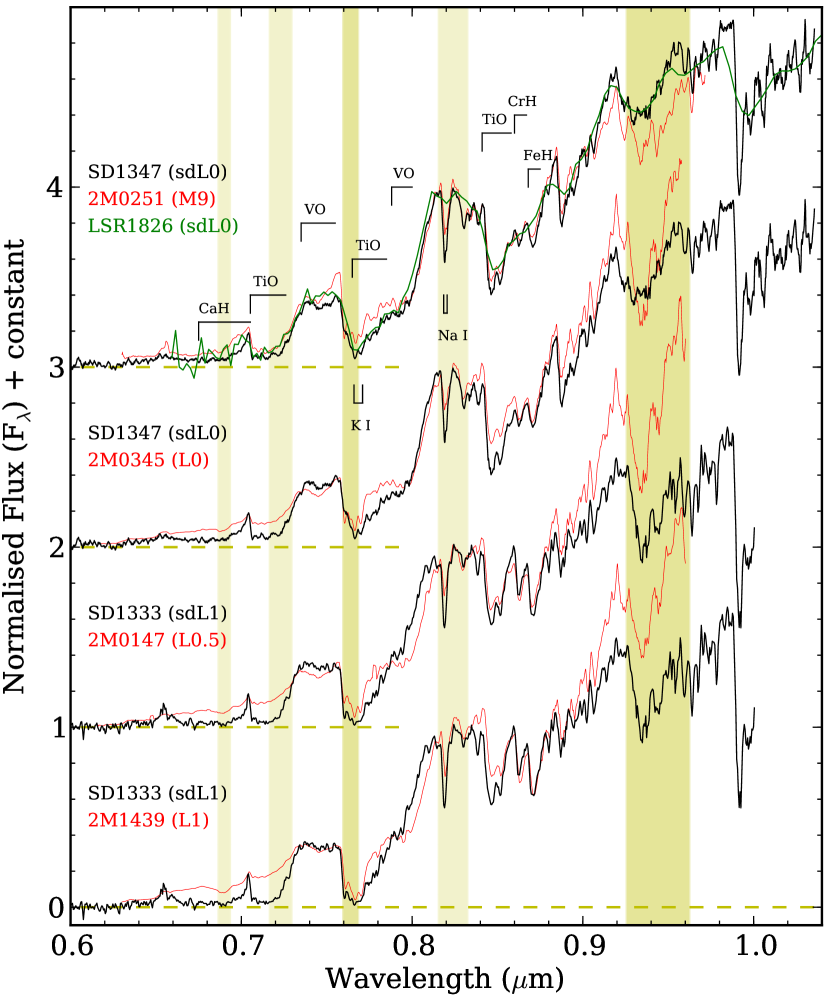
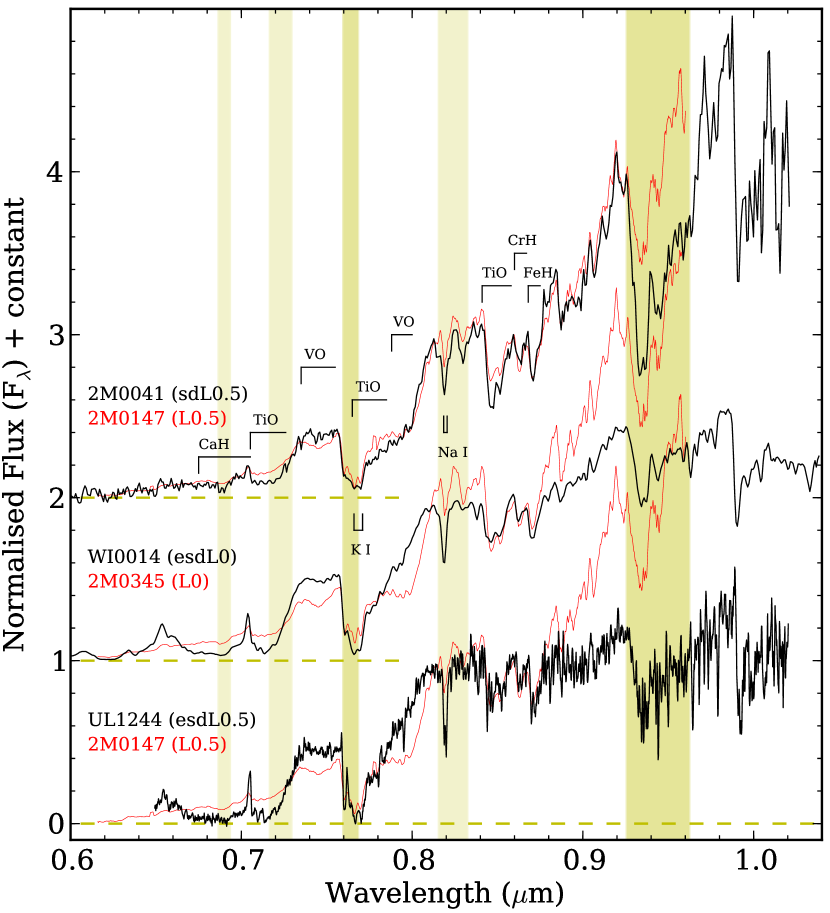
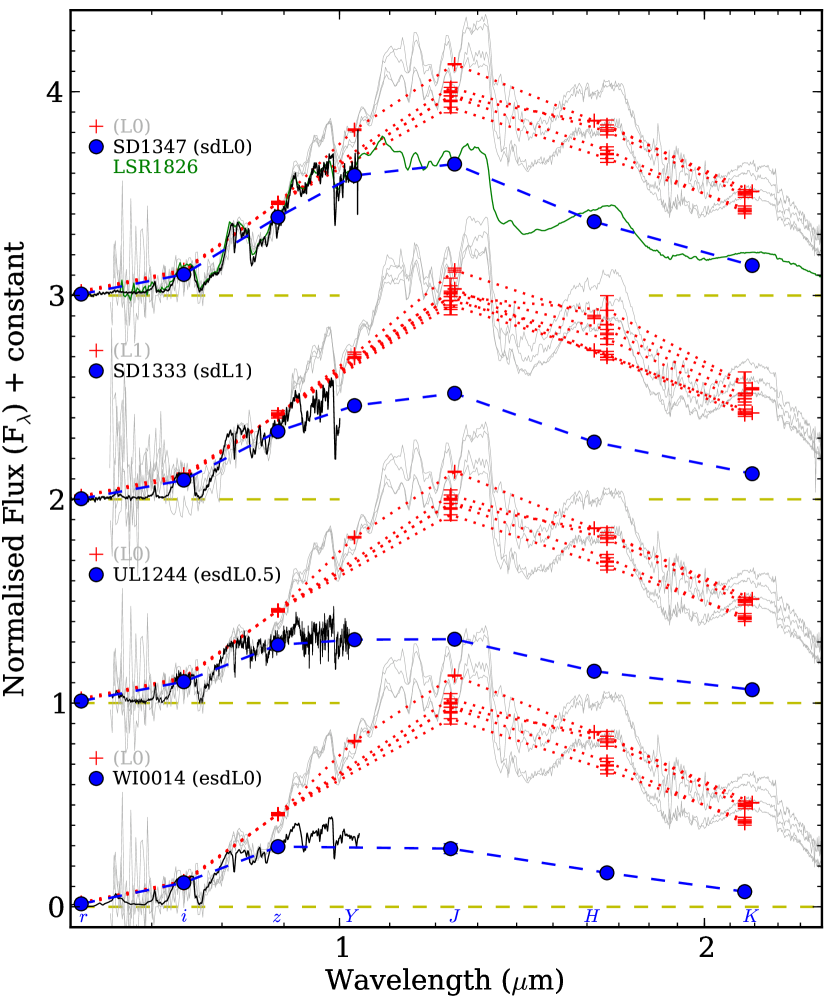
We classify early-type L subdwarfs by comparing their optical spectra to L dwarfs. Fig. 3 shows the optical spectra of SD1333 and SD1347 compared to dwarf standards. The optical spectrum of SD1347 is very similar to L0, but there are slightly stronger CaH and TiO absorption bands, and the NIR photometric flux points are suppressed (see Fig. 11). We thus classified SD1347 as sdL0. SD1333 was previously classified as sdL3 based on its low SNR SDSS spectrum in Zhang et al. (2012). Our new OSIRIS spectrum of SD1333 has a much better SNR (150) and is very similar to the spectra of L0.5–L1 types. However, it has also somewhat stronger CaH and TiO absorption bands, very weak 0.8 m VO absorption, and largely suppressed NIR photometric flux points (Fig. 11). We thus re-classify SD1333 as sdL1. Kirkpatrick et al. (2016) also obtained a new optical spectrum of SD1333 and classified it as sdL0. Within the sdL subclass, SD1347 is relatively metal-rich and SD1333 is relative metal-poor, according to the strength of their 0.8 m VO bands. Following the same strategy as for SD1347 and SD1333, we classify 2M0041, WI0014, and UL1244 as sdL0.5, esdL0, and esdL0.5, respectively (see Fig. 4 and 11).
Table 3 presents a note summary of the spectral characteriztics of the L subdwarf metallicity subclasses that we have used to make our classifications.
| Subclass | Spectral Characteriztics | Examples |
|---|---|---|
| sdL | and bands are more suppressed than in L dwarfs (normalizing in optical) | SD1416, UL0216 (Fig. 9) |
| CaH and TiO at around 0.7 m are slightly deeper than in L dwarfs | 2M1756 (Kirkpatrick et al., 2010) | |
| VO band at 0.8 m in early-type sdL is weaker than in L dwarfs | 2M1756 (Kirkpatrick et al., 2010) | |
| 0.77–0.81 m spectral profile of early-type esdL dips below a straight line | SD1333 (Fig. 3) | |
| FeH at 0.99 m in mid-late-type sdL is stronger than in L dwarfs | SD1416 (Fig. 9) | |
| CO band at 2.3 m is weaker than in dL | 2M1756, SD1416 (Fig. 9) | |
| TiO at 0.85 m stronger than for same spectral type L dwarfs | SD1347 (Fig. 3) | |
| esdL | , and bands are strongly suppressed compared to L dwarfs (normalizing in optical). | 2M0616, UL1519 (Fig. 9) |
| CaH and TiO at around 0.7 m are deeper than in L dwarfs | UL1244 (Fig. 4) | |
| VO band at 0.8 m in early-type esdL disappears | WI0014, UL1244 (Fig. 4) | |
| 0.77–0.81 m spectral profile of early-type esdL well approximated by a straight slope | UL1244 (Fig. 4) | |
| FeH at 0.99 m in mid-late-type esdL is much stronger than in L dwarfs | 2M0616, 2M0532 (Fig. 9) | |
| CO band at 2.3 m disappears, band is almost flat | 2M0616, 2M0532 (Fig. 9) | |
| TiO at 0.85 m weaker than same spectral type sdL | UL1244, 2M0616 (Fig. 8) | |
| usdL | , and bands are significantly suppressed compared to L dwarfs (normalizing in optical). | 2M1626 (Fig. 9) |
| CaH and TiO at around 0.7 m are deeper than in dL | SSS1013 (Fig. 10) | |
| VO band at 0.8 m in early-type usdL disappears | SSS1013 (Fig. 10) | |
| 0.77–0.81 m spectral profile of early-type usdL appears well above a straight line | SSS1013 (Fig. 10) | |
| FeH at 0.99 m in mid–late-type usdL is much stronger than in L dwarfs | 2M1626 (Fig. 9) | |
| CO band at 2.3 m disappears, band is somewhat flat | 2M1626 (Fig. 9) | |
| TiO at 0.85 m weaker than same spectral type esdL | 2M1626 (Fig. 8) |
| Name | SpT1a | Refb | SpT2c |
| SSSPM J101307341356204 | sdM9.5 | 19,6 | usdL0 |
| SDSS J125637.13022452.4 | sdL3.5 | 21,7 | usdL3 |
| ULAS J135058.86+081506.8 | sdL5 | 16 | usdL3 |
| 2MASS J16262034+3925190 | sdL4 | 3 | usdL4 |
| WISEA J213409.15+713236.1 | sdM9 | 13 | usdL0.5 |
| WISEA J001450.17083823.4 | sdL0 | 12,15 | esdL0 |
| WISEA J020201.25313645.2 | sdL0 | 12 | esdL0.5 |
| WISEA J030601.66033059.0 | sdL0 | 12,15 | esdL1 |
| ULAS J033350.84+001406.1 | sdL0 | 17 | esdL0 |
| WISEA J043535.82+211508.9 | sdL0 | 12,15 | esdL1 |
| 2MASS J05325346+8246465 | sdL7 | 2 | esdL7 |
| 2MASS J061640066407194 | sdL5 | 9 | esdL6 |
| ULAS J124425.90+102441.9 | sdL0.5 | 17 | esdL0.5 |
| SSSPM J144420.67201922.2 | sdL0 | 18,13 | esdL1 |
| ULAS J151913.03000030.0 | esdL4 | 1 | esdL4 |
| 2MASS J16403197+1231068 | sdM9/sdL | 4,10 | esdL0 |
| WISEA J204027.30+695924.1 | sdL0 | 12,15 | esdL0.5 |
| 2MASS J00412179+3547133 | sdL? | 4 | sdL0.5 |
| WISEA J005757.65+201304.0 | sdL7 | 12,15 | — |
| WISEA J011639.05165420.5 | d/sdM8.5 | 20 | sdL0 |
| WISEA J013012.66104732.4 | d/sdM8.5 | 20 | sdL0 |
| ULAS J021642.97+004005.6 | sdL4 | 1 | sdL4 |
| 2MASS J064531536646120 | sdL8 | 11 | — |
| WISEA J101329.72724619.2 | sdL2? | 13 | — |
| 2MASS J11582077+0435014 | sdL7 | 11 | — |
| ULAS J124947.04+095019.8 | sdL1 | 1 | sdL1 |
| SDSS J133348.24+273508.8 | sdL1 | 1 | sdL1 |
| ULAS J133836.97022910.7 | sdL7 | 1 | sdL7 |
| SDSS J134749.74+333601.7 | sdL0 | 1 | sdL0 |
| WISEA J135501.90825838.9 | sdL5? | 13 | — |
| SDSS J141624.08+134826.7 | d/sdL7 | 8,11 | sdL7 |
| 2MASS J17561080+2815238 | sdL1 | 11 | — |
| LSR J182611.3+301419.1 | d/sdM8.5 | 14,4 | sdL0 |
-
a
Spectral types from the literature.
-
b
1. This paper; 2. Burgasser et al. (2003); 3. Burgasser (2004a); 4. Burgasser et al. (2004b); 5. Burgasser & Kirkpatrick (2006); 6. Burgasser, Cruz, & Kirkpatrick (2007a); 7. Burgasser et al. (2009); 8. Burningham et al. (2010); 9. Cushing et al. (2009); 10. Gizis & Harvin (2006); 11. Kirkpatrick et al. (2010); 12. Kirkpatrick et al. (2014); 13. Kirkpatrick et al. (2016); 14. Lépine et al. (2002); 15. Luhman & Sheppard (2014); 16. Lodieu et al. (2010); 17. Lodieu et al. (2012); 18. Scholz, Lodieu, & McCaughrean (2004); 19. Scholz et al. (2004); 20. Schneider et al. (2016); 21. Sivarani et al. (2009).
-
c
Spectral types adopted in this paper. Objects not examined in this paper have no value here.
4.3 Spectral type of other known L subdwarfs
We have re-examined spectral types and subclasses of some known L subdwarfs: 2M0532 (esdL7), 2M0616 (esdL6), 2M1626 (usdL4), 2M0041 (sdL0.5), WI0014 (esdL0), and UL1244 (esdL0.5) in Section 4.2. We also classified six new L subdwarfs: UL0216 (sdL4), UL1249 (sdL1), SD1333 (sdL1), UL1338 (sdL7), SD1347 (sdL0), and UL1519 (esdL4). Here we discuss the spectral types and spectral subclasses of other known blue L dwarfs and L subdwarfs based on the properties summarised in Table 3.
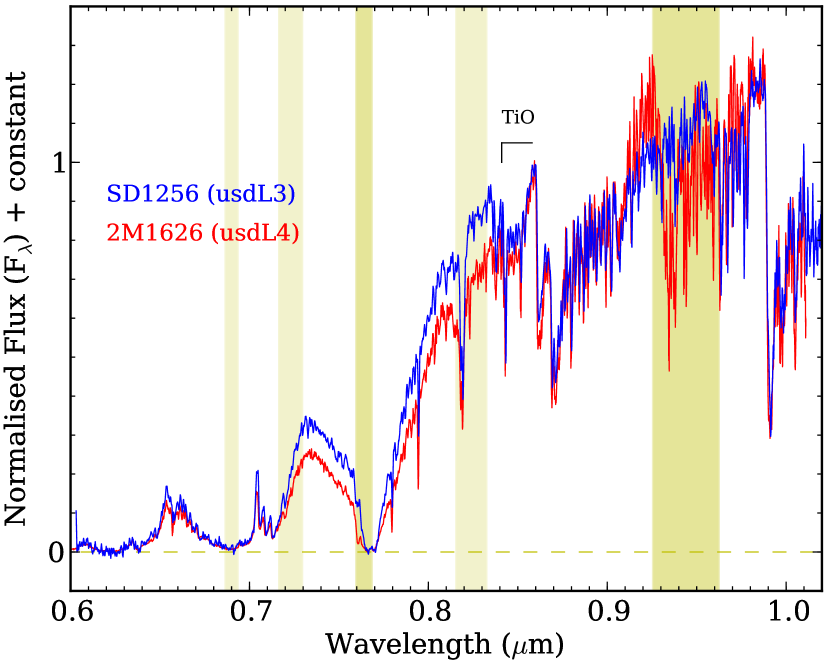
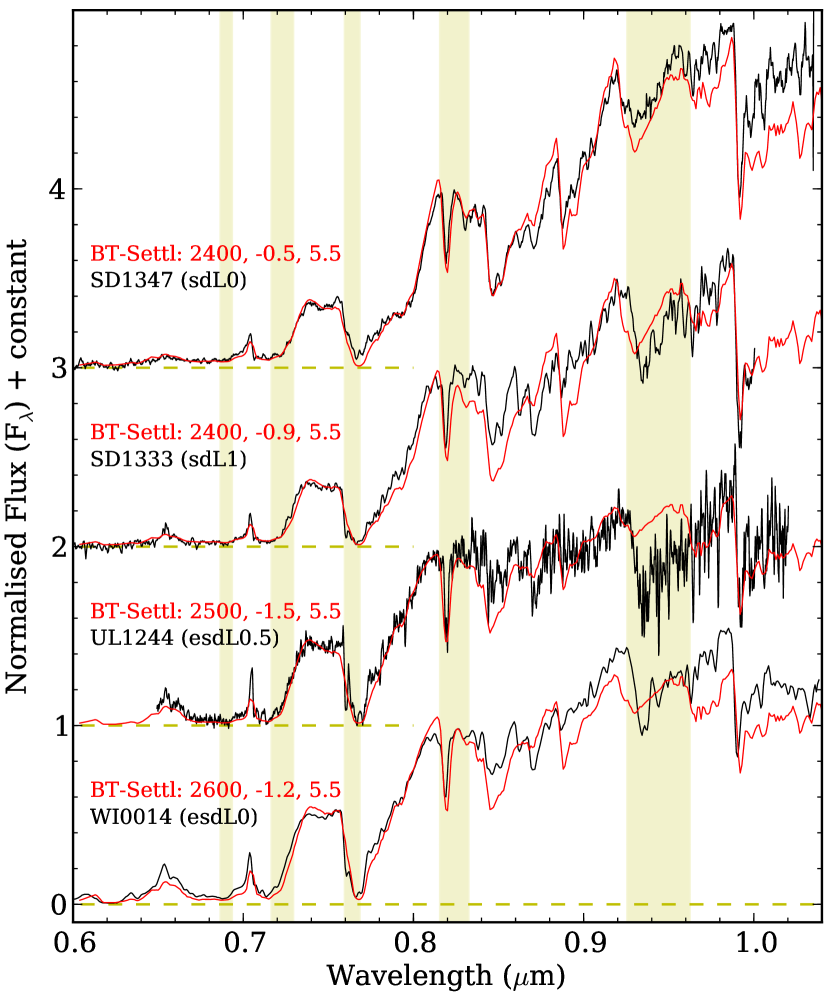
Fig. 10 shows that it is more and more difficult to assign spectral type to early-type L subdwarfs when by direct comparison to optical spectra of L dwarfs. This is because TiO bands become very sensitive to metallicity and shape the spectra of early-type usdL subdwarfs in a way that is significantly different from L dwarfs. SDSS J125637.16022452.2 (SD1256; Sivarani et al., 2009) was classified as sdL3.5 by Burgasser et al. (2009). Its NIR spectrum has very similar properties as in 2M1626, i.e. flat in the band and 0.85 m TiO absorption; thus, we classify it as an usdL subdwarf. Fig. 12 shows that SD1256 has an optical spectrum that is significantly different from 2M1626, justifying that an SD1256 spectral type is one subtype earlier than 2M1626. We Therefore, classify SD1256 as usdL3.
ULAS J135058.86+081506.8 (UL1350) was classified as sdL5 by comparing its optical spectrum to those of 2M1626 and 2M0616 (see Figure 2. of Lodieu et al., 2010). If one only examines the spectrum at 0.7–0.9 m in Figure 2. of Lodieu et al. (2010), UL1350 is much more similar to SD1256 or 2M1626 than to 2M0616. The spectrum of UL1350 beyond 0.9 m may not be reliable due to low SNR and/or poor second-order flux calibration. UL1350 is not plotted in Fig. 1 because it will overlap with SD1256 as they have identical and colours. We Therefore, classify UL1350 as usdL3.
The 0.8 m VO absorption is absent in spectra of early-type esdL subdwarfs like SD1244 and WI0014. Other known objects have this feature including: SSSPM J144420.67201922.2 (SSS1444; fig. 2. of Scholz, Lodieu, & McCaughrean, 2004), 2MASS J16403197+1231068 (2M1640; fig. 9. of Burgasser, Cruz, & Kirkpatrick, 2007a), ULAS J033350.84+001406.1 (UL0333; fig. 4. of Lodieu et al., 2012), and WISEA J020201.25313645.2 (WI0101), WISEA J030601.66033059.0 (WI0306), WISEA J043535.82+211508.9 (WI0435), and WISEA J204027.30+695924.1 (WI2040) in fig. 25 of Kirkpatrick et al. (2014). Thus we proposed to classify these objects as esdL.
By comparing the optical spectra of known late-type M and early-type L subdwarfs, Kirkpatrick et al. (2014) discovered that there is a plateau at 0.738–0.757 m that can be used to assign spectral types of L subdwarfs. The slope at the top of this plateau slowly changes from slightly redward to flat through the sdM9–sdL0.5 sequence, then becomes blueward for sdL1. This phenomenon is reproduced by the BT-Settl models (Allard, Homeier, & Freytag, 2014). Fig. 13 shows that this spectral slope (light yellow shaded region) changes continuously across the = 2600–1600 K region.
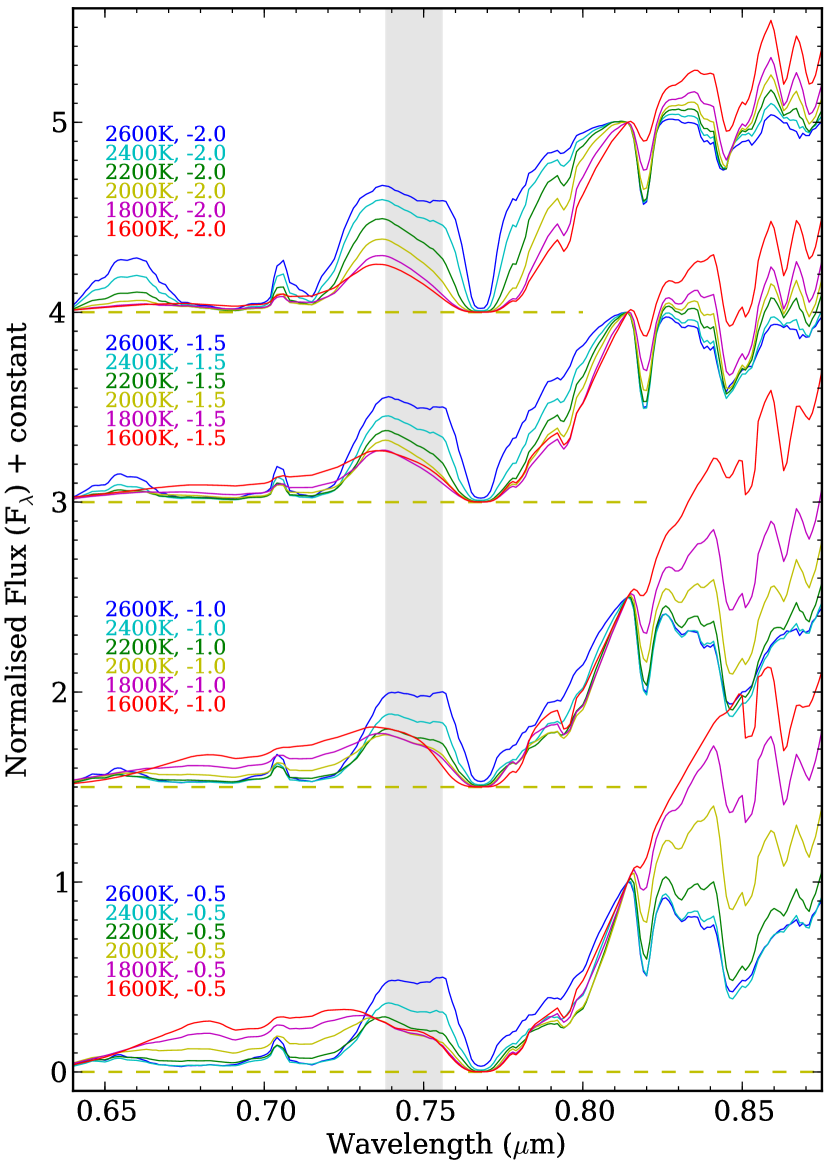
WI0014, WI0202, WI2040, WI0306, and WI0435 discovered by Kirkpatrick et al. (2014) have plateaus with flat or slightly blueward slopes and were classified as sdL0. We classify these objects as esdL subdwarfs as we discussed earlier in this section. If we re-examine the spectra in fig. 25 of Kirkpatrick et al. (2014), we find that WI0202 and WI0240 actually have 0.738–0.757 m plateaus as flat as UL1244, thus suggesting esdL0.5. Although WI0306 and WI0435 have different metallicity subclass to 2M1756, they all have blueward plateaus, and we thus classify WI0306 and WI0435 as esdL1. Fig. 4 shows that WI0014 has an almost flat plateau but has a dip around 0.756 m, and we thus classify it as esdL0.
2M1640 has similar spectrum as UL0333, which suggests it is also an esdL0 (see fig. 9. of Burgasser, Cruz, & Kirkpatrick, 2007a). SSS1444 has similar spectrum to WI0306 and WI0435, which suggests they should have an esdL1 classification (see fig. 2. of Scholz, Lodieu, & McCaughrean, 2004).
SSS1013 (Fig. 10) was classified as esdM9.5 by Burgasser, Cruz, & Kirkpatrick (2007a). The 0.738–0.757 m plateau of this object appears fairly flat but with a dip at 0.76 m. The 0.77-0.81 m profile of SSS1013 is significantly above a straight line slope (due to weakening of 0.77 m TiO), which indicates an usdL subclass. Therefore, we classify SSS1013 as usdL0. WISEA J213409.15+713236.1 (WI2134) was classified as sdM9 (fig. 63. Kirkpatrick et al., 2016). Its 0.738-0.757 m plateau appears somewhat flat, suggesting a later type than sdM9. The 0.77-0.81 m profile of WI2134 is significantly above a straight line slope (similar to SSS1013) indicating an usdL subclass, and we thus classify WI2134 as usdL0.5.
LSR1826 was classified as d/sdM8.5 from its NIR spectrum by Burgasser et al. (2004b). Fig. 3 shows that LSR1826 has the same optical spectrum as SD1347, and we thus classify it as sdL0. WISEA J011639.05165420.5 and WISEA J013012.66104732.4 in fig. 12. of Schneider et al. (2016) compare well with LSR1826, and we thus classify them as sdL0.
Table 4 shows a list of currently known L subdwarfs with updated spectral types. 16 are sdL, 12 are esdL and 5 are usdL.
4.4 Enhancement and suppression for the different L dwarf subclasses
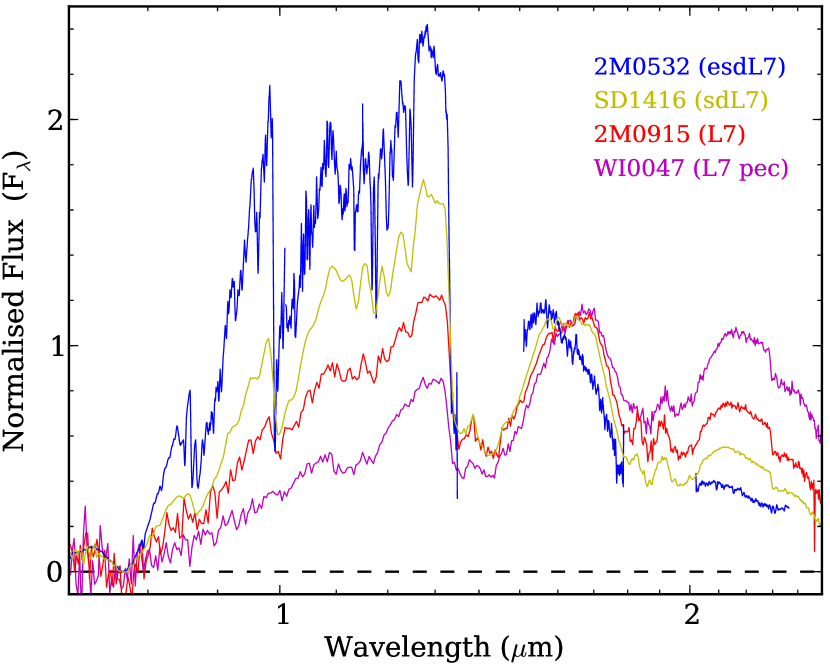
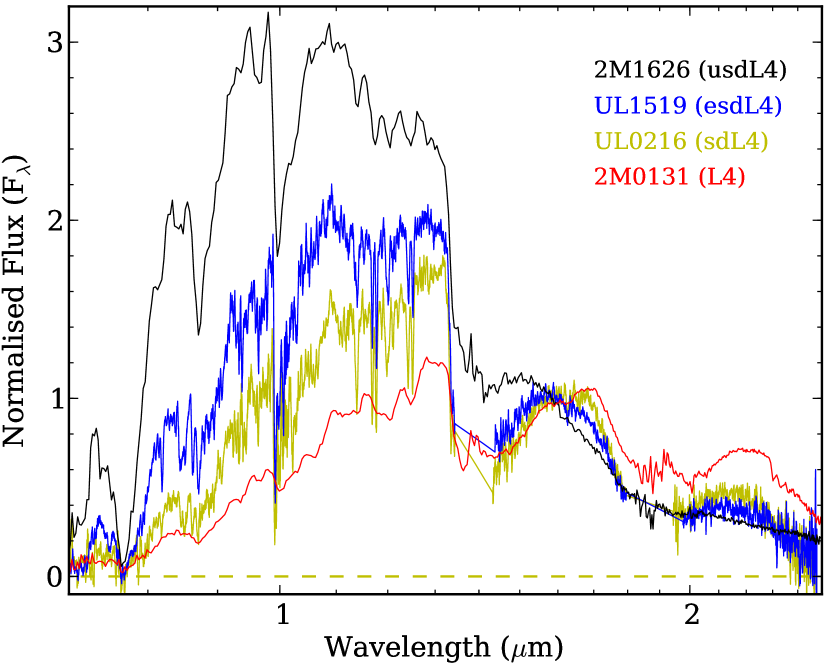
To consider relative enhancement/suppression for the different L dwarf subclasses, we plot Fig. 14 and Fig. 15. Fig. 14 shows spectra for a confined range of L7 spectral type spanning a range of spectral peculiarity and subclass. Objects in this spectral type range should all be BDs. To give an indication of relative flux levels the spectra are normalised at 1.6 m in Fig. 14. Since L dwarfs/subdwarfs have similar magnitudes (see Figure 3 of Zhang et al. 2013), this plot indicates relative brightness levels in an absolute sense. The full sequence runs through; L7 pec, L7, sdL7, and esdL7. At the two extremes WI0047 is a young ( 0.1 Gyr) and low-mass BD ( 19 MJup; Gizis et al., 2015), while 2M0532 is an old ( 10 Gyr) and massive BD ( 80 MJup; Burgasser et al., 2008b). The redistribution of flux from longer to shorter wavelength leads to higher absolute flux level for subdwarfs at 0.8–1.4 m. It is also clear that in addition to differences in metallicity, a large spread in mass (and log ) and age is also evident for any particular spectral type. Similar to Fig. 14, Fig. 15 shows spectra of L4, sdL4, esdL4, and usdL4 normalised at 1.6 m. It is obvious that an usdL4 subdwarf would have a much warmer than an L4 dwarf according to their SED.
| rms (mag) | |||||
|---|---|---|---|---|---|
| (MKO) | 8.64788 | 0.40 | |||
| (MKO) | 8.19731 | 0.40 | |||
| (2MASS) | 8.68342 | 0.40 | |||
| (2MASS) | 8.18494 | 0.41 |
| Name | Distancea | RV | ||
|---|---|---|---|---|
| (mas yr-1) | (mas yr-1) | (pc) | (km s-1) | |
| UL0216 | 618 | 988 | 103 | 9014 |
| UL1249 | 24311 | 2126 | 119 | 17632 |
| SD1333 | 1036 | 6046 | 112 | 4830 |
| UL1338 | 484 | 2618 | 60 | 13638 |
| SD1347 | 7012 | 169 | 88 | 837 |
| UL1519 | 2210 | 42110 | 108 | 8014 |
-
a
Spectroscopic distances based on the relationship between spectral type and band absolute magnitudes (Fig. 16).
4.5 Kinematics of L subdwarfs
Dwarf stars orbit the Galactic Centre in a similar direction as part of the Galactic thin disc, while cool subdwarfs may be part of the (more dispersed) thick disc or could be on more extended orbits within the Galactic halo. Thus cool subdwarfs will generally have more dispersed and space velocities compared to dwarfs ( is positive in the direction of the Galactic anti centre, is positive in the direction of galactic rotation, and is positive in the direction of the North Galactic Pole; Johnson & Soderblom, 1987). The space velocity components are thus indicators for membership of the different Galactic populations.
We calculated space velocities for L subdwarfs based on their distances, radial velocities (RV) and proper motions following Clarke et al. (2010). Proper motions were calculated based on SDSS and UKIDSS astrometry. To measure the spectroscopic distances of our objects we updated the spectral type versus absolute magnitude relationships in Zhang et al. (2013). Fig. 16 shows the spectral type and absolute magnitude relationships for and in MKO photometry. Table 5 shows the coefficients of polynomial fits to these relationships in both MKO and 2MASS photometric systems. These relationships are fitted with M and L subdwarfs of esd and usd subclasses. From Fig. 16 we can see that the spectral type and relationships of dwarfs and subdwarfs are very similar between M7 and L7. This means M7–L7 subdwarfs of different metallicity subclasses have similar if they have same subtypes. Therefore, we estimated distances of our objects with the spectral type and relationship which minimised the uncertainty due to subclass classification. The radial velocities of UL0216, UL1519, UL1249 and UL1338 were measured using their K I lines in the band, while radial velocities of SD1333 and SD1347 were calculated from redshifts in the SDSS data base (based on cross-correlated SDSS spectroscopy). Table 6 presents the distance constraints and astrometric measurements for our six new L subdwarfs.
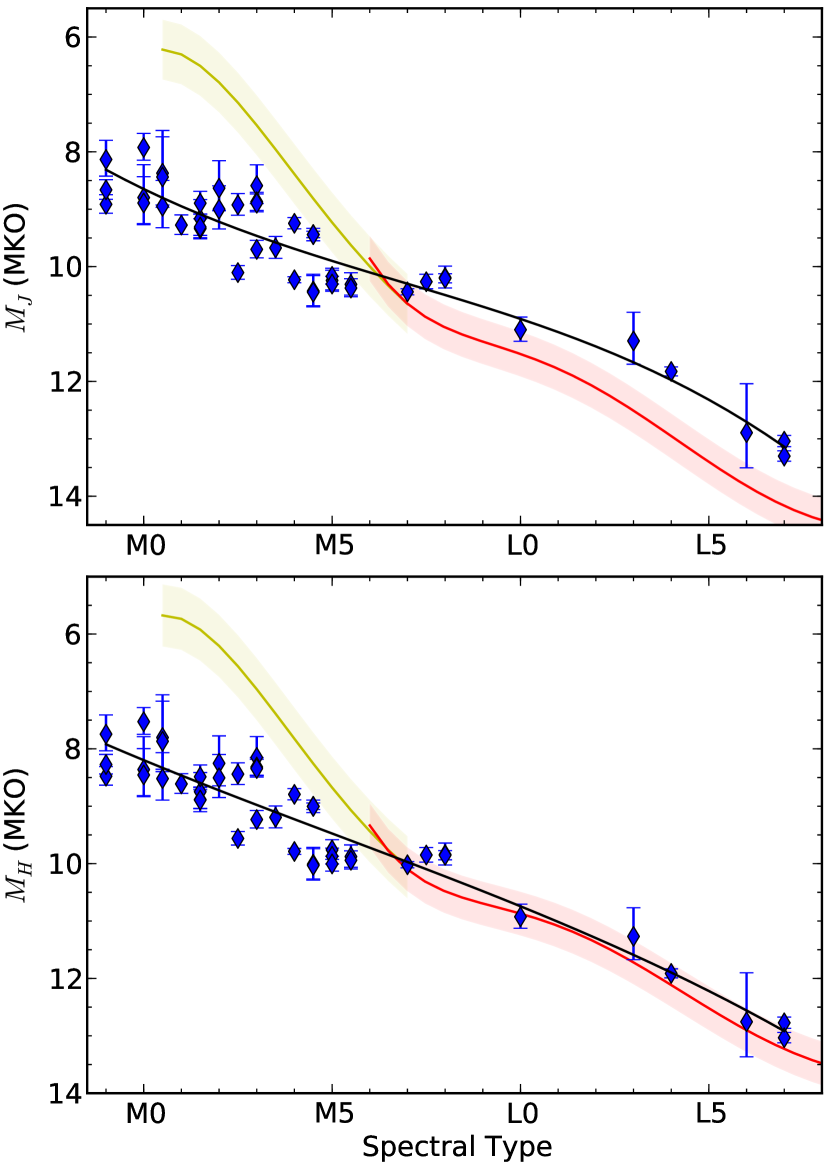
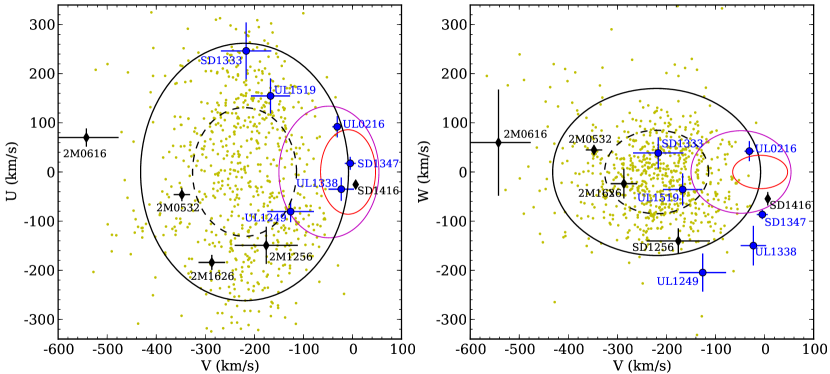
Fig. 17 shows the velocities of 11 subdwarfs including 5 known L subdwarfs with parallax distances, and our 6 new L subdwarfs. The 1 and 2 velocity dispersions of the thin disc, thick disc and halo (Reddy, Lambert, & Allende Prieto, 2006), and esdM and usdM subdwarfs (Zhang et al., 2013) are also plotted for comparison. While expected scatter in velocity precludes direct kinematic association of individual objects, we can usefully consider the overall kinematic distribution in Fig. 17. It can be seen that none of the L subdwarfs (previously known and new) lie within the 2 thin disc velocity dispersions in both plots. Four out of five of the previously known L subdwarfs lie beyond the 2 thick disc velocity dispersion, whereas approximately 50 per cent of the new L subdwarfs lie in this region. This is consistent with the L subdwarfs being members of the thick disc or halo populations. It is also indicative (though these are low number statistics) of the new sample having a somewhat higher fraction of thick-disc members (compared to halo members).
5 Atmospheric properties
5.1 Model comparison
Optical–NIR spectra of L subdwarfs are affected by , metallicity, and log in a complicated way. The NIR spectra are mainly affected by and metallicity, and less so by log . But the optical spectra are most sensitive to , with a lower level of metallicity and log sensitivity. Thus, taken together the optical–NIR model comparisons combine to provide an improved ability to yield and metallicity constraints of L subdwarfs. Although the broadness of the K I wings is gravity sensitive, this is not detrimental to L subdwarf classification since they are all old and have small variation in surface gravity.
Atmospheric models can reproduce the overall observed SED of UCSDs, and can closely reproduce a variety of optical and NIR spectral features. For model fitting we made use of the BT-Settl model grids333https://phoenix.ens-lyon.fr/Grids/BT-Settl/. The BT-Settl model grids for 2700 K 3000 K are from Allard, Homeier, & Freytag (2011), cover [Fe/H] and 5.0 log 5.5, with intervals of 100 K for and 0.5 dex for both [Fe/H] and log . The BT-Settl model grids for 1400 K 2600 K are from Allard, Homeier, & Freytag (2014), cover [Fe/H] and 5.0 log 5.75, with intervals of 100 K for , 0.5 dex for [Fe/H] and 0.25 dex for log (surface gravity). We also used linear interpolation between some models where this was able to yield an improved fit.
We took a non-standard approach to fitting these models. Non uniform levels of fit quality (across different wavelength features), and the availability of model grid coverage, make routine reduced-Chi-squared () fitting problematic. We Therefore, adopted a hybrid method (combining visual fits with uncertainty estimates informed by reduced calculations). We identified best-fitting BT-Settl model spectra through visual comparison with our observed spectra, noting (see below) any outstanding issues with our chosen best fits. Our output fit results include BT-Settl model parameters where a favourable comparison was found. To assess the uncertainties associated with these fits we selected a representative test-sample from amongst our subdwarfs, and measured the reduced values for their best-fitting models. We then determined reduced values for models with parameters close to the best-fitting (where model grid availability is allowed), and used linear interpolation to estimate parameter uncertainties representative of (i.e. a reduced increase of 1.0). The results were reasonably uniform across our test sample, and indicate uncertainties of 120 K in , 0.2 dex in [Fe/H], and 0.2 dex in log .
To provide an additional test for the models and check the reliability of our results, we performed our fits not only for the 6 new subdwarfs (Table 1) and 3 known L subdwarfs that we observed, but also for another 13 known late-type M and L subdwarfs for which optical and NIR spectra were available. Table 7 shows the resulting best fit atmospheric parameters for all 22 UCSDs.
| Name | Short name | [Fe/H] | log | SpT1 | Reference | SpT2 | |
|---|---|---|---|---|---|---|---|
| APMPM 0559-2903 | APM0559 | 3000 | –1.8 | 5.50 | esdM7 | Burgasser & Kirkpatrick (2006) | usdM7 |
| LHS 377 | — | 2900 | –1.2 | 5.50 | sdM7 | Burgasser (2004a) | esdM7 |
| 2MASS J01423153+0523285 | 2M0142 | 2900 | –1.5 | 5.50 | sdM8.5 | Burgasser et al. (2004b) | esdM7.5 |
| 2MASS J04470652-1946392 | 2M0447 | 2900 | –1.5 | 5.50 | sdM7.5 | Kirkpatrick et al. (2010) | esdM7.5 |
| LEHPM 2-59 | — | 2900 | –2.2 | 5.50 | esdM8 | Burgasser & Kirkpatrick (2006) | usdM8 |
| SSSPM 1013-1356 | SSS1013 | 2700 | –1.8 | 5.50 | esdM9.5 | Burgasser (2004a) | usdL0 |
| 2MASS J16403197+1231068 | 2M1640 | 2600 | –1.2 | 5.50 | sdM9/sdL | Gizis & Harvin (2006) | esdL0 |
| WISEA J001450.17-083823.4 | WI0014 | 2600 | –1.2 | 5.50 | sdL0 | Kirkpatrick et al. (2014) | esdL0 |
| ULAS J124425.75+102439.3 | UL1244 | 2500 | –1.5 | 5.50 | sdL0.5 | Lodieu et al. (2012) | esdL0.5 |
| LSR 1826+3014 | LSR1826 | 2400 | –0.5 | 5.50 | d/sdM8.5 | Burgasser et al. (2004b) | sdL0 |
| 2MASS J00412179+3547133 | 2M0041 | 2300 | –0.5 | 5.50 | sdL | Burgasser et al. (2004b) | sdL0.5 |
| SDSS J134749.74+333601.7 | SD1347 | 2400 | –0.5 | 5.50 | — | — | sdL0 |
| SDSS J133348.24+273508.8 | SD1333 | 2400 | –0.9 | 5.50 | — | — | sdL1 |
| ULAS J124947.04+095019.8 | UL1249 | 2200 | –0.7 | 5.50 | — | — | sdL1 |
| 2MASS J17561080+2815238 | 2M1756 | 2200 | –0.5 | 5.50 | sdL1 | Kirkpatrick et al. (2010) | sdL1 |
| SDSS J125637.16022452.2 | SD1256 | 2250 | –1.8 | 5.50 | sdL3.5 | Burgasser et al. (2009) | usdL3 |
| 2MASS J16262034+3925190 | 2M1626 | 2125 | –1.8 | 5.50 | sdL4 | Burgasser (2004a) | usdL4 |
| ULAS J151913.03000030.0 | UL1519 | 2100 | –1.3 | 5.50 | — | — | esdL4 |
| ULAS J021642.97+004005.6 | UL0216 | 2000 | –0.6 | 5.25 | — | — | sdL4 |
| 2MASS J061640066407194 | 2M0616 | 1700 | –1.6 | 5.25 | sdL5 | Cushing et al. (2009) | esdL6 |
| ULAS J133836.97022910.7 | UL1338 | 1650 | –1.0 | 5.25 | — | — | sdL7 |
| 2MASS J05325346+8246465 | 2M0532 | 1600 | –1.6 | 5.25 | sdL7 | Burgasser et al. (2003) | esdL7 |
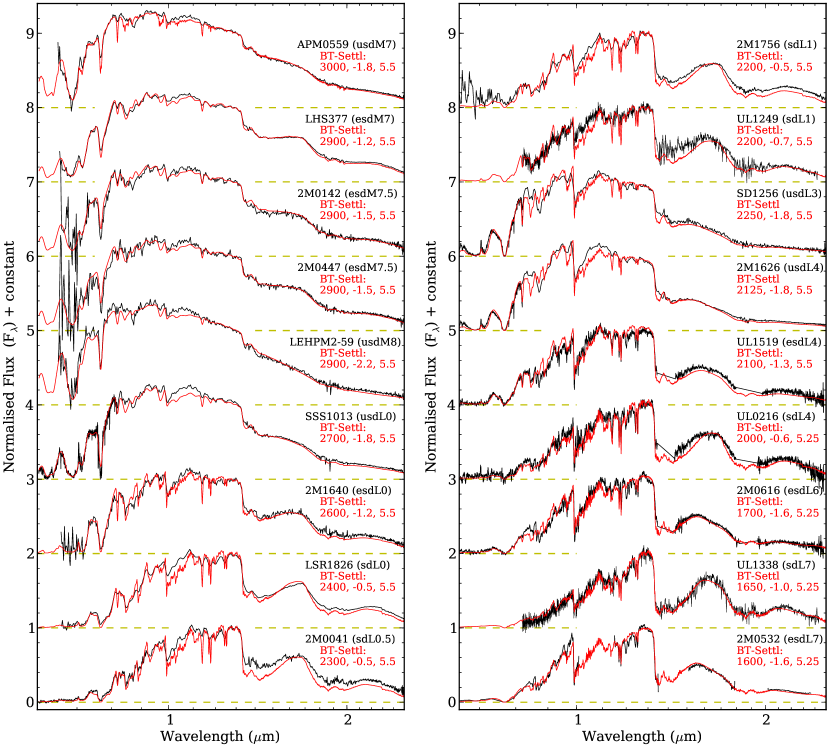
Fig. 18 shows optical+NIR spectra of late-type M and L subdwarfs compared to BT-Settl models. Fig. 19 shows the optical spectra of four L subdwarfs (SD1347, SD1333, UL1244 and WI0014) for which no NIR spectral coverage was available. Overall 22 late-type M and L subdwarfs were fitted well by BT-Settl models.
From Fig. 18 we can see that the BT-Settl model fits of very metal-poor UCSDs (e.g. ) are better than for objects with higher metallicity. This is possibly because more metal-poor atmospheres are simpler and easier to model. UL0216 is fitted well by the BT-Settl model spectrum with =1600 K, , and log = 5.25. However, the model over estimates the water absorption band around 1.5 m. The BT-Settl model fit to UL1519 is better in the optical, than in the NIR. UL1338 is fitted well by the model, but the BT-Settl models are not reliable at K and when we consider the colours derived from the model spectra (Fig. 1). The model may not represent the true atmospheric parameters of UL1338.
Fig. 19 shows that optical spectra alone can provide reasonable results when fitting the properties of such early-type L subdwarfs. Further evidence for this comes from SD1347 (optical-only fit) and LSR1826 (optical + NIR fit, Fig. 18), which are fit well by the same model. The BT-Settl model was very effective at reproducing the observed spectrum of UL1244.
5.2 Spectral type and relationships
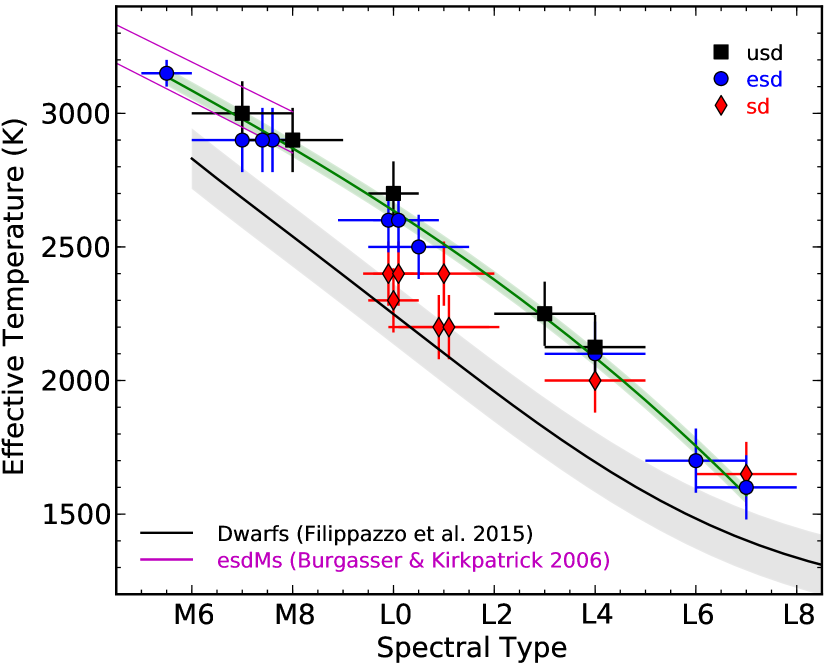
The is typically the most important factor in shaping the spectra of VLMS and BD. Mid to late-type M subdwarfs are found to have higher than M dwarfs of the same type (Burgasser & Kirkpatrick, 2006; Rajpurohit et al., 2014). Fig. 20 shows the relationship between spectral types and of late-type M and L subdwarfs provided in Table 7. The errors on shown in Fig. 20 are about 120 K. The values for these subdwarfs are about 100–400 K higher than dwarfs with the same spectral types. The of early-type sdL subdwarfs are about 100-200 K higher than early-type L dwarfs. Fig. 20 also shows that a subdwarf can have similar to a dwarf classified 2–3 subtypes earlier. For instance, objects with spectral types of L0.5, sdL1 and usdL3 would have similar . We have determined a polynomial fit to the spectral type (SpT) and of objects with esdM5.5–esdL7 and usdM7–usdL4 types, which follows:
| (7) |
with an rms of 32.5 K. In this equation SpT = 10 for esdL0/usdL0, and SpT = 17 for esdL7/usdL7 (etc). All sdLs were excluded in the fit simply because most of these examples are confined to a small range (sdL0–1) in the spectral subtype.
Our estimates for late-type M subdwarfs are consistent with the results from Burgasser & Kirkpatrick (2006) where they made NIR spectral fits to the subsolar metallicity models NextGen (Hauschildt, Allard, & Baron, 1999; Allard et al., 2001) and Ackerman & Marley (2001). The of the four esdM5–esdM8 subdwarfs in Burgasser & Kirkpatrick (2006) were estimated based on optical spectra and are about 150 K higher than those based on NIR spectra. The of late-type M subdwarfs estimated from high-resolution optical spectra and BT-Settl models in Rajpurohit et al. (2014) is also 150–200 K higher than our results. Thus, there is a discrepancy between the difference (between late-type M subdwarfs and dwarfs) reported by Rajpurohit et al. (2014) and that found in our analysis (400–500 K and 200–400 K, respectively). Also, Fig. 7 of Burgasser & Kirkpatrick (2006) presents a difference (between the sequences) of 400-600 K, based on NIR spectral fits. The difference with our result is mainly due to the M dwarf scale that we used (Filippazzo et al., 2015), which is warmer than that used by Burgasser & Kirkpatrick (2006). The older spectral type relation for M dwarfs underwent some improvement by Filippazzo et al. (2015), who used a larger sample and newer models. This work is also consistent with a sample of M dwarfs from Mann et al. (2015) for which estimation were relatively independent of models.
6 Discussions
6.1 Metallicity ranges of the subclasses of M and L subdwarfs
Metallicity plays an important role in shaping the spectra of VLMS and BD, causing shifts in the spectral types and temperature scale. L subdwarfs are a natural extension of M subdwarfs into lower mass and regimes. M subdwarfs are brighter and more numerous than L subdwarfs, and relatively well characterized; thus, they provide a useful comparison and possible reference for the characterization of L subdwarfs.
To determine the metallicity subclasses of M dwarfs and subdwarfs LRS07 used the metallicity index , and defined four metallicity subclasses: ultra subdwarf (usdM; ), extreme subdwarf (esdM; ), subdwarf (sdM; ) and dwarf (dM; ). The metallicity distributions of these four subclasses became clear when metallicity measurements were made based on optical high-resolution spectra (e.g. Woolf, Lépine, & Wallerstein, 2009). This allowed a relationship (albeit with a scatter) to be established between and iron abundance, which was recently refined by Pavlenko et al. (2015) who combined data from Woolf & Wallerstein (2006) and Woolf, Lépine, & Wallerstein (2009) to give
| (8) |
with an rms of 0.26. However, equation (8) is valid only for early-type M subdwarfs, because all the objects in the Woolf sample are M0–M3 subdwarfs.
We calculated approximate metallicity ranges for the four LRS07 subclasses of M0–M3 subdwarfs using the ranges from LRS07 and equation (8) (these are presented in the left-hand side of Table 8). As we discussed in Section 4.1, the metallicity consistency of is tested only for early-type M subdwarfs. The index is not a consistent indicator of metallicity across all M subtypes and L types.
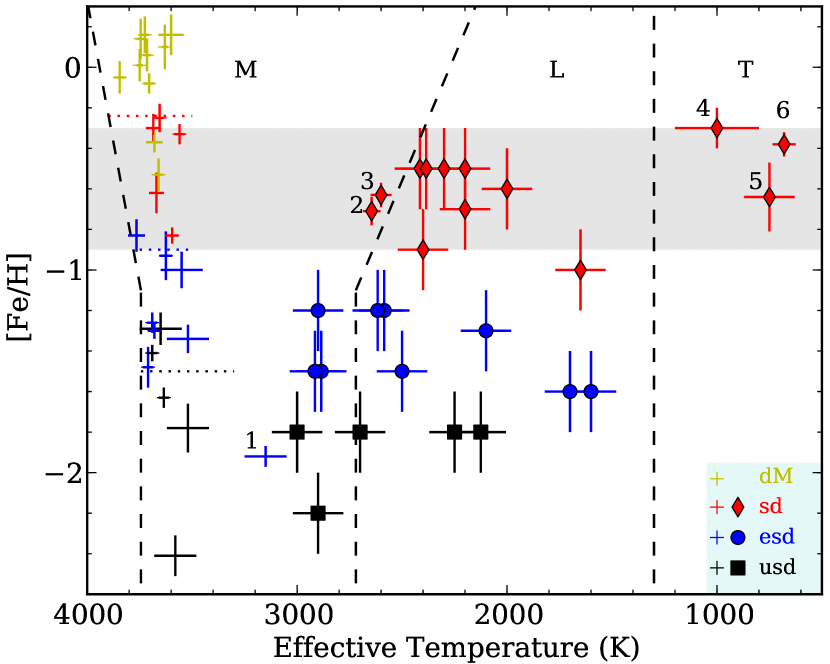
Fig. 21 explores how metallicity subclass distributions map on to the metallicity- plane for M, L and T types. Three black dashed lines indicate the boundaries between K, M, L and T dwarfs/subdwarfs which are derived from spectral type– relationships of late-type M and L dwarfs (Filippazzo et al., 2015) and subdwarfs [equation (7)] augmented with data from Mann et al. (2015). Different symbol shapes/colours indicate different spectral subclasses (see caption of Fig. 21). These late M and L subdwarf subclasses are modified from the literature in Section 4.2. We note that there are no L subdwarf benchmark companions currently known, and although there are additional known T subdwarfs in the literature, none have metallicity constraints as robust as the objects shown in the plot.
The approximate metallicity ranges of the subclasses of M0–M3 defined by LRS07 are shown as dotted lines in the left side of the plot. It can be seen that these metallicity ranges reasonably bracket the four LRS07 metallicity subclasses (d, sd, esd, and usd), though there is some scatter that leads to each LRS07 subclass spreading into adjacent metallicity ranges (this will be discussed further later in this section). We also establish the approximate metallicity ranges for the subclasses of L subdwarfs (or more generally the 3000 K population). The metallicity range for these UCSDs is [Fe/H] and is [Fe/H] for the sd subclass. These are very similar to the metallicity ranges of the LRS07 dM0-3 and sdM0-3 subclasses. At lower metallicity (for 3000 K), the metallicity range is [Fe/H] for the esd subclass and is for the usd subclass. These cover slightly different metallicity ranges than the (M0–M3) LRS07 esdM and usdM subclasses.
By comparison, the kinematic halo population of F, G, and K stars have and a metallicity distribution function peaks at (Laird et al., 1988; Spagna et al., 2010; An et al., 2013), well matched to the two lowest metallicity ranges for both classification schemes. And thin disc stars generally have (e.g. from APOGEE; Hayden et al., 2015), well matched to the highest metallicity range for both schemes.
Although the metallicity ranges for the two subclass schemes appear reasonably consistent, there is some evidence that they may not be consistent in the late M regime. The metallicity ranges of the LRS07 subclasses were estimated using M0–M3 subdwarfs, and we note three later dwarfs in the LRS07 esdM subclass that have metallicity well below the approximate range expected from M0-M3 dwarfs. G224-58 B (esdM5.5 according to LRS07) has a significantly lower metallicity than earlier esdM dwarfs, and APM0559 and LEHPM 2-59 have similarly low metallicity and are classified as esdM by LRS07 and usdM in this paper. Changing metallicity ranges within a metallicity subclass is not ideal, and attempts to mitigate against this were made by LRS07 through the use of wide binary systems (whose components should have common metallicity) to help define subclass divisions. However, the lack of subdwarf binaries with early and late M components could have led to metallicity gradients across the LRS07 subtypes. Any such gradients appear to be largely absent from the 3200 K subclasses scheme. Clearly more binary systems like SDSS J210105.37–065633.0 AB (esdM1.5+esdM5.5; Zhang et al., 2013; Pavlenko et al., 2015) would be very useful if the metallicity subclasses of early-late M subdwarfs are to be refined. Table 8 summarises both subclass schemes, and indicates approximate links between subclasses, metallicity and kinematic populations.
| aSubclass | [Fe/H] | | | Kinematics | | | Subclass | [Fe/H] |
|---|---|---|---|---|---|---|
| dM0-3 | 0.24 | | | Thin disc | | | dL | 0.3 |
| sdM0-3 | | | Thick disc | | | sdL | ||
| esdM0-3 | | | Halo | | | esdL | ||
| usdM0-3 | 1.5 | | | Halo | | | usdL | 1.7 |
-
a
Metallicity subclasses of M dwarfs/subdwarfs are based on the classification scheme of LRS07.
6.2 Absolute magnitudes of L and T subdwarfs
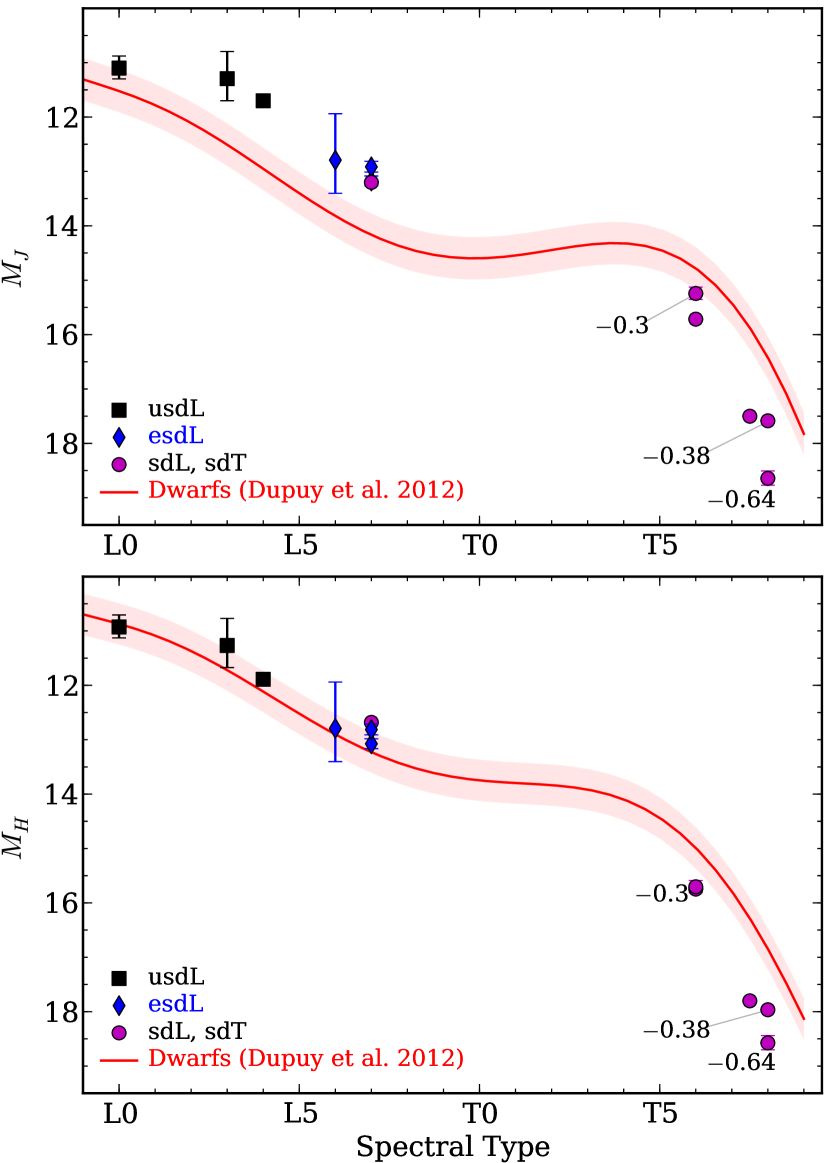
In Fig. 22 we plot and absolute magnitude against spectral type relationships for L and T dwarfs and subdwarfs. The dwarf sequence (red line) comes from Dupuy & Liu (2012). These six L subdwarfs with parallax distances are: 2M0532 (Burgasser et al., 2008b; Schilbach, Röser, & Scholz, 2009), 2M0616 (Faherty et al., 2012), SSS1013, 2M1256, and 2M1626 (Schilbach, Röser, & Scholz, 2009), and SD1416 A (Dupuy & Liu, 2012). To extend the subdwarf sequence into the T dwarf regime, we collected T subdwarfs with direct or indirect parallax measurements from the literature. They are either single objects with parallax distances or companions to bright stars which have parallax distances. The parallax of 2MASS J09373487+2931409 (T6p; Burgasser et al., 2002) was measured by Schilbach, Röser, & Scholz (2009). The parallax of SD1416 B (T7.5p; Burningham et al., 2010) was from SD1416 A (Dupuy & Liu, 2012). The parallaxes of Hip 73786 B (T6p; Murray et al., 2011), BD+01∘ 2920 B (T8p; Pinfield et al., 2012), and WISE 2005+5424 (sdT8; Mace et al., 2013) are measured from their primary stars (van Leeuwen, 2007).
It is interesting to compare the dwarf and subdwarf sequences. M0-M5 dwarfs are brighter in the band than subdwarfs of the same spectral type, while M7-L7 dwarfs are fainter in the band (see Fig. 16). Fig. 22 shows that T dwarfs are brighter in and band than sdT subdwarfs of the same spectral type. A larger sample of L and T subdwarfs with parallax distances would allow us to have a better idea of how and why they are different from dwarfs.
The sdT subdwarfs have and that are fainter by 1–2 mag when compared to T dwarfs with the same NIR spectral type. Distances of isolated late-type T subdwarfs will be over estimated by 20.5 times, if they are based on relationships between spectral type and or absolute magnitude (e.g. Dupuy & Liu, 2012; Faherty et al., 2012). Pinfield et al. (2014) also noted that the distance constraints (estimated from T dwarf absolute magnitude versus spectral type relations) for two highly band suppressed fast moving T subdwarfs are much greater when using NIR bands than for mid-infrared bands.
7 Summary
In this paper we presented the discovery of six L subdwarfs from SDSS and UKIDSS (UL0216, UL1249, SD1333, UL1338, SD1347, and UL1519). We also presented new optical spectra of three previously known L subdwarfs (WI0014, 2M0041, and UL1244). We discussed the spectral properties of the known L subdwarfs, performed some re-classification of some known objects, and determined spectral type and subclass for our new L subdwarfs.
We compared the nine measured objects with BT-Settl model spectra, and estimated their and metallicity. We also estimated atmospheric properties of another 13 known late-type M and L subdwarfs for which red optical and NIR spectra are available. BT-Settl models were successful in reproducing the overall optical–NIR spectral profile of M and L subdwarfs, particularly at . However, the BT-Settl models could not reproduce, in detail, some optical spectroscopic features of L subdwarfs. Our model fit results show that esdL and usdL subdwarfs have temperatures about 200–300 K higher than L dwarfs with the same spectral type, and have similar to L dwarfs that are about 2–3 subtypes earlier.
We also found that the approximate metallicity ranges of the 3000 K subclasses (including the L subdwarfs and some sdT dwarfs) are: for usd, for esd, and for sd. The metallicity ranges of the subclasses of cooler ( 3000 K) M and L subdwarfs are reasonably consistent with early-type M subdwarfs. However, there is some evidence for a metallicity gradient across the LRS07 subclasses. Binary systems containing both early- and late-type M subdwarfs could be an important tool if the 3000 K M classification scheme is to be refined.
In the NIR, L subdwarfs are more luminous than L dwarfs with the same spectral type, while late-type sdT subdwarfs are less luminous than T dwarfs with the same spectral type. The band absolute magnitudes of five known late-type sdT subdwarfs are 1–2 mag fainter than T dwarfs with the same spectral type. Spectroscopic distances of known sdT subdwarfs would be over estimated by 20.5 times if based on spectral type and NIR absolute magnitude relationships for T dwarfs.
Acknowledgments
This paper includes data gathered with the 6.5 meter Magellan Telescopes located at Las Campanas Observatory, Chile. Based on observations made with the Gran Telescopio Canarias (GTC), installed in the Spanish Observatorio del Roque de los Muchachos of the Instituto de Astrofísica de Canarias, in the island of La Palma. This work is based in part on data obtained as part of the UKIRT Infrared Deep Sky Survey. The UKIDSS project is defined in Lawrence et al. (2007). UKIDSS uses the UKIRT Wide Field Camera (WFCAM; Casali et al., 2007). The photometric system is described in Hewett et al. (2006), and the calibration is described in Hodgkin et al. (2009). The pipeline processing and science archive are described in Irwin et al. (2004) and Hambly et al. (2008). Funding for the SDSS and SDSS-II has been provided by the Alfred P. Sloan Foundation, the Participating Institutions, the National Science Foundation, the U.S. Department of Energy, the National Aeronautics and Space Administration, the Japanese Monbukagakusho, the Max Planck Society, and the Higher Education Funding Council for England. The SDSS Web Site is http://www.sdss.org/. Funding for SDSS-III has been provided by the Alfred P. Sloan Foundation, the Participating Institutions, the National Science Foundation, and the U.S. Department of Energy Office of Science. The SDSS-III web site is http://www.sdss3.org/. This publication makes use of data products from the Two Micron All Sky Survey.
This research has made use of the VizieR catalogue access tool, CDS, Strasbourg, France. Research has benefited from the M, L, and T dwarf compendium housed at DwarfArchives.org and maintained by Chris Gelino, Davy Kirkpatrick, and Adam Burgasser. This research has benefited from the SpeX Prism Spectral Libraries, maintained by Adam Burgasser at http://www.browndwarfs.org/spexprism. This publication makes use of VOSA, developed under the Spanish Virtual Observatory project supported from the Spanish MICINN through grant AyA2008-02156.
ZHZ is supported by the IAC fellowship. ZZ and NL are partially funded by the Spanish Ministry of Economy and Competitiveness (MINECO) under the grants AYA2015-69350-C3-2-P and AYA2010-19136. ZHZ was partly supported by the Royal Astronomical Society to attend international conferences. ZHZ, BB, HRAJ, FM, RLS and JG have received support from the Marie Curie 7th European Community Framework Programme grant n.247593 Interpretation and Parametrization of Extremely Red COOL dwarfs (IPERCOOL) International Research Staff Exchange Scheme. DJP, BB, HRAJ, FM, ACD and JG are supported by STFC grant ST/M001008/1. FA and AJB were supported by the Jesus Ferra Foundation for their visit to the Instituto de Astrofísica de Canarias. MCGO acknowledges the financial support of a JAE-Doc CSIC fellowship co-funded with the European Social Fund under the programme ‘Junta para la Ampliación de Estudios’ and the support of the Spanish Ministry of Economy and Competitiveness through the project AYA2014-54348-C3-2-R. FA received funding from the French ‘Programme National de Physique Stellaire’ (PNPS) and the ‘Programme National de Planétologie’ of CNRS (INSU). DH is supported by Sonderforschungsbereich SFB 881 ‘The Milky Way System’ (subproject A4) of the German Research Foundation (DFG). The computations of atmosphere models were performed at the Pôle Scientifique de Modélisation Numérique (PSMN) at the École Normale Supérieure (ENS) in Lyon, and at the Gesellschaft für Wissenschaftliche Datenverarbeitung Göttingen in collaboration with the Institut für Astrophysik Göttingen. The authors thank the referee, J. Davy Kirkpatrick for the useful and constructive comments.
References
- Abel et al. (2012) Abel M., Frommhold L., Li X., Hunt K. L. C., 2012, JChPh, 136, 044319
- Ackerman & Marley (2001) Ackerman A. S., Marley M. S., 2001, ApJ, 556, 872
- Aganze et al. (2016) Aganze C., et al., 2016, AJ, 151, 46
- Allard & Hauschildt (1995) Allard F., Hauschildt P. H., 1995, ApJ, 445, 433
- Allard et al. (2001) Allard F., Hauschildt P. H., Alexander D. R., Tamanai A., Schweitzer A., 2001, ApJ, 556, 357
- Allard, Homeier, & Freytag (2011) Allard F., Homeier D., Freytag B., 2011, ASPC, 448, 91
- Allard et al. (2013) Allard F., Homeier D., Freytag B., Schaffenberger, W., Rajpurohit A. S., 2013, MSAIS, 24, 128
- Allard, Homeier, & Freytag (2014) Allard F., Homeier D., Freytag B., 2014, ASInC, 11, 33
- Baraffe et al. (1995) Baraffe I., Chabrier G., Allard F., Hauschildt P. H., 1995, ApJ, 446, L35
- An et al. (2013) An D., et al., 2013, ApJ, 763, 65
- Baraffe et al. (2015) Baraffe I., Homeier D., Allard F., Chabrier G., 2015, A&A, 577, A42
- Bates (1952) Bates D. R., 1952, MNRAS, 112, 40
- Bayo et al. (2008) Bayo A., Rodrigo C., Barrado Y Navascués D., Solano E., Gutiérrez R., Morales-Calderón M., Allard F., 2008, A&A, 492, 277
- Bochanski et al. (2007) Bochanski J. J., West A. A., Hawley S. L., Covey K. R., 2007, AJ, 133, 531
- Bochanski et al. (2009) Bochanski J. J., et al., 2009, PASP, 121, 1409
- Borysow, Frommhold, & Moraldi (1989) Borysow A., Frommhold L., Moraldi M., 1989, ApJ, 336, 495
- Borysow, Jorgensen, & Fu (2001) Borysow A., Jorgensen U. G., Fu Y., 2001, JQSRT, 68, 235
- Bowler, Liu, & Cushing (2009) Bowler B. P., Liu M. C., Cushing M. C., 2009, ApJ, 706, 1114
- Bowler, Liu, & Dupuy (2010) Bowler B. P., Liu M. C., Dupuy T. J., 2010, ApJ, 710, 45
- Burgasser et al. (2002) Burgasser A. J., et al., 2002, ApJ, 564, 421
- Burgasser et al. (2003) Burgasser A. J., et al., 2003, ApJ, 592, 1186
- Burgasser (2004a) Burgasser A. J., 2004a, ApJ, 614, L73
- Burgasser et al. (2004b) Burgasser A. J., McElwain M. W., Kirkpatrick J. D., Cruz K. L., Tinney C. G., Reid I. N., 2004b, AJ, 127, 2856
- Burgasser & Kirkpatrick (2006) Burgasser A. J., Kirkpatrick J. D., 2006, ApJ, 645, 1485
- Burgasser, Cruz, & Kirkpatrick (2007a) Burgasser A. J., Cruz K. L., Kirkpatrick J. D., 2007a, ApJ, 657, 494
- Burgasser (2007b) Burgasser A. J., 2007b, ApJ, 659, 655
- Burgasser et al. (2008a) Burgasser A. J., Liu M. C., Ireland M. J., Cruz K. L., Dupuy T. J., 2008a, ApJ, 681, 579
- Burgasser et al. (2008b) Burgasser A. J., Vrba F. J., Lépine S., Munn J. A., Luginbuhl C. B., Henden A. A., Guetter H. H., Canzian B. C., 2008b, ApJ, 672, 1159
- Burgasser et al. (2008c) Burgasser A. J., Looper D. L., Kirkpatrick J. D., Cruz K. L., Swift B. J., 2008c, ApJ, 674, 451-465
- Burgasser et al. (2009) Burgasser A. J., Witte S., Helling C., Sanderson R. E., Bochanski J. J., Hauschildt P. H., 2009, ApJ, 697, 148
- Burgasser et al. (2010) Burgasser A. J., Cruz K. L., Cushing M., Gelino C. R., Looper D. L., Faherty J. K., Kirkpatrick J. D., Reid I. N., 2010, ApJ, 710, 1142
- Burningham et al. (2010) Burningham B., et al., 2010, MNRAS, 404, 1952
- Burrows et al. (2001) Burrows A., Hubbard W. B., Lunine J. I., Liebert J., 2001, RvMP, 73, 719
- Casali et al. (2007) Casali M., et al., 2007, A&A, 467, 777
- Cenarro et al. (2007) Cenarro A. J., et al., 2007, MNRAS, 374, 664
- Cepa et al. (2000) Cepa J., et al., 2000, SPIE, 4008, 623
- Clarke et al. (2010) Clarke J. R. A., et al., 2010, MNRAS, 402, 575
- Cushing et al. (2003) Cushing M. C., Rayner J. T., Davis S. P., Vacca W. D., 2003, ApJ, 582, 1066
- Cushing et al. (2009) Cushing M. C., Looper D., Burgasser A. J., Kirkpatrick J. D., Faherty J., Cruz K. L., Sweet A., Sanderson R. E., 2009, ApJ, 696, 986
- Cushing et al. (2011) Cushing M. C., et al., 2011, ApJ, 743, 50
- Day-Jones et al. (2013) Day-Jones A. C., et al., 2013, MNRAS, 430, 1171
- Dressler et al. (2011) Dressler A., et al., 2011, PASP, 123, 288
- Dupuy & Liu (2012) Dupuy T. J., Liu M. C., 2012, ApJS, 201, 19
- Faherty et al. (2012) Faherty J. K., et al., 2012, ApJ, 752, 56
- Filippazzo et al. (2015) Filippazzo J. C., Rice E. L., Faherty J., Cruz K. L., Van Gordon M. M., Looper D. L., 2015, ApJ, 810, 158
- Freudling et al. (2013) Freudling W., Romaniello M., Bramich D. M., Ballester P., Forchi V., García-Dabló C. E., Moehler S., Neeser M. J., 2013, A&A, 559, A96
- Gizis (1997) Gizis J. E., 1997, AJ, 113, 806
- Gizis & Harvin (2006) Gizis J. E., Harvin J., 2006, AJ, 132, 2372
- Gizis et al. (2012) Gizis J. E., et al., 2012, AJ, 144, 94
- Gizis et al. (2015) Gizis J. E., Allers K. N., Liu M. C., Harris H. C., Faherty J. K., Burgasser A. J., Kirkpatrick J. D., 2015, ApJ, 799, 203
- Grossman, Hays, & Graboske (1974) Grossman A. S., Hays D., Graboske H. C., Jr., 1974, A&A, 30, 95
- Hambly et al. (2001) Hambly N. C., et al., 2001, MNRAS, 326, 1279
- Hambly et al. (2008) Hambly N. C., et al., 2008, MNRAS, 384, 637
- Hauschildt, Allard, & Baron (1999) Hauschildt P. H., Allard F., Baron E., 1999, ApJ, 512, 377
- Hayden et al. (2015) Hayden M. R., et al., 2015, ApJ, 808, 132
- Hewett et al. (2006) Hewett P. C., Warren S. J., Leggett S. K., Hodgkin S. T., 2006, MNRAS, 367, 454
- Hodgkin et al. (2009) Hodgkin S. T., Irwin M. J., Hewett P. C., Warren S. J., 2009, MNRAS, 394, 675
- Irwin et al. (2004) Irwin M. J., et al., 2004, SPIE, 5493, 411
- Johnson & Soderblom (1987) Johnson D. R. H., Soderblom D. R., 1987, AJ, 93, 864
- Kirkpatrick, Henry, & McCarthy (1991) Kirkpatrick J. D., Henry T. J., McCarthy D. W., Jr., 1991, ApJS, 77, 417
- Kirkpatrick et al. (1999) Kirkpatrick J. D., et al., 1999, ApJ, 519, 802
- Kirkpatrick et al. (2000) Kirkpatrick J. D., et al., 2000, AJ, 120, 447
- Kirkpatrick et al. (2010) Kirkpatrick J. D., et al., 2010, ApJS, 190, 100
- Kirkpatrick et al. (2014) Kirkpatrick J. D., et al., 2014, ApJ, 783, 122
- Kirkpatrick et al. (2016) Kirkpatrick J. D., et al., 2016, ApJS, 224, 36
- Laird et al. (1988) Laird J. B., Carney B. W., Rupen M. P., Latham D. W., 1988, AJ, 96, 1908
- Lawrence et al. (2007) Lawrence A., et al., 2007, MNRAS, 379, 1599
- Lépine et al. (2002) Lépine S., Rich R. M., Neill J. D., Caulet A., Shara M. M., 2002, ApJ, 581, L47
- Lépine, Rich, & Shara (2007) Lépine S., Rich R. M., Shara M. M., 2007, ApJ, 669, 1235
- Lodieu et al. (2010) Lodieu N., Zapatero Osorio M. R., Martín E. L., Solano E., Aberasturi M., 2010, ApJ, 708, L107
- Lodieu et al. (2012) Lodieu N., Espinoza Contreras M., Zapatero Osorio M. R., Solano E., Aberasturi M., Martín E. L., 2012, A&A, 542, A105
- Luhman & Sheppard (2014) Luhman K. L., Sheppard S. S., 2014, ApJ, 787, 126
- Mace et al. (2013) Mace G. N., et al., 2013, ApJ, 777, 36
- Mann et al. (2015) Mann A. W., Feiden G. A., Gaidos E., Boyajian T., von Braun K., 2015, ApJ, 804, 64
- Marocco et al. (2015) Marocco F., et al., 2015, MNRAS, 449, 3651
- Martín et al. (1999) Martín E. L., Delfosse X., Basri G., Goldman B., Forveille T., Zapatero Osorio M. R., 1999, AJ, 118, 2466
- Murray et al. (2011) Murray D. N., et al., 2011, MNRAS, 414, 575
- Pavlenko et al. (2015) Pavlenko Y. V., Zhang Z. H., Gálvez-Ortiz M. C., Kushniruk I. O., Jones H. R. A., 2015, A&A, 582, A92
- Pinfield et al. (2012) Pinfield D. J., et al., 2012, MNRAS, 422, 1922
- Pinfield et al. (2014) Pinfield D. J., et al., 2014, MNRAS, 437, 1009
- Rajpurohit et al. (2014) Rajpurohit A. S., Reylé C., Allard F., Scholz R.-D., Homeier D., Schultheis M., Bayo A., 2014, A&A, 564, AA90
- Reddy, Lambert, & Allende Prieto (2006) Reddy B. E., Lambert D. L., Allende Prieto C., 2006, MNRAS, 367, 1329
- Rojas-Ayala et al. (2012) Rojas-Ayala B., Covey K. R., Muirhead P. S., Lloyd J. P., 2012, ApJ, 748, 93
- Saumon et al. (2012) Saumon D., Marley M. S., Abel M., Frommhold L., Freedman R. S., 2012, ApJ, 750, 74
- Schilbach, Röser, & Scholz (2009) Schilbach E., Röser S., Scholz R.-D., 2009, A&A, 493, L27
- Schmidt et al. (2010) Schmidt S. J., West A. A., Burgasser A. J., Bochanski J. J., Hawley S. L., 2010, AJ, 139, 1045
- Schneider et al. (2016) Schneider A. C., Greco J., Cushing M. C., Kirkpatrick J. D., Mainzer A., Gelino C. R., Fajardo-Acosta S. B., Bauer J., 2016, ApJ, 817, 112
- Scholz, Lodieu, & McCaughrean (2004) Scholz R.-D., Lodieu N., McCaughrean M. J., 2004, A&A, 428, L25
- Scholz et al. (2004) Scholz R.-D., Lehmann I., Matute I., Zinnecker H., 2004, A&A, 425, 519
- Simcoe et al. (2008) Simcoe R. A., et al., 2008, SPIE, 7014, 70140U
- Sivarani et al. (2009) Sivarani T., Lépine S., Kembhavi A. K., Gupchup J., 2009, ApJ, 694, L140
- Skrutskie et al. (2006) Skrutskie M. F., et al., 2006, AJ, 131, 1163
- Spagna et al. (2010) Spagna A., Lattanzi M. G., Re Fiorentin P., Smart R. L., 2010, A&A, 510, L4
- Vacca, Cushing, & Simon (2004) Vacca W. D., Cushing M. C., Simon T., 2004, ApJ, 609, L29
- van Leeuwen (2007) van Leeuwen F., 2007, ASSL, 350,
- Vernet et al. (2011) Vernet J., et al., 2011, A&A, 536, A105
- West et al. (2008) West A. A., Hawley S. L., Bochanski J. J., Covey K. R., Reid I. N., Dhital S., Hilton E. J., Masuda M., 2008, AJ, 135, 785
- Witte, Helling, & Hauschildt (2009) Witte S., Helling C., Hauschildt P. H., 2009, A&A, 506, 1367
- Woolf & Wallerstein (2006) Woolf V. M., Wallerstein G., 2006, PASP, 118, 218
- Woolf, Lépine, & Wallerstein (2009) Woolf V. M., Lépine S., Wallerstein G., 2009, PASP, 121, 117
- Wright et al. (2010) Wright E. L., et al., 2010, AJ, 140, 1868
- York et al. (2000) York D. G., et al., 2000, AJ, 120, 1579
- Zhang et al. (2009) Zhang Z. H., et al., 2009, A&A, 497, 619
- Zhang et al. (2012) Zhang Z. H., et al., 2012, http://www.mpia.de/homes/joergens/ringberg2012_proc/zhang.pdf
- Zhang et al. (2013) Zhang Z. H., et al., 2013, MNRAS, 434, 1005