The role of pebble fragmentation in planetesimal formation
II. Numerical simulations
Abstract
Some scenarios for planetesimal formation go through a phase of collapse of gravitationally bound clouds of mm-cm-sized pebbles. Such clouds can form for example through the streaming instability in protoplanetary disks. We model the collapse process with a statistical model to obtain the internal structure of planetesimals with solid radii between 10 and 1,000 km. In the collapse, pebbles collide and, depending on relative speed, collisions have different outcomes. A mixture of particle sizes inside a planetesimal leads to better packing capabilities and higher densities. In this paper we apply results from new laboratory experiments of dust aggregate collisions (presented in a companion paper) to model collision outcomes. We find that the internal structure of a planetesimal is strongly dependent on both its mass and the applied fragmentation model. Low-mass planetesimals have no/few fragmenting pebble collisions in the collapse phase and end up as porous pebble-piles. The amount of fragmenting collisions increases with increasing cloud mass, resulting in wider particle size distributions and higher density. The collapse is nevertheless “cold” in the sense that collision speeds are damped by the high collision frequency. This ensures that a significant fraction of large pebbles survive the collapse in all but the most massive clouds. Our results are in broad agreement with the observed increase in density of Kuiper belt objects with increasing size as exemplified by the recent characterization of the highly porous comet 67P/Churyumov-Gerasimenko.
Subject headings:
Methods: analytical – Methods: numerical – Planets and satellites: formation1. Introduction
Planet formation takes place around young stars as m-sized dust and ice particles grow to ever larger bodies (Safronov, 1969). This leads to planets of characteristic sizes - km. The growth starts with particles sticking together by contact forces (see review by Blum & Wurm, 2008). Compactified pebbles of mm-cm sizes have poor sticking properties, but growth to planetesimals can be aided by the mutual gravity in pebble clouds that are concentrated in turbulent gas (see review by Johansen et al., 2014). This leads to the formation of planetesimals with a distribution of sizes ranging from 10 to several 100 km (Johansen et al., 2015; Simon et al., 2016).
Many details of the gravitational collapse phase are not yet fully understood. Nesvorný et al. (2010) pioneered the modelling of the collapse phase in N-body simulations of a large number of pebbles coming together by their mutual gravity. They found that pebble clouds with high internal angular momentum collapse into binary planetesimals. This can explain the high fraction of binaries observed in the classical cold population of trans-Neptunian objects (Noll et al., 2008). The two components in binary Kuiper belt objects appear to have the same colour and composition (Benecchi et al., 2009), suggesting that they formed together, since the Kuiper belt, overall, has a broad colour distribution. In the case of binary formation through three-body encounters (e.g. Goldreich et al., 2002) the components, most likely, should not have the same composition.
Wahlberg Jansson & Johansen (2014, hereafter WJJ) investigated the evolution of the particle size distribution during the collapse phase, based on laboratory experiments of particle collisions (Güttler et al., 2010). The initial pebble clouds were assumed to arise from the streaming instability (e.g. Youdin & Goodman, 2005; Johansen et al., 2009, 2012; Bai & Stone, 2010). A major result of this paper was that the collapse process is very dependent on planetesimal mass. More massive clouds collapse faster and collisions between pebbles result in pebble fragmentation. This affects the internal structure (e.g. density and porosity) of the resulting planetesimal: low-mass planetesimals should be porous pebble-piles while higher-mass planetesimals are a denser mixture of dust and pebbles. This relation with density increasing with increasing size agrees with observations of Kuiper belt objects (Brown, 2013). However, other parameters such as composition, radioactive heating and collisions will also affect the structure, but the effect of those processes all depend on the initial porosity and packing efficiency. Therefore the outcome of pebble cloud collapse models can be used as starting point for calculations of the long-term thermal evolution of planetesimals (e.g. Lichtenberg et al., 2016). Lorek et al. (2016) expanded the cloud collapse model in WJJ to investigate the evolution of the density of the pebbles throughout the collapse. Bouncing collisions cause porous dust (ice) aggregates to become more compact. The authors used their results to constrain the range of initial conditions (cloud mass, dust-to-ice ratio and initial filling factor) that can produce comets and other observed bodies in the outer Solar System. They find that planetesimals with observed comet bulk density of 0.5 g cm-3 can form either if the cloud is low-mass and initially have compact pebbles or if the cloud is massive independent on initial pebble porosity.
Observational data on the structure of planetesimals in the outer Solar System has increased dramatically in the past years. The space probes Rosetta (ESA) and New Horizons (NASA) have both reached their respective targets, the Jupiter family comet 67P/Churyumov-Gerasimenko (hereafter 67P) and the dwarf planet Pluto.
Rosetta has multiple instruments that provide measurements for understanding the origin of planetesimals. OSIRIS is an optical, spectroscopic and infrared system for imaging the nucleus of 67P from Rosetta (Keller et al., 2007). The “goosebump” structures in the walls of the deep pits have been suggested to represent the primordial pebbles that make up the bulk of the comet (Sierks et al., 2015), although the meter scale of those pebbles are in some disagreement with the particle sizes that are believed possible to form by coagulation in the outer regions of protoplanetary disks (Birnstiel et al., 2012; Lambrechts & Johansen, 2014). High-resolution images returned by the Philae lander indicate a typical scale closer to 1 cm at the surface (Mottola et al., 2015), more in agreement with expectations.
Measurements of shape and gravity field have yielded a bulk density of only 0.53 g cm-3, so clearly 67P is very porous (70-75% depending on assumed dust-to-ice ratio). The CONSERT radar (Kofman et al., 2007) had a main aim to measure the internal structure of the comet. Gravity measurements and radar tomography (Pätzold et al., 2016; Kofman et al., 2015) indicate that 67P is approximately homogeneous on length scales 3 m and very porous. These results are consistent with 67P being a pebble-pile consisting of loosely packed primordial pebbles from the solar protoplanetary disk.
The constituent particles of 67P can also be inferred from the dust particles that fly off the surface. Particles with radii between 2 cm and 1 m have been observed with OSIRIS photometry (Rotundi et al., 2015). The GIADA instrument (Colangeli et al., 2007) has detected compact (suggesting thermal processing) dust grains of sizes 100 m escaping the comet, but also fluffy, low density ( g cm-3) dust aggregates with radii 0.1-1 mm (Rotundi et al., 2015; Fulle et al., 2015). The COSIMA instrument (Kissel et al., 2007) collected dust aggregates onto plates to visually analyse their internal structure. The particles collected are porous aggregates that fragment easily upon collision (Schulz et al., 2015). Low collision speeds (1-10 m s-1) and the analysis of the collected aggregates (Hilchenbach et al., 2016) suggest that they are not composed of an ice-dust-mixture and originate from the ice-free surface layers of the comet. Skorov & Blum (2012) presented a comet model consisting of a top layer of ice-free dust aggregates residing on an interior mixture of ice and dust aggregates. Pebble-sized dust aggregates are needed to explain observed comet activity, as the tensile strength of a surface of m-sized dust is too high for water sublimation (Blum et al., 2014, 2015). Gundlach et al. (2015) applied the model to 67P and found that it can explain the release of observed cm-m-sized dust aggregates from the comet surface.
Massironi et al. (2015) found that 67P is likely a contact binary, inferred from the onion-like structure with shell surfaces centered on the center-of-mass of each separate lobe. Thus 67P may have originally been a binary cometesimal, as is commonly the result of the gravitational collapse model of Nesvorný et al. (2010), that later merged gently to a bimodal structure. Altogether, Rosetta and Philae observations of 67P are fully consistent with formation through slow gravitational contraction of a dense cloud of pebbles.
Observations of the comet 103P/Hartley 2 by the EPOXI spacecraft supports the theory of pebble-pile comets. The comet has, like 67P, a bimodal shape and a low density ( 0.22-0.88 g cm-3 depending on porosity and composition, A’Hearn et al., 2011). EPOXI also found large particles (cm-m) in the comet’s coma. Investigations by Kretke & Levison (2015), assuming formation through gravitational collapse, suggest that these particles could be primordial pebbles from which Hartley 2 was formed.
Pluto with its diameter of 2,400 km is an icy planetesimal on the extreme other end of the size range of Kuiper belt objects. The fly-by by New Horizons showed, surprisingly, that the surface of Pluto is young (Stern et al., 2015), indicating heating by either short-lived or long-lived radionuclides and recent interior restructuring. Other possible sources of heating (e.g. tidal effects) are, today, insignificant (Moore et al., 2015). New Horizons is now continuing its journey, through the Kuiper belt, towards the object 2014 MU69, a mid-sized Kuiper belt object (diameter 45 km) of the cold population (Porter et al., 2015). This object has an intermediate size between 67P and Pluto. Its size may be low enough to have avoided extensive particle fragmentation during the collapse (WJJ), in contrast to Pluto, and thus maintain its primordial structure the same way as 67P. The results from Lorek et al. (2016) predict that 2014 MU69 has a dust-to-ice ratio of 3-7 and constituent pebbles with a volume filling factor close to the maximum value of 0.4.
A major simplification in the work of WJJ was that pebble fragmentation during the collapse was always assumed to be the source of a cloud of m-sized monomer particles. In this paper we therefore expand the model for simulating the collapse of pebble clouds with a more realistic fragmentation model. The critical fragmentation speed and fragment size distribution are based on new experimental results presented in a companion paper (Bukhari Syed et al., 2016, hereafter Paper I). With this improvement we get more physically correct properties of the resulting planetesimals and can better compare the results with observations of e.g. the next target of New Horizons.
The paper is organized as follows. In Section 2 we summarize the model and numerical method used in WJJ. The implementation of the results of Paper I (the outcome of fragmenting collisions) is described in Section 2.3. The simulations of the collapse of clouds are presented in Section 3. In Section 4 we discuss the relevance of our results for the formation of planetesimals by hierarchical accumulation and the validity of neglecting gas drag in our simulations. A discussion of the results and a comparison with previous simulations are presented in Section 5, which is based upon the results of Paper I.
2. Model
A gravitationally bound cloud of pebbles can form e.g. through the streaming instability (Youdin & Goodman, 2005; Johansen et al., 2009; Bai & Stone, 2010). In such a cloud, pebbles move around and will eventually collide with each other. The collisions are inelastic, leading to loss of energy and contraction of the cloud. The negative heat capacity property of gravitationally bound systems causes the pebble collision rate (and energy dissipation rate) to increase thanks to the increase in relative speeds and particle density. The result is a runaway collapse, the gravothermal catastrophe. This formation process of planetesimals in protoplanetary disks was investigated with numerical simulations in WJJ. In this paper we expand the model to make it more physically realistic. The main change is the model of fragmenting collisions (discussed in Section 2.3).
2.1. Cloud model
We model the pebble cloud in the same way as WJJ with a homogeneous, spherical, non-rotating cloud of initially equal-sized pebbles. By doing this we can treat the cloud as an object characterised by a single single size that strives to get into virial equilibrium at all times. By keeping track of the kinetic and potential energy, the properties (density, collision speeds, free-fall speed, …) of the cloud can be calculated (knowing the initial values of these properties) with three parameters
| (1) | ||||
| (2) | ||||
| (3) |
Here is the total energy, is the potential energy, is the radius and is the kinetic energy of the cloud. The subscript 0 marks the value of the property for the initial cloud. After a collision the values of the parameters change: kinetic energy is dissipated, the cloud contracts, and kinetic energy is released (virialization) thanks to the negative heat capacity. The collapse time of a pebble cloud is short, less than a few orbital periods for planetesimals 1 km at a Pluto distance from the Sun (WJJ). The collapse time decreases with increasing planetesimal size and at some point a size is reached where the energy dissipation is so rapid that the cloud “wants” to collapse faster than free-fall. This situation is, of course, not physically possible and arises because it takes some time for the cloud to virialize after a pebble collision. To solve this we add the limitation that the cloud can never contract faster than free-fall. This in turn causes the energy release to slow down so that the pebbles achieve subvirial relative velocities, a situation we refer to as a “cold” collapse. Subvirial velocities, in turn, cause lower collision speeds so that a significant fraction of the pebbles will survive the collapse even in massive planetesimals (WJJ). As in WJJ, we assume that the individual pebble speeds follow a Maxwellian distribution with the average speed determined by the kinetic energy of the cloud. This is not completely correct since, with dissipative collisions, the pebbles in the cloud do not behave like an ideal gas.
2.2. Collisional outcomes
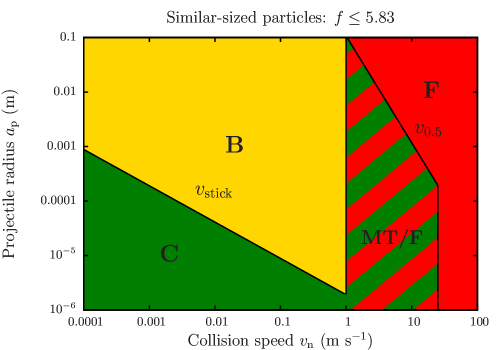
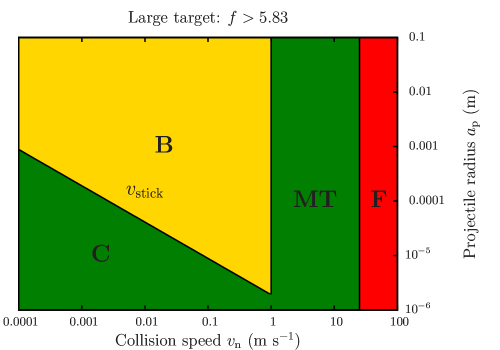
In our model the cloud collapses through energy loss in inelastic collisions between dust aggregates (pebbles). Depending on particle sizes and collision speed the outcome of a collision can vary. The collision speeds of dust aggregates inside the pebble clouds increase both as the cloud contracts and with increasing planetesimal mass. At a threshold planetesimal size ( km, WJJ, ) collisions start to result in fragmentation of the dust aggregates at some point in the collapse. For the result of a collision, in terms of its effect on the target particle, we combine the results from Paper I with the results of Güttler et al. (2010) to include a size distribution of fragments as well as an improved recipe for mass transfer in collisions. Collisions are not necessarily head-on which we correct for by using a randomised impact parameter to calculate the efficient collision speed. When determining the outcome of a collision we use the normal component of the relative velocity, . Table 1 shows the collision outcome for silicate dust aggregates as function of collision speed and relative particle size (target radius, , over projectile radius, ). For low collision speeds the collisions result in coagulation (Güttler et al., 2010), while higher collision speeds result in either bouncing, mass transfer or fragmentation. The sticking threshold speed can be written as,
| (4) |
where is the reduced mass of the particles, is the monomer radius and is the rolling force of the monomers111We use N for SiO2 spheres with m from Heim et al. (1999).. The catastrophic fragmentation speed , the collision speed required to halve the target, can be written as
| (5) |
where is the collision strength (Eq. 11) and is the relative particle size. Collisions are split into two types: two similar-sized particles colliding () or a small projectile hitting a large target (). The difference is that, in the case of a small projectile, mass transfer at higher collision speeds is more likely. In Table 1, MT/F expresses that collisions in this regime can result in both mass transfer and fragmentation, further discussed in Section 4.1 of Paper I. Another difference from the model used in WJJ is the value of the critical size ratio, . In WJJ a value of was used while here we use , as advocated in Paper I. A schematic map of collision outcomes in -space is shown in Fig. 1.
| C | C | |
|---|---|---|
| B | B | |
| MT/F | MT | |
| F | MT | |
| F | F |
To get the amount of energy, , dissipated in a collision we use the same equation as in WJJ
| (6) |
where is the coefficient of restitution of the collision. As in WJJ we assume that all kinetic energy in the normal direction of the relative velocity is dissipated, . This is, of course, not completely physical but since it is the square of that occurs in Eq. (6) the value of the coefficient of restitution needs to be relatively high to have a significant effect. Blum & Münch (1993) investigated the coefficient of restitution in collisions between silicate aggregates. The authors split the coefficient of restitution into the normal and the tangential component. From their experiments they find that the normal coefficient of restitution is small (-0.55). This means that even in grazing collisions, corresponding to high impact parameters, Eq. (6) can be used.
2.3. Dust aggregate mass transfer and fragmentation
The main difference between the simulations in this paper and the ones in WJJ is the treatment of mass transfer and fragmentation. In WJJ mass transfer could only occur in collisions with high mass ratio. Experimental results from Paper I show that it can happen for low as well (row three, column one in Table 1). Collisions between similar-sized particles in the velocity regime result in either fragmentation or mass transfer. The probability of both survival of the target and mass transfer is approximated as (Paper I)
| (9) |
More importantly, mass transfer is no longer 100% efficient but follows the experimental results. The mass transfer efficiency is a function of collision speed and particle sizes and generally lies in the range 10-30% (see Paper I, ).
In the simulations in WJJ we modeled fragmentation as erosion. The collision energy goes into removing monomers from the dust aggregate one by one. This results in a bimodal fragment size distribution with one large remnant and the rest of the mass in monomers (unless the collision energy is enough for complete fragmentation). For this paper, however, we use the results of laboratory experiments of collisions between silicate dust aggregates from Paper I, as described below for reference.
From Paper I the fragment size distribution can be split into two parts: the largest fragment and a continuous distribution of the remaining fragments. First we need to find the mass of the largest fragment, . Paper I finds that the mass of the largest fragment is a function of the collision energy, , and can be written as a Hill equation
| (10) |
where is the target mass, is the center-of-mass collision energy, is the energy required to halve the target (to get a largest fragment of half the mass of the initial target) and (see Paper I, ) is the Hill coefficient. This equation has an s-shape where marks the region where the curve drops and describe the steepness of the drop (steeper for higher ). For low collision energies , since the target “barely” fragments and for high collision energies most of the target is fragmented, .
The fragmentation energy has also been investigated in Paper I and found to be dependent on the size of the target and projectile
| (11) |
where is the fragmentation energy divided by the target mass, the target radius and the projectile radius.
Paper I finds that the cumulative number distribution of the fragments after a fragmenting collision fits very well with a power-law with an exponential cut-off (e.g. Fig. 14 in Paper I, )
| (12) |
where is the number of fragments with a projected area larger than , the exponent describing the power-law, the cut-off area and an exponent describing the steepness of the exponential cut-off. The value of is observed to be between 0.2 and 2 (e.g. Fig. 15 in Paper I, ) so we do two sets of simulations: one with and one with . In the simulations we are more interested in the distribution of the mass in fragments, not the number, and with Eq. (12) we can derive the cumulative mass distribution of the fragments. We use the variable where is the mass of a fragment with projected area and get
| (13) |
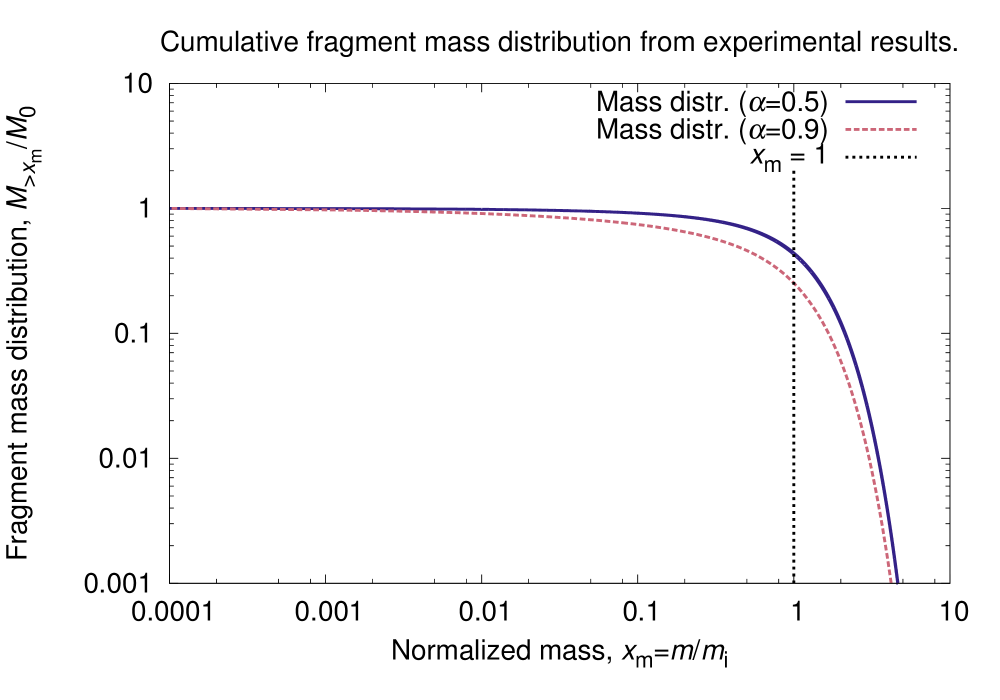
where is the total mass in fragments with masses larger than , is the total mass available in fragments and is a normalization constant for the integral. This integral is not analytically solvable and must be solved numerically. We generate arrays with elements on the curve of the solution to use in the simulations. The cut-off area (and hence as well) is a function of collision speed and projectile size (Eq. 21 and Fig. 16 in Paper I, ). However, by changing variables to we only need to solve the integral once (for each value of ) and can use the same solution throughout all simulations. We then only need to calculate after each fragmenting collision. Fig. 2 shows the solution of Eq. (13) for two different values of (0.5 and 0.9), which are investigated in the cloud collapse process in Section 3. The curves in Fig. 2 indicate that large fragments contain most of the total mass after a fragmenting collision. A more shallow slope in Eq. (12) results in even more of the mass in large fragments.
In the numerical model (a representative particle approach, described in Section 2.4) we only need one of the fragments from the mass weighted size distribution (Eq. 13). To select a particle after a fragmenting collision we use a random number, , uniformly distributed between 0 and 1. The largest fragment is not included in Eq. (13) and has to be treated separately. We first check if (the fraction of the total mass in the largest fragment); in that case the fragment mass is . Otherwise we solve Eq. (13) with our numerical recipe for using
| (14) |
and select as the fragment mass. The random number in Eq. (14), which is between and 1 in case the largest fragment was not selected, is now renormalized to be uniformly distributed between 0 and 1 in Eq. (14), since Eq. (13) is normalized to 1. We additionally impose that the second largest fragment has a maximum allowed mass of for and for . In case of mass transfer, the cut-off area, , has a different dependence on the collision speed and particle sizes (Figs. 16 and 17 in Paper I, ).
2.4. Numerical model
To be able to follow the collapse process we use, as in WJJ, a representative particle Monte Carlo model (Zsom & Dullemond, 2008; Ormel et al., 2007) that uses collision rates to find which particles collide and the time between collisions. The idea with this algorithm is to, out of the large number of physical particles, randomly select a smaller number, , of representative particles and follow the evolution of them. Each representative particle, , has its own properties (mass, velocity, …) which can change during the collapse. One can think of a representative particle as one particle in a swarm of identical physical particles. If a property of a representative particle changes, then the property changes for all particles in the swarm. The number of representative particles still needs to be large enough so that the distribution of properties matches the true distribution of properties. Most simulations in this paper are done with . The model is described in Zsom & Dullemond (2008) and the implementation for our simulations in WJJ.
3. Results
In our simulations we aim to investigate how the implementation of the fragmentation model from Paper I affects the results from WJJ. We are mainly interested in how the size distribution of particles inside the final planetesimal depends on planetesimal mass. The shape of the size distribution will in turn affect the packing efficiency and density of the planetesimal. We are also interested in exploring at what phases of the collapse different collisional outcomes occur. The collision speeds in a massive cloud are high, so fragmenting collisions will take place. However, at some point the energy dissipation is too fast for virialization and the particles will move with subvirial velocities. This means that in the end, collisions result in bouncing or coagulation instead of fragmentation, causing pebbles to survive the entire collapse even for massive planetesimals.
3.1. Initial conditions
We run our simulations with the model described in Section 2 (the same algorithm used in WJJ, with an updated fragmentation and mass transfer model, Section 2.3). Paper I finds a range of values on the slope, , of the fragment size distribution (Eq. 12) so we run two sets of simulations ( and ) to see the effect of on the result. The density of the dust aggregates is also updated. The experiments in Paper I use silicate dust aggregates with a filling factor , which decreases the density of the pebbles compared to previous simulations in WJJ. This affects the simulations in the sense that planetesimals of the same size now have a smaller mass. Looking at Appendix A in WJJ for the analytic derivation of the collapse time, we see that a smaller filling factor results in a shorter collapse time,
| (15) |
where is the radius of the pebbles. Lower mass also causes the collision speeds to be slower, so other results, e.g. the final mass fraction in pebbles, will be different. Otherwise we use the same initial conditions for the simulations as in WJJ, namely a homogeneous, spherical, non-rotating cloud of 1-cm-sized silicate pebbles. The initial size of a cloud is equal to the Hill radius of the mass of the cloud (at a distance from the Sun equal to the semi-major axis of the orbit of Pluto), causing the density (and hence the free-fall time of the cloud) to be independent of the cloud mass. We neglect any effect of surrounding gas on the collapsing cloud (the validity of this assumption is discussed in Section 4.2).
To further investigate how the fragmentation model affects the outcome of the collapse, we run three more sets of simulations. The first set of these additional simulations uses the new fragmentation model but with 100% mass transfer efficiency (denoted 100% MT). The second set uses the new model but with ice instead of silicate (denoted Ice). In this model and is increased with a factor 10 to simulate higher sticking capabilities (Gundlach & Blum, 2015; Lorek et al., 2016). Finally, we run the third set of additional simulations with the fragmentation model used in WJJ (denoted WJJ) where fragmenting collisions result in erosion and the production of a large remnant and a cloud of m-sized dust. In these simulations mass transfer with 100% efficiency can occur for high mass ratio collisions. The models are summarized in Table 2.
| Model | Description |
|---|---|
| Full model | The model described in Section 2 with |
| slope in the fragment size | |
| distribution (Eq. 12). | |
| Full model | The model described in Section 2 with |
| slope in the fragment size | |
| distribution (Eq. 12). | |
| 100% MT | The model described in Section 2 ( in |
| Eq. 12). Using 100% mass transfer efficiency | |
| in the model of Section 2.3. | |
| Ice | The model described in Section 2 ( in |
| Eq. 12). Simulating the better sticking | |
| capabilities of ice compared to silicates by | |
| increasing and with a factor 10 | |
| (Gundlach & Blum, 2015; Lorek et al., 2016). | |
| WJJ | Use of the fragmentation model in WJJ. |
| Fragmenting collisions result in a bimodal | |
| fragment size distribution: one large remnant | |
| and a cloud of monomers (erosion). Mass | |
| transfer is possible in collisions with high | |
| mass ratio. |
3.2. The interiors of planetesimals
We investigate the formation of planetesimals with solid radii between 10 and 1,000 km (up to a few 1,000 km for simulations with ice particles in order to have any fragmenting collisions at all). We omit simulations of smaller planetesimals in this paper, since the pebble collisions there will only result in bouncing. In our simulations we are interested in cloud collapses with fragmenting pebble-pebble collisions where the updated fragmentation model becomes important. An important result from WJJ, which we find in our new simulations as well, is that, for these planetesimal masses, the collision frequency is so high that the collapse is limited by the free-fall timescale of the pebble cloud. This causes the cloud to collapse cold and the particles inside the cloud to move with subvirial speeds.
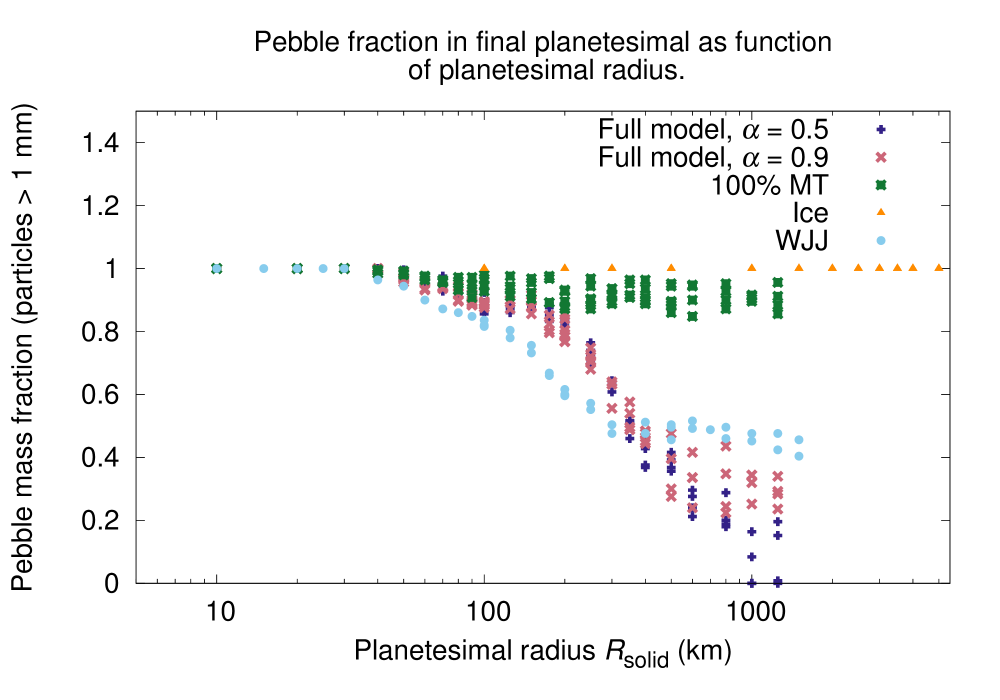
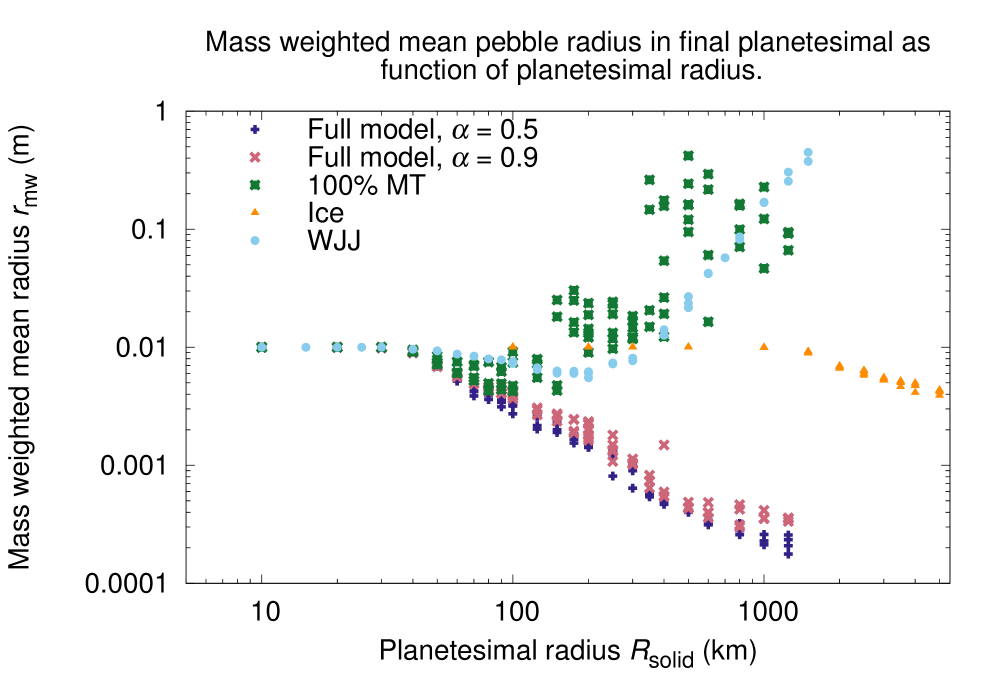
Fig. 3 shows the mass fraction of pebbles (particle radius 0.5 mm) in the left plot and the mass weighted mean particle size, , in the right plot for the five models as function of planetesimal radius, . The plots show that the choice of fragmentation model is very important and affects the outcome significantly. For the full model, both the pebble mass fraction and decrease with increasing . However, even massive planetesimals (up to Ceres-size) have a significant fraction of their mass in pebbles. Compared to the simulations with the WJJ-model, the decrease does not level out in the same way for massive planetesimals. An explanation for this is that with the new fragmentation model the collapse is not as cold as it used to be. The change to larger fragments leads to lower collision rates and less efficient energy dissipation. This way the cloud can get closer to virial equilibrium after each collision. The simulations show that the value of the slope of the fragment size distribution, , does not affect the outcome by a great amount. It is possible that for the most massive planetesimals more pebbles survive for higher . In the case of more mass is in small fragments after a fragmenting collision. This makes the energy dissipation more efficient, the collapse colder and collision speeds lower.
Both because of better sticking properties and lower material density of ice, a higher is required to have any fragmenting collisions at all when the silicate pebbles are exchanged for ice aggregates (Fig. 3). Depending on internal aggregate structure, they can survive collision speeds between 10 m s-1 (compact aggregates, Gundlach & Blum, 2015; Lorek et al., 2016) and 50 m s-1 (porous aggregates, Wada et al., 2009), further discussed in Section 4.1. The fragmentation in our Ice-model simulations (Table 2) starts at 1,000 km and even for a Mars-sized object ( 3,500 km) all particles in the cloud remain pebbles.
The only difference between the 100% MT-model and the full model is the efficiency of mass transfer. In 100% MT all the mass of the projectile particle is transferred while the full model follows the results of Paper I (an efficiency of order 10-30% and the rest of the mass in fragments). The difference in the outcome between the two models is very large. With complete mass transfer, the fraction of mass in pebbles stays around 0.9 even for 1,000 km-sized planetesimals compared to 0-0.4 in the full model. The right plot of Fig. 3 shows that the pebbles not only survive the collapse but also grow orders of magnitude in size with efficient mass transfer. One should note that, for these particle sizes, the outcome regions from Fig. 1 might no longer be valid. One reason for the difference is that, in the simulations, a lot of collisions happen in the region 1 m s (Fig. 5) where mass transfer is a possible outcome of a collision. In the full model, if mass transfer occurs between two equal-sized particles, only 55-65% of the total mass after the collision is in the large particle (10-30% mass transfer efficiency), while the rest is in small fragments. In the case of full mass transfer all the mass after the collision is in a merged particle. The particle growth is more efficient compared to the WJJ-model (where mass transfer also is 100% efficient), as well. This has several reasons. In the WJJ-model, two similar-sized particles cannot transfer mass but only grow in size through sticking at low collision speeds. Mass transfer can occur for higher mass ratios but then the relative mass increase () per collision is smaller (dust onto a pebble). The collapse process in the WJJ-model is also colder, small dust particles dissipate energy faster than larger pebbles. This results in lower particle speeds and mass transfer does not occur to the same degree (the 1 m s-criterion for mass transfer, Fig. 1).
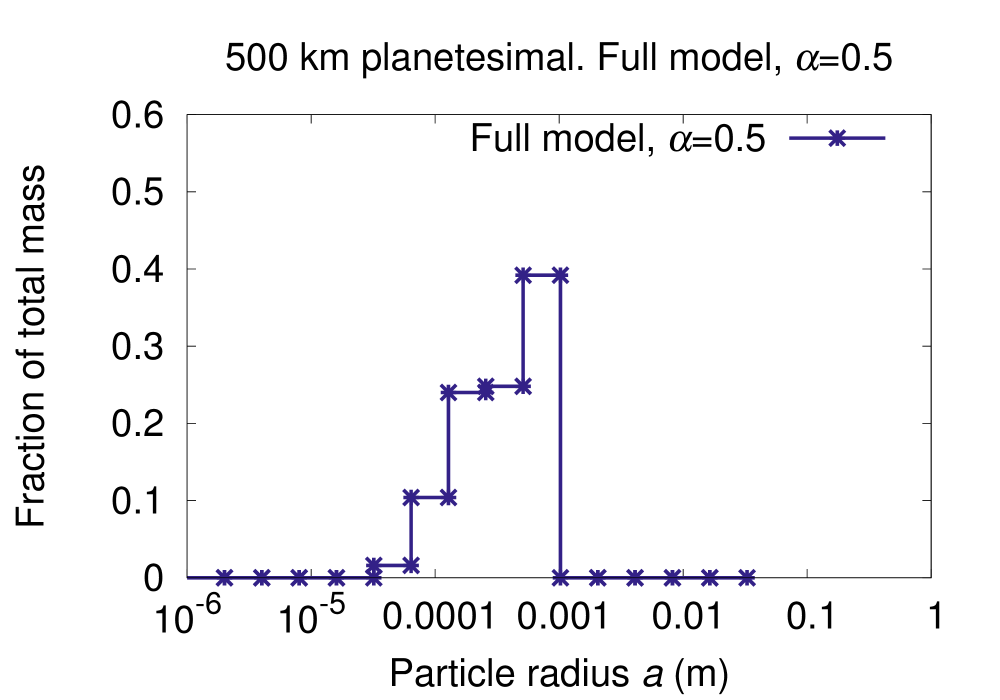
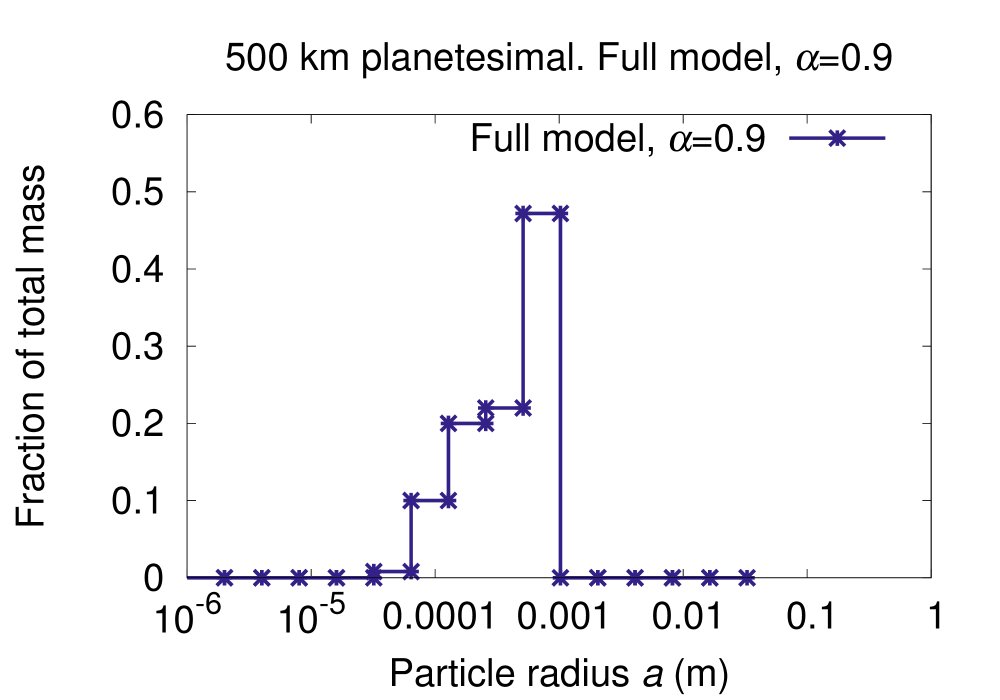
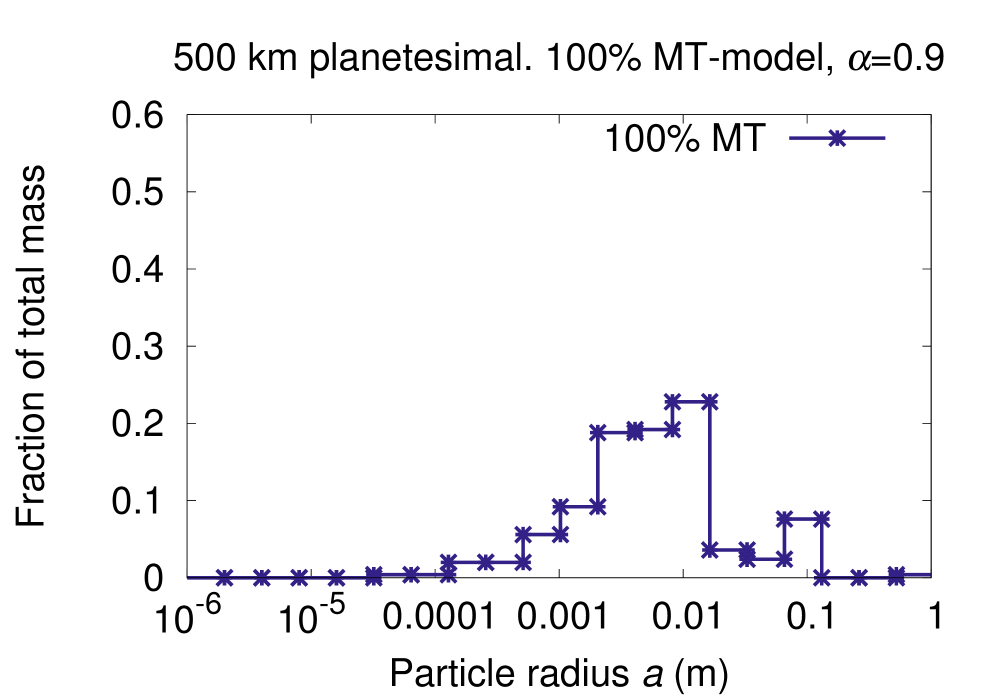
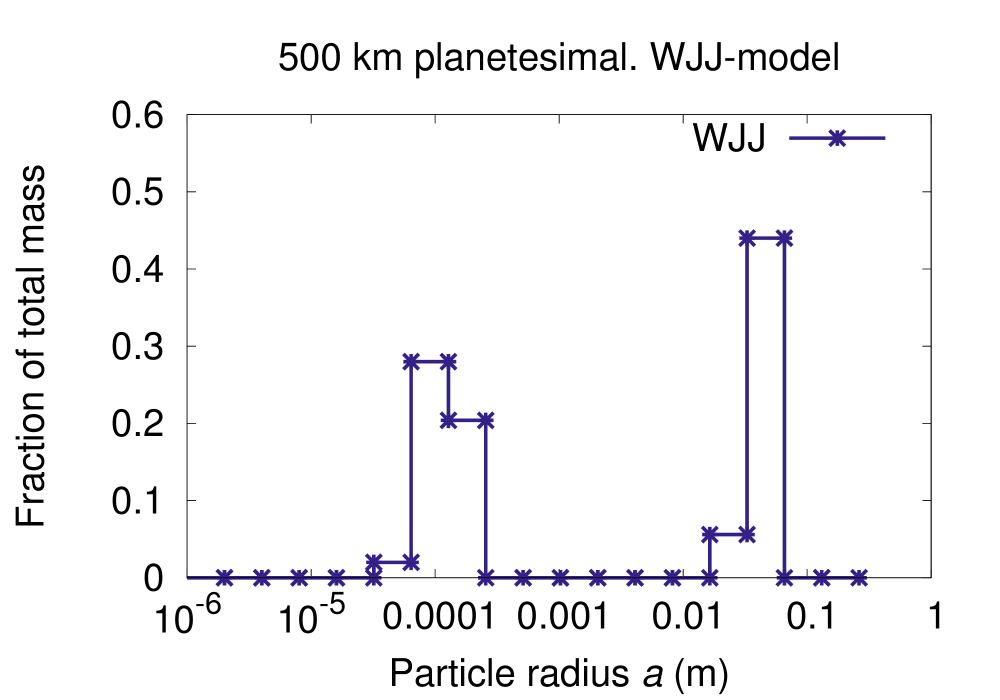
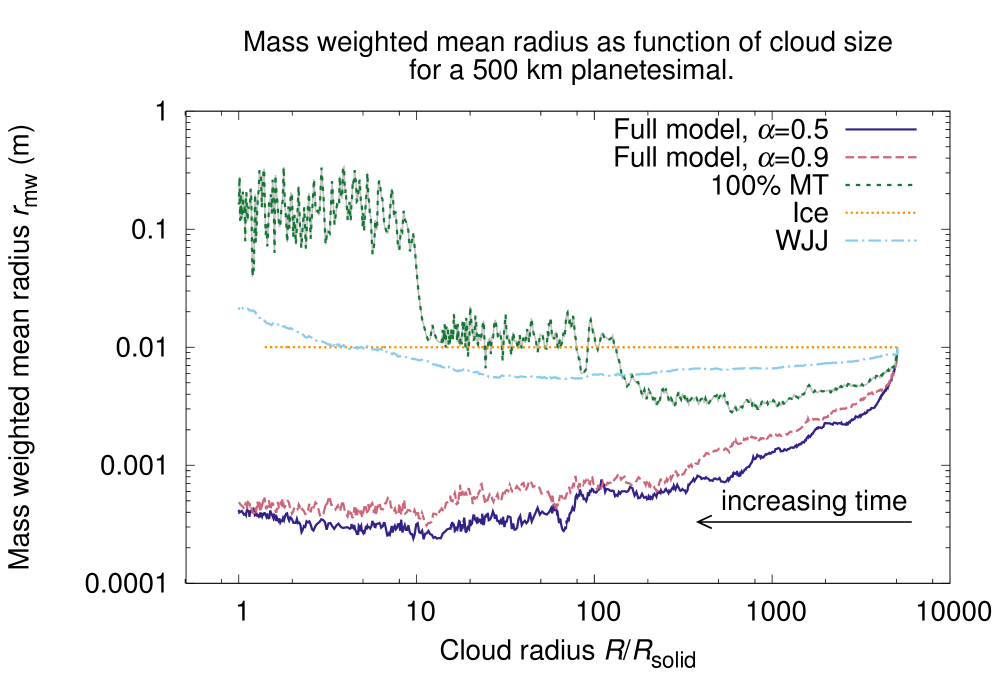
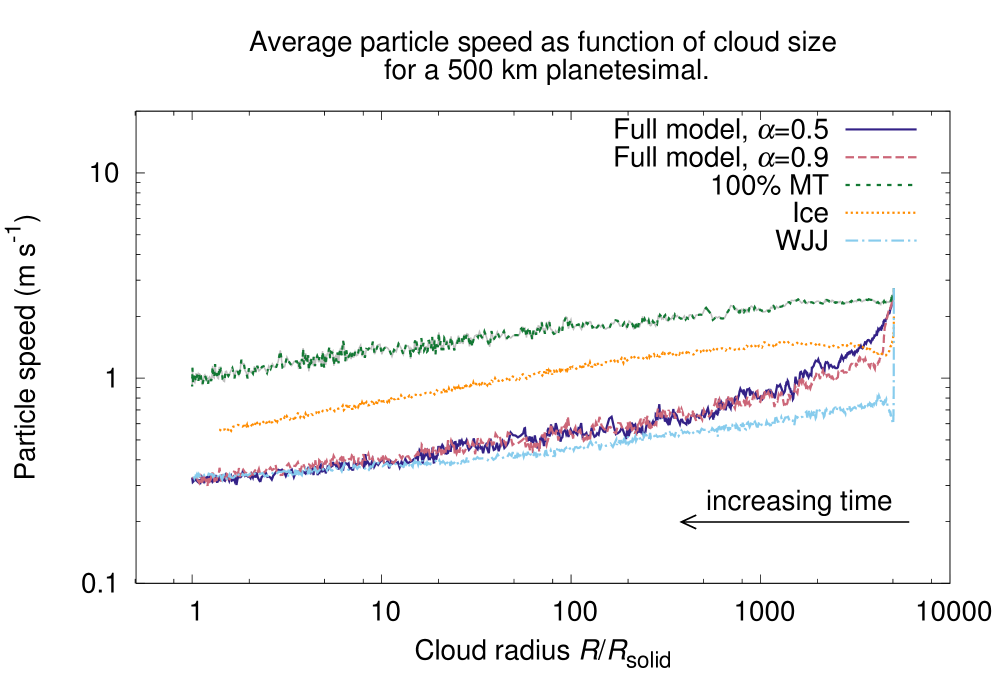
The energy dissipation efficiency in a collapsing pebble cloud is determined by particle sizes as well as cloud size. Fig. 4 and Fig. 5 presents the evolution of the mass weighted mean particle radius and average particle speed in the collapse of a km planetesimal with the different fragmentation models. As in Fig. 3, we find that the value of does not affect the collapse by a great deal. With 100% mass transfer efficiency, however, the difference becomes significant. By comparing Fig. 4 and Fig. 5, one finds that clouds with larger particles (100% MT-model) undergo a warmer collapse (higher collision speeds). Small particles have a higher energy dissipation rate thanks to high collision rates. Even if the average particle speeds in Fig. 5 are 1 m s-1, actual collision speeds can be 1 m s-1 (we assume a Maxwellian distribution for the particle speeds) leading to fragmentation or mass transfer (Fig. 1). This causes to change over time in Fig. 4. It increases for the 100% MT-model (higher collision speeds and efficient mass transfer) and gradually decreases with time for the full model. The WJJ-model initially has rapid fragmentation of a fraction of the pebbles into m-sized dust which has an extreme energy dissipation rate and fragmentation rapidly ceases. Fig. 6 compares the particle size distribution in the resulting 500 km-sized planetesimal for the different fragmentation models. The top two plots show the resulting size distribution for the full model with (left) and (right). Both models yield a planetesimal consisting of fragmented particles but a significant fraction of the mass in pebbles. Again, the difference between the two models is relatively small. The bottom left plot show the result of the 100% MT-model. During the collapse phase of this planetesimal particle collisions resulted both in fragmentation and efficient mass transfer resulting in a size distribution with larger particles than for the full model. The particle size distribution in the planetesimal for the WJJ-model is shown in the bottom right plot. In this model, fragmentation is modelled as erosion resulting in a bimodal fragment size distribution. In later stages of the collapse, the dust moves slow enough to stick (Fig. 5), grows orders of magnitude in size and there are no m-sized monomers in the final planetesimal. Some of the dust also sticks onto the primordial pebbles resulting in growth.
4. Discussion
4.1. Planetesimal formation through hierarchical coagulation
Gravitational collapse of dense pebble clouds is not the only method to form planetesimals. Another suggested planetesimal formation mechanism to overcome issues with bouncing (Zsom et al., 2010) and fragmentation (Brauer et al., 2008) is hierarchical coagulation. A few lucky particles survive in the protoplanetary disk and grow through mass transfer. Windmark et al. (2012) investigate the hierarchical coagulation process with numerical simulations of a few cm-sized seed particles in a protoplanetary disk with 100 m-sized particles. The authors find that, ignoring the effect of radial drift, 100 m-sized planetesimals can form at a distance of 3 AU from a Sun-like star in 1 Myr. At a Kuiper Belt distance from the star the timescale would be even longer (Johansen et al., 2014). Our updated mass transfer and fragmentation algorithms would be highly relevant to further investigate this scenario for planetesimal formation.
In the early stages of planetesimal formation, dust monomers coagulate in low-speed collisions. The low speeds reduce the compactification effect of such collisions and results in fluffy dust aggregates (e.g. Okuzumi et al., 2012). The high porosity of these aggregates increases the critical collision speed required for fragmentation. N-body simulations of collisions between fluffy ice aggregates with 0.1 m-sized monomers show that they survive collision speeds up to 50 m s-1 thanks to efficient energy dissipation and also have efficient mass transfer for high mass ratios (Wada et al., 2009, 2013). In the case of silicate dust aggregates, the critical velocity, as discussed earlier, is a factor 10 smaller (Gundlach & Blum, 2015; Lorek et al., 2016) but still larger than for similar-sized compact aggregates used in laboratory experiments (left plot in Fig. 1, but mind the difference in monomer size). Our numerical experiments with the collapse of clouds of icy pebbles show already that fragmentation is almost absent for all planetesimal sizes. In that case, gravity or internal heating would be needed to compactify the objects (e.g. Kataoka et al., 2013).
4.2. Effect of gas on the collapsing pebble cloud
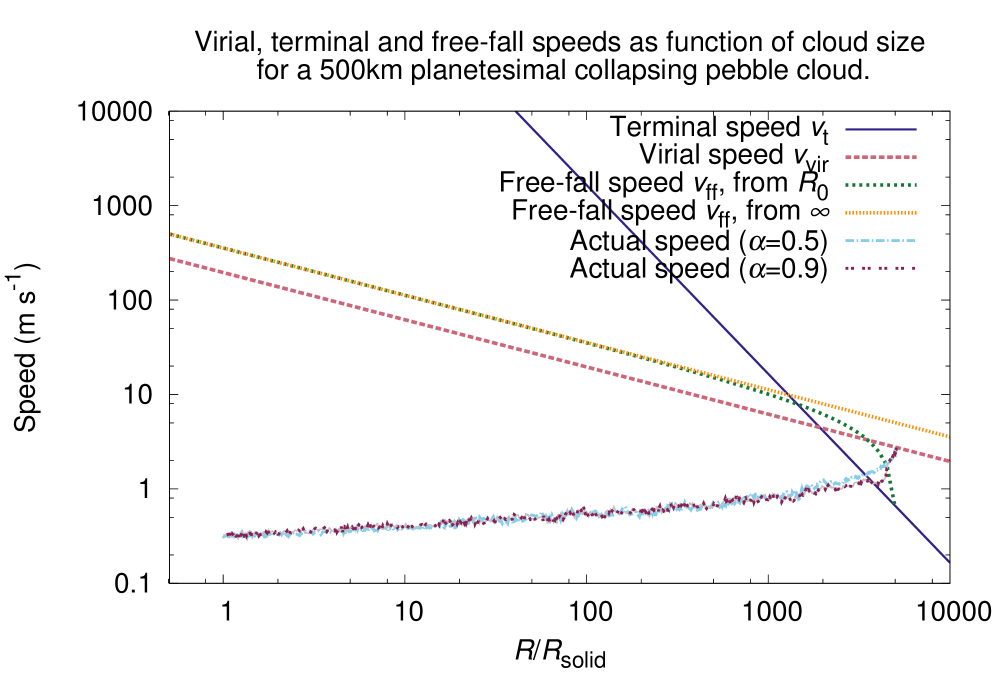
In our simulations we ignore the effect of surrounding gas on the collapse. This approximation needs to be validated. To investigate its validity, we can compare the speeds of the aggregates in the cloud with the terminal speed due to gas drag, . The typical speeds of an aggregate in the cloud can be compared to the virial speed, or the free-fall speed, , of the cloud. These can be written as
| (16) | ||||
| (17) | ||||
| (18) |
where is the friction time of the pebbles, is the mass of the planetesimal and is the radius of the cloud. All clouds start out having Roche density so which results in the initial value of both terminal and virial speed having the same scaling with planetesimal radius,
| (19) |
Pebbles of cm-sizes in the outer protoplanetary disk experience Epstein drag and we have , where is the pebble radius and is the orbital frequency (see Youdin, 2010). Using Eqs. (16)–(18) we find that
| (20) | ||||
| (21) | ||||
| (22) |
and see that at the start of the collapse so gas drag will play a role. The different scalings of the speeds with the cloud radius results in an increase in faster than and reducing the effect of gas. Using Eqs. (16)–(18) this transition occurs at 1,000-2,000 . In reality it would likely happen sooner the more massive the planetesimal is because the collapse is limited by free-fall causing sub-virial collision speeds (see Fig. 7). In the collapse of massive pebble clouds, fragmenting collisions will occur. Smaller particles have a lower terminal speed () and the effect of gas will be larger. We plan to include this effect in a future publication that allows different particle sizes to have different contraction speeds.
5. Conclusions
In this paper we have added the results of the silicate dust aggregate collision experiments from Bukhari Syed et al. (2016, Paper I) to the model of planetesimal formation in Wahlberg Jansson & Johansen (2014, WJJ). The planetesimals are assumed to form by the gravitational collapse of pebble overdensities in protoplanetary disks thanks to energy loss in inelastic collisions between the particles in the cloud. The new model has a more realistic treatment of fragmenting collisions and mass transfer, using the laboratory collision experiments in Paper I. To investigate the sensitivity to various aspects of the model, we run three sets of simulations using slightly modified fragmentation models (see Section 3.1).
As in WJJ the collapse times are short and decrease with increasing planetesimal mass. The collapse speed is, however, limited by free-fall and massive planetesimals ( km) all collapse, roughly, on the free-fall time (25 years). The free-fall limit causes massive clouds to undergo a cold collapse where particles move with speeds slower than virial equilibrium speed. Particle speeds decrease by collisional dampening as the collapse progresses (Fig. 5), causing pebbles to survive collisions even in massive pebble clouds (Fig. 3). In the new model, compared to WJJ, the primordial pebbles have a harder time to survive in the most massive planetesimals. In the left plot of Fig. 3 we see that, for the full model, a Pluto-sized planetesimal only has 0-20% of its mass in pebbles. In the WJJ-model the same planetesimal has 50% of the mass in particles with radii 0.5 mm. The main explanation for this is that in the WJJ-model fragmentation is modelled as erosion: a fragmenting collision results in a large remnant and cloud of small dust particles. In the new model, however, we have a continuous fragment size distribution (Eq. 13) and dust production is rare. Energy dissipation is more efficient with small particles (Appendix A in WJJ, ) so with the WJJ-model energy is dissipated faster, the collision speeds rapidly become subvirial and fewer fragmenting pebble-pebble collisions occur.
The experiments in Paper I find a wide range in steepness, , of the power-law describing the fragment size distribution (Eq. 12). To explore the sensitivity to , we made two sets of simulations for the full fragmentation model: one with a shallow slope (less mass in small fragments, ) and one with a steeper slope (more mass in small fragments, ). The plots in Fig. 3 show that the difference between the two sets is small compared to the differences to the other fragmentation models.
Fig. 3 also shows that modelling the mass transfer correctly is important. With efficient mass transfer (100% MT-model) pebbles not only survive the collapse to a larger degree (left plot) but also grow orders of magnitude in size (right plot). The difference between the 100% MT-model and the full model is that a collision with mass transfer (MT in Fig. 1) results in perfect merger, whereas only 10-30% of the projectile mass is transferred in the full model. In the collapse, many collisions occur in the velocity regime 1 m s (Fig. 5, Eq. 5) where mass transfer is possible for similar-sized particles (Fig. 1). In the full model such collisions result in a slightly larger target but most of the projectile mass in small fragments, while in the 100% MT-model the result is one merged target.
Our results confirm previous suggestions made in WJJ, that low-mass planetesimals (few tens of km or smaller) should consist mainly of primordial pebbles, be very porous and have low internal strength. More massive planetesimals consist of a mixture of pebbles and smaller particles. They would then have a better packing capability and be more dense, in agreement with the size-density correlation observed for Kuiper belt objects (Brown, 2013). Our results use the collision experiments with silicate dust aggregates from Paper I, while the outer regions of the Solar System contain a large fraction of ices. Our simulations in which we model the particles as ice change the outcome significantly, since ice particles survive much higher collision speeds. This result may nevertheless change with the inclusion of CO and CO2 ice, which have recently been shown to have equally poor sticking properties as silicates (Musiolik et al., 2016). Therefore our results obtained with silica particles could be a good proxy for the collapse of actual pebble clouds in the outer regions of protoplanetary disks.
References
- A’Hearn et al. (2011) A’Hearn, M. F., Belton, M. J. S., Delamere, W. A., et al. 2011, Science, 332, 1396
- Bai & Stone (2010) Bai, X.-N., & Stone, J. M. 2010, ApJ, 722, 1437
- Benecchi et al. (2009) Benecchi, S. D., Noll, K. S., Grundy, W. M., et al. 2009, Icarus, 200, 292
- Birnstiel et al. (2012) Birnstiel, T., Klahr, H., & Ercolano, B. 2012, A&A, 539, A148
- Blum et al. (2014) Blum, J., Gundlach, B., Mühle, S., & Trigo-Rodriguez, J. M. 2014, Icarus, 235, 156
- Blum et al. (2015) —. 2015, Icarus, 248, 135
- Blum & Münch (1993) Blum, J., & Münch, M. 1993, Icarus, 106, 151
- Blum & Wurm (2008) Blum, J., & Wurm, G. 2008, ARA&A, 46, 21
- Brauer et al. (2008) Brauer, F., Dullemond, C. P., & Henning, T. 2008, A&A, 480, 859
- Brown (2013) Brown, M. E. 2013, ApJ, 778, L34
- Bukhari Syed et al. (2016) Bukhari Syed, M., Blum, J., Wahlberg Jansson, K., & Johansen, A. 2016, ApJ (accepted for publication)
- Colangeli et al. (2007) Colangeli, L., Lopez-Moreno, J. J., Palumbo, P., et al. 2007, Space Sci. Rev., 128, 803
- Fulle et al. (2015) Fulle, M., Della Corte, V., Rotundi, A., et al. 2015, ApJ, 802, L12
- Goldreich et al. (2002) Goldreich, P., Lithwick, Y., & Sari, R. 2002, Nature, 420, 643
- Gundlach & Blum (2015) Gundlach, B., & Blum, J. 2015, ApJ, 798, 34
- Gundlach et al. (2015) Gundlach, B., Blum, J., Keller, H. U., & Skorov, Y. V. 2015, A&A, 583, A12
- Güttler et al. (2010) Güttler, C., Blum, J., Zsom, A., Ormel, C. W., & Dullemond, C. P. 2010, A&A, 513, A56
- Heim et al. (1999) Heim, L.-O., Blum, J., Preuss, M., & Butt, H.-J. 1999, Phys. Rev. Lett., 83, 3328
- Hilchenbach et al. (2016) Hilchenbach, M., Kissel, J., Langevin, Y., et al. 2016, ApJ, 816, L32
- Johansen et al. (2014) Johansen, A., Blum, J., Tanaka, H., et al. 2014, Protostars and Planets VI, 547
- Johansen et al. (2015) Johansen, A., Mac Low, M.-M., Lacerda, P., & Bizzarro, M. 2015, Science Advances, 1, 15109
- Johansen et al. (2009) Johansen, A., Youdin, A., & Mac Low, M.-M. 2009, ApJ, 704, L75
- Johansen et al. (2012) Johansen, A., Youdin, A. N., & Lithwick, Y. 2012, A&A, 537, A125
- Kataoka et al. (2013) Kataoka, A., Tanaka, H., Okuzumi, S., & Wada, K. 2013, A&A, 557, L4
- Keller et al. (2007) Keller, H. U., Barbieri, C., Lamy, P., et al. 2007, Space Sci. Rev., 128, 433
- Kissel et al. (2007) Kissel, J., Altwegg, K., Clark, B. C., et al. 2007, Space Sci. Rev., 128, 823
- Kofman et al. (2007) Kofman, W., Herique, A., Goutail, J.-P., et al. 2007, Space Sci. Rev., 128, 413
- Kofman et al. (2015) Kofman, W., Herique, A., Barbin, Y., et al. 2015, Science, 349, 020639
- Kretke & Levison (2015) Kretke, K. A., & Levison, H. F. 2015, Icarus, 262, 9
- Lambrechts & Johansen (2014) Lambrechts, M., & Johansen, A. 2014, A&A, 572, A107
- Lichtenberg et al. (2016) Lichtenberg, T., Golabek, G. J., Gerya, T. V., & Meyer, M. R. 2016, Icarus, 274, 350
- Lorek et al. (2016) Lorek, S., Gundlach, B., Lacerda, P., & Blum, J. 2016, A&A, 587, A128
- Massironi et al. (2015) Massironi, M., Simioni, E., Marzari, F., et al. 2015, Nature, 526, 402
- Moore et al. (2015) Moore, J. M., Howard, A. D., Schenk, P. M., et al. 2015, Icarus, 246, 65
- Mottola et al. (2015) Mottola, S., Arnold, G., Grothues, H.-G., et al. 2015, Science, 349, 020232
- Musiolik et al. (2016) Musiolik, G., Teiser, J., Jankowski, T., & Wurm, G. 2016, ApJ, 818, 16
- Nesvorný et al. (2010) Nesvorný, D., Youdin, A. N., & Richardson, D. C. 2010, AJ, 140, 785
- Noll et al. (2008) Noll, K. S., Grundy, W. M., Stephens, D. C., Levison, H. F., & Kern, S. D. 2008, Icarus, 194, 758
- Okuzumi et al. (2012) Okuzumi, S., Tanaka, H., Kobayashi, H., & Wada, K. 2012, ApJ, 752, 106
- Ormel et al. (2007) Ormel, C. W., Spaans, M., & Tielens, A. G. G. M. 2007, A&A, 461, 215
- Pätzold et al. (2016) Pätzold, M., Andert, T., Hahn, M., et al. 2016, Nature, 530, 63
- Porter et al. (2015) Porter, S. B., Parker, A. H., Buie, M., et al. 2015, in Lunar and Planetary Inst. Technical Report, Vol. 46, Lunar and Planetary Science Conference, 1301
- Rotundi et al. (2015) Rotundi, A., Sierks, H., Della Corte, V., et al. 2015, Science, 347, aaa3905
- Safronov (1969) Safronov, V. S. 1969, Evoliutsiia Doplanetnogo Oblaka (English transl.: Evolution of the Protoplanetary Cloud and Formation of Earth and the Planets, NASA Tech. Transl. F-677, Jerusalem: Israel Sci. Transl., 1972)
- Schulz et al. (2015) Schulz, R., Hilchenbach, M., Langevin, Y., et al. 2015, Nature, 518, 216
- Sierks et al. (2015) Sierks, H., Barbieri, C., Lamy, P. L., et al. 2015, Science, 347, aaa1044
- Simon et al. (2016) Simon, J. B., Armitage, P. J., Li, R., & Youdin, A. N. 2016, ApJ, 822, 55
- Skorov & Blum (2012) Skorov, Y., & Blum, J. 2012, Icarus, 221, 1
- Stern et al. (2015) Stern, S. A., Bagenal, F., Ennico, K., et al. 2015, Science, 350, aad1815
- Wada et al. (2013) Wada, K., Tanaka, H., Okuzumi, S., et al. 2013, A&A, 559, A62
- Wada et al. (2009) Wada, K., Tanaka, H., Suyama, T., Kimura, H., & Yamamoto, T. 2009, ApJ, 702, 1490
- Wahlberg Jansson & Johansen (2014) Wahlberg Jansson, K., & Johansen, A. 2014, A&A, 570, A47
- Windmark et al. (2012) Windmark, F., Birnstiel, T., Güttler, C., et al. 2012, A&A, 540, A73
- Youdin (2010) Youdin, A. N. 2010, in EAS Publications Series, Vol. 41, EAS Publications Series, ed. T. Montmerle, D. Ehrenreich, & A.-M. Lagrange, 187–207
- Youdin & Goodman (2005) Youdin, A. N., & Goodman, J. 2005, ApJ, 620, 459
- Zsom & Dullemond (2008) Zsom, A., & Dullemond, C. P. 2008, A&A, 489, 931
- Zsom et al. (2010) Zsom, A., Ormel, C. W., Güttler, C., Blum, J., & Dullemond, C. P. 2010, A&A, 513, A57