Multisource thermal model to the transverse momentum spectra in
collisions at RHIC and LHC energies
Bao-Chun Li1,2***Corresponding Author, E-mail: libc2010@163.com, Hai-Fu Zhao1, Fu-Hu Liu1,2, Xin-Jian Wen1,2 and Hong-Wei Dong1,2
1College of Physics and Electronics Engineering,
State Key Laboratory of Quantum Optics and Quantum Optics Devices,
Shanxi University, Taiyuan 030006, China
2Collaborative
Innovation Center of Extreme Optics, Shanxi University, Taiyuan
030006, China
Abstract
In this paper, an improved multi-source thermal model is used to
analyze the transverse momentum spectra in collisions at high
energies ranging from = 62.4 GeV to 7
TeV. We give a detailed comparison between the theoretical results
and experimental data at RHIC and LHC energies. It is shown that the
excitation factors of emission sources depend linearly on
ln in the framework. Based on the
variation regularity of the source-excitation factors, transverse
momentum spectra are predicted in collisions at higher
energies, potential future colliders operating at
= 33 and 100 TeV.
PACS number(s): 13.85.-t, 14.40.-n, 12.40.Ee
Keywords: Transverse momentum spectra, High-energy collisions,
Multi-source thermal model
1 Introduction
Inclusive measurements of charged-particle spectra in collisions can provide an insight into the strong interaction in low-energy, non-perturbative region of Quantum Chromodynamics (QCD) [1]. Investigations of the charged-particle production are refining the understanding of global properties of collisions at the LHC. As the collision energy increases, a much broader and deeper study of QGP will be done at the LHC. It leads to a significant extension of the kinematic range in longitudinal rapidity and transverse momentum. And, the charged-particle distribution is very helpful in understanding the basic production mechanism of hadrons produced in nucleon-nucleon and nucleus-nucleus collision experiments. Transverse momentum spectra of the particles play an important role in the observation of high-energy collisions. The spectra can provide insight into particle production as well as matter evolution in or collisions at RHIC and LHC energies [2].
At one of the later stages in collisions, the system will be dominated by hadronic resonances. At the last stage of high-energy collisions, the interacting system at the kinetic freeze-out stays at a thermodynamic equilibrium state or local equilibrium state. The particle emission process is influenced by not only the thermal motion but also the collective flow. Considering the creation and subsequent decay of hadronic resonances produced in chemical equilibrium at unique temperature and baryon chemical potential, thermal-statistical models have given a consistent description of particle production in heavy-ion collisions at high energies during the past two decades. The identifying feature of the thermal model is that all the resonances as listed by the Particle Data Group are assumed to be in thermal and chemical equilibrium [3]. Statistical thermal models have successfully described the particle abundances at low [4, 5, 6].
In recent years, some phenomenological models or (semi-) empirical formulas of particle distributions have been reported to explain the experimental data of the (or ) spectra in and collisions, up to LHC energies. It is interesting to note that various exponential functions in the distribution descriptions were adopted [7], such as exponential distribution , exponential or Gaussian and exponential distribution , exponential distribution , Boltzmann distribution and Bose-Einstein distribution .
In this work, combined with the exponential functions, we improve a multi-source thermal model by considering the rapidity shifts of longitudinal sources along the rapidity axis. The improved model is used to analyze the transverse momentum spectra in collisions at RHIC and LHC energies.
2 The description model
In order to understand the particle spectra observed in multiparticle production processes, Hagedorn proposed a statistical description [8], where the transverse momentum spectra follow a thermalized Boltzmann type of distribution
| (1) |
where the denotes the mean transverse momentum averaged over all events in the event sample. It is an exponential function and can only fit the experimental data in a limited range of transverse mass, GeV [9]. But, a width of the rapidity (or pseudorapidity) distribution of corresponding particles is not considered for the distribution function. In order to be consistent with experimental data, the pseudorapidity interval integral has been added,
| (2) |
where
| (3) |
The rapidity is a function of and
| (4) |
Then, we resolve the issue by a multisource thermal model. According to the geometrical picture of high-energy collisions, the thermalized cylinder model [10] and the relativistic diffusion model [11], particle emission sources located in the projectile and target cylinders are formed in collisions. At intermediate energy, the two cylinders overlap totally and are regarded as a single cylinder. At high energy, the two cylinders overlap partly. At ultra-high energy, the two cylinders are completely separate, resulting in a gap between them. In the rapidity space, the projectile cylinder and the target cylinder lie in the rapidity ranges and , respectively. The center rapidity of the interacting system is denoted by (or ). So, the rapidity distribution of particles produced in the collision is given by
| (5) |
where is the rapidity distribution of particles emitted from a source at . In terms of the description of the transverse momentum and the transverse mass distributions, we need to consider the longitudinal rapidity of the emission source in the cylinder(s). These sources with different rapidity shifts in the rapidity space located nonuniformly in the rapidity region. In order to deal conveniently with the relation between the sources and particles, the sources can be divided into groups in accordance with the longitudinal locations. Due to different interaction mechanisms or event samples, the source number in the th group is assumed to be . Identified fragments or particles emit isotropically from different emission points (also known as sources) formed in the high-energy collisions. The transverse momentum spectrum contributed by the th source in the th group is an exponential distribution
| (6) |
where a source-excitation factor
| (7) |
is the mean value of the transverse momentum of particles which come from the given source in the group. In the same group, we have
| (8) |
By computing the convolution of the exponential function Eq. (1), the transverse momentum distribution contributed by the th group is
| (9) |
It is an Erlang distribution. The transverse momentum distribution is
| (10) |
which is known as a multi-component Erlang distribution. The is the share of the th group. In the improved model, the rapidity cut is naturally and consistently taken into account. To simplify the calculation, the Monte Carlo method is used to obtain the transverse momentum spectrum. With Eq. (1), the transverse momentum is
| (11) |
where is a random number in [0, 1].
3 Results and Discussion
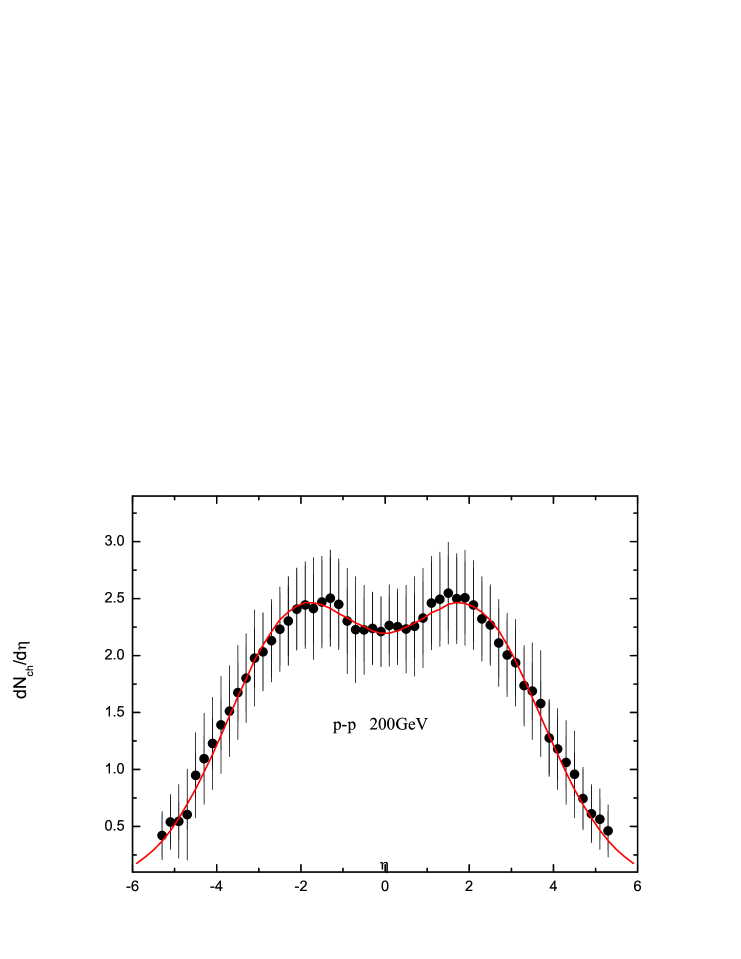
In order to identify the validity of the distribution function, Eq. (5), figure 2 give pseudorapidity distributions of charged particles produced in collisions at =200 GeV. Filled circles represent experimental data measured by the PHOBOS Collaboration [12]. The theoretical result is presented by a curve. The per number of degrees of freedom (/ndf) testing provides statistical indication of the most probable value of corresponding parameters. We see that the calculated results agree with the experimental data.
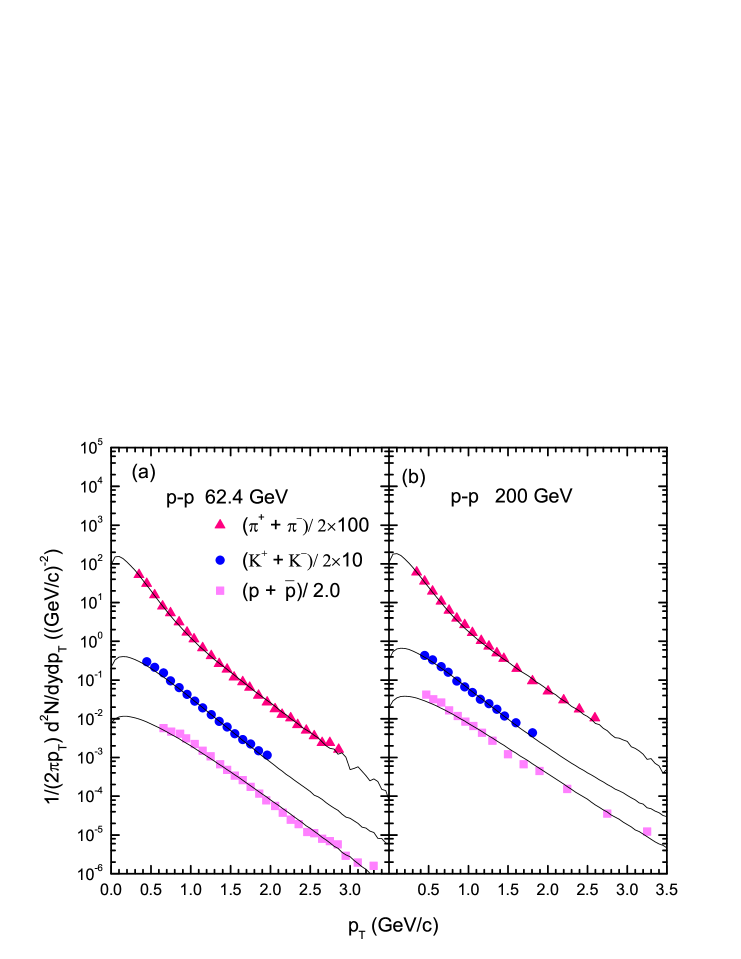
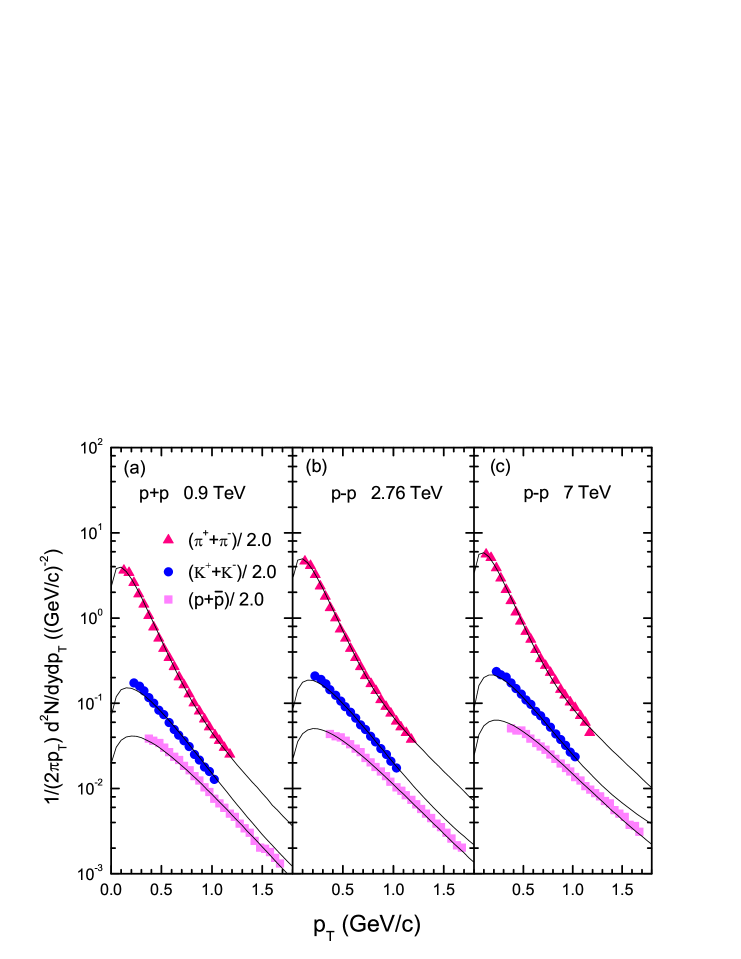
Figure 2 shows the transverse momentum spectra of identified charged hadrons (pion, kaon, proton) in collisions at = 62.4 GeV and 200 GeV. The scattered symbols present the experimental data from the PHENIX Collaboration [13, 14, 15] and the STAR Collaboration [16, 17]. The solid lines present the model results. Our results for spectra are in good agreement with the experimental data. The maximum /ndf value is 1.15 and the minimum /ndf value is 0.08. Figure 3 shows the transverse momentum spectra of identified charged hadrons (pion, kaon, proton) in collisions in the range , at = 0.9, 2.76 and 7 TeV. The scattered symbols present the experimental data from the CMS Collaboration [18]. The solid lines present the model results, which are in good agreement with the experimental data. The maximum value of /ndf is 1.04 and the minimum value is 0.10.
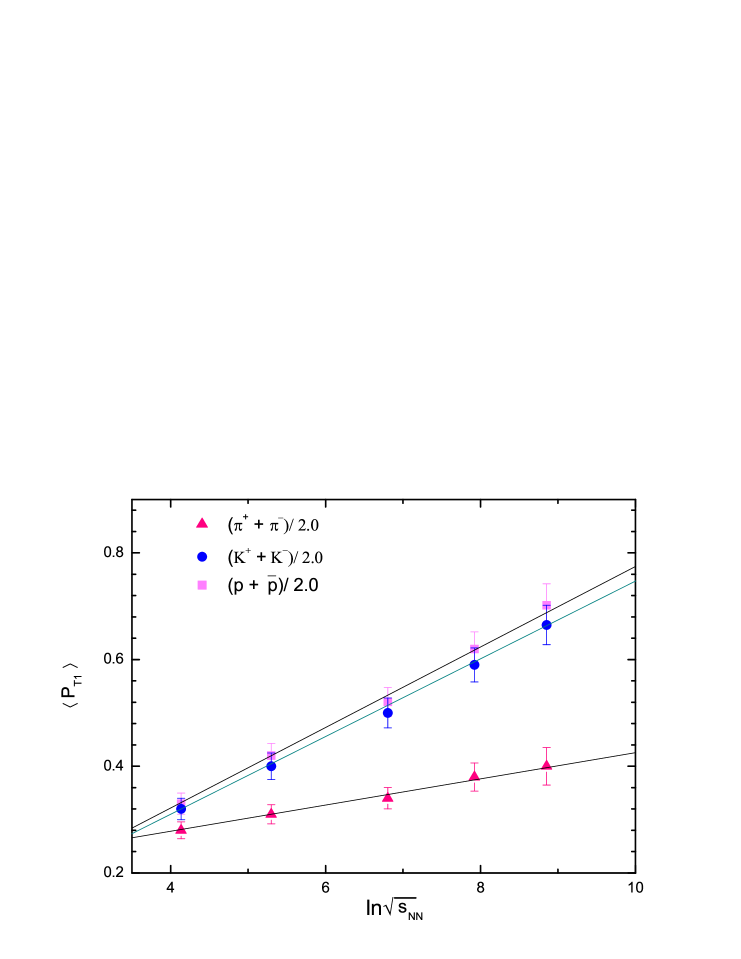
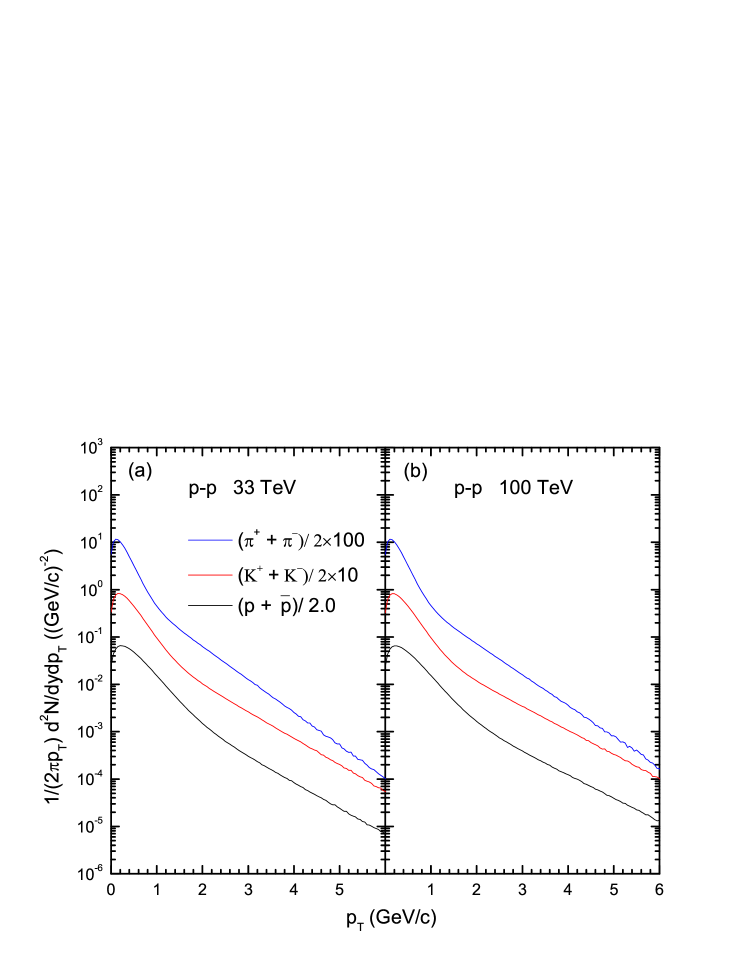
According to the pseudorapidity distributions, the sources may be divided into two groups . The parameter values are obtained by fitting the experimental data. In the calculations, we take one source in the first group and two sources in the second group . For pions, kaons and protons, the mean in the second group are fixed, i.e., 0.11 GeV/c, 0.20 GeV/c and 0.26 GeV/c, respectively. As can be seen in Fig. 4, the mean of the first group varies regularly with ln, ln, ln and ln for pions, kaons and protons, respectively. Based on the linear functions, we can predict the taken in the model for collisions at higher energies. When is increased to 33 and 100 TeV, the values for pions, kaons and protons are taken to be 0.4354 and 0.4626, 0.7766 and 0.8574, 0.8051 and 0.8887, respectively. The prediction of the transverse momentum spectra of pions, kaons and protons are given in Fig. 5.
4 Conclusions
Final-state particles produced in high energy collisions have attracted much attention, since attempt have been made to understand the properties of strongly coupled QGP by studying the possible production mechanisms. Many exponential distributions are suggested in description of the final-state particle distribution. Thermal statistical models have been successful in describing particle production in various systems at different energies [19, 20]. In our previous work [21], to extract the chemical potentials of quarks from ratios of negatively/positively charged particles, we have analyzed the transverse momentum spectrums of the CMS and ALICE Collaborations by using the Tsallis distribution. The results in low transverse momentum region in the present work is better than those in our previous work. Based on different formula on transverse momentum spectrum in the model, the dependences of transverse momentum, centrality and participant nucleon number on elliptic flow in GeV and TeV energy regions have been studied in our previous works [22, 23]. Comparing the non-equilibrium statistical relativistic diffusion model with three sources, which include a central source and two fragmentation sources [11, 24], the multisource thermal model uses two cylindrical sources to describe the rapidity or pseudorapidity distributions. In the present work, we embed the exponential distribution into the geometrical picture of the multisource thermal model to describe the transverse momentum spectra in collisions at RHIC and LHC energies. In the rapidity space, final-state particles emit from the sources, which are at different locations due to stronger longitudinal flow [25, 26, 27]. The improved multisource thermal model can reproduce the experimental results of pions, kaons and protons. The rapidity width is naturally taken into account by the source distribution. By analysing systematically the corresponding pseudorapidity distributions and fitting the experimental data, the model parameters are fixed. The is a function of ln, other parameters are constant values.
Summarizing up, the transverse momentum distributions of pions, kaons and protons produced in collisions at RHIC and LHC energies have been studied systematically in the improved multisource thermal model, which can reproduce spectra. Our investigations indicate the improved model is successful in the description of hadron productions. At the same time, it is found that the free parameter used in the calculations exhibits linear dependences on ln. According to the parameter change pattern, we give the model predictions of the transverse momentum spectra of pions, kaons and protons produced at potential future colliders operating at = 33 and 100 TeV. With more accumulated data or higher expected energy scale, the high-luminosity LHC and the next-generation colliders offer great opportunities for the search for physics up to and beyond TeV scale.
Acknowledgments
This work is supported by National Natural Science Foundation of China under Grants No. 11247250 and No. 11575103, Shanxi Provincial Natural Science Foundation under Grant No. 201701D121005, and Scientific and Technological Innovation Programs of Higher Education Institutions in Shanxi (STIP) Grant No. 201802017.
References
- [1] G Aad et al. [ATLAS Collaboration] Phys. Lett. B 758 67 (2016).
- [2] A N Mishra, P Sahoo, P Pareek, N K Behera, R Sahoo and B. K. Nandi arXiv:1505.00700 [hep-ph].
- [3] J Cleymans, B Hippolyte, H Oeschler, K Redlich and N Sharma arXiv:1603.09553 [hep-ph].
- [4] F Becattini, J Cleymans, A Keranen, E Suhonen and K Redlich Phys. Rev. C 64 024901 (2001).
- [5] W Broniowski and W Florkowski hep-ph/0202059.
- [6] W Broniowski, A Baran and W Florkowski Acta Phys. Polon. B 33 4235 (2002).
- [7] B I Abelev et al. [STAR Collaboration] Phys. Rev. C 79 034909 (2009).
- [8] R Hagedorn Nuovo Cim. Suppl. 3 147 (1965).
- [9] N Abgrall et al. [NA61/SHINE Collaboration] Eur. Phys. J. C 74 2794 (2014).
- [10] F H Liu Phys. Rev. C 66 047902 (2002).
- [11] G Wolschin Europhys. Lett. 95 61001 (2011).
- [12] B. Alver et al. [PHOBOS Collaboration], Phys. Rev. C 83, 024913 (2011).
- [13] A Adare et al. [PHENIX Collaboration] Phys. Rev. C 83 064903 (2011).
- [14] A Adare et al. [PHENIX Collaboration] Phys. Rev. D 79 012003 (2009).
- [15] A Adare et al. [PHENIX Collaboration] Phys. Rev. D 83 052004 (2011).
- [16] B I Abelev et al. [STAR Collaboration] Phys. Rev. C 75 064901 (2007).
- [17] J Adams et al. [STAR Collaboration] Phys. Lett. B 637 161 (2006).
- [18] S Chatrchyan et al. [CMS Collaboration] Eur. Phys. J. C 72 2164 (2012).
- [19] S K Tiwari and C P Singh Adv. High Energy Phys. 2013 805413 (2013)
- [20] H Z Huang J. Phys. G 30 S401 (2004).
- [21] F H Liu, T Tian, H Zhao and B C Li Eur. Phys. J. A 50 62 (2014).
- [22] E Q Wang, H R Wei, B C Li and F H Liu Phys. Rev. C 83 034906 (2011).
- [23] B C Li, Y Y Fu, L L Wang, F H Liu Adv. High Energy Phys. 2013, 908046 (2013).
- [24] G Wolschin J. Phys. G 40 045104 (2013).
- [25] P Braun-Munzinger, J Stachel, J P Wessels and N Xu Phys. Lett. B 344 43 (1995).
- [26] P Braun-Munzinger, J Stachel, J P Wessels and N Xu Phys. Lett. B 365 1 (1996).
- [27] S Q Feng and Y Zhong Phys. Rev. C 83 034908 (2011).