A transportable optical lattice clock with uncertainty
Abstract
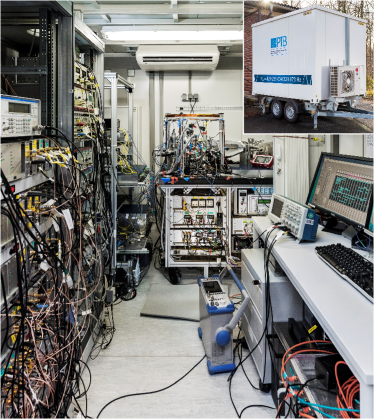
We present a transportable optical clock (TOC) with 87Sr. Its complete characterization against a stationary lattice clock resulted in a systematic uncertainty of which is currently limited by the statistics of the determination of the residual lattice light shift. The measurements confirm that the systematic uncertainty is reduceable to below the design goal of . The instability of our TOC is . Both, the systematic uncertainty and the instability are to our best knowledge currently the best achieved with any type of transportable clock. For autonomous operation the TOC is installed in an air-conditioned car-trailer. It is suitable for chronometric leveling with sub-meter resolution as well as intercontinental cross-linking of optical clocks, which is essential for a redefiniton of the SI second. In addition, the TOC will be used for high precision experiments for fundamental science that are commonly tied to precise frequency measurements and it is a first step to space borne optical clocks.
The best clocks in the world reach a fractional systematic uncertainty at the low level Nicholson et al. (2015); Ushijima et al. (2015); Huntemann et al. (2016); Schulte et al. (2016) and instabilities near or even below Schulte et al. (2016); Ushijima et al. (2015); Al-Masoudi et al. (2015); Nicholson et al. (2015); Hinkley et al. (2013), surpassing the clocks realizing the SI second in both by two orders of magnitude. This has triggered a discussion about a redefinition of the SI second Riehle (2015); Margolis (2014), pushes the frontiers of precision spectroscopy and tests fundamental physics Nemitz et al. (2016); Grebing et al. (2016); Le Targat et al. (2013); Huntemann et al. (2014); Godun et al. (2014); Fortier et al. (2007), and enables chronometric leveling Vermeer (1983); Bjerhammar (1985, 1986); Lisdat et al. (2016); Takano et al. (2016), where gravitational redshifts are exploited to measure height differences.
So far, the operation of optical clocks has been constrained to laboratories. However, transportable clocks are required for the necessary flexibility in the choice of measurement sites for applications like chronometric leveling. Also, they are highly interesting for frequency metrology and time keeping in creating a consistent worldwide network of the next-generation ultraprecise clocks. Although comparisons at the full performance level of state-of-the-art optical clocks are possible on a continental scale Lisdat et al. (2016); Takano et al. (2016) through a few specialized optical fiber links Predehl et al. (2012); Raupach et al. (2015); Chiodo et al. (2015), intercontinental links are so far restricted to satellite-based methods that cannot fully exploit the clock performance Hachisu et al. (2014). A transfer standard enables world-wide interconnections between optical clocks and will thus benefit the efforts towards a redefinition of the SI second.
Making laboratory setups compact and robust for transport is also the first step towards granting a wide community of users access to these devices Niering et al. (2000); Fischer et al. (2004); Parthey et al. (2011). Furthermore, transportability is a first step towards applications of optical clocks in space. Developments in these directions are ongoing for optical lattice clocks (OLCs) with strontium Bongs et al. (2015); Poli et al. (2014); however, to our knowledge the single-ion clock reported recently Cao et al. (2016) is the only other transportable clock with uncertainty below .
The requirements on such a TOC are challenging indeed: To enable comparisons of other optical clocks it has to achieve uncertainties similar to those of the clocks to be tested or at least considerably better than what can be reached by comparing to primary cesium clocks Grebing et al. (2016); Lodewyck et al. (2016); Falke et al. (2014); Le Targat et al. (2013). Further, for geodetic applications, i.e., chronometric leveling, a resolution of below ten centimeters is required to compete with established methods that connect sites separated by a few hundreds of kilometers. This means that fractional gravitational red shifts of and below must be resolved by the TOC. Preferably, the frequency instability should be in the range of typical optical clocks to enable reasonably short measurement times.
These requirements are considerably beyond the properties achieved with the best transportable microwave clock Bize et al. (2004). For this atomic cesium fountain clock an uncertainty of Abgrall (2012) and an instability of Guéna et al. (2012) have been reported and exploited in several campaigns Niering et al. (2000); Fischer et al. (2004); Parthey et al. (2011). The -ion clock reported in Cao et al. (2016) reaches an uncertainty of and an instability of , but has not left the laboratory yet. Here we present a transportable OLC that is characterized and compared to an established, stationary optical frequency standard Falke et al. (2014); Al-Masoudi et al. (2015); Grebing et al. (2016); Lisdat et al. (2016) and tested outside the laboratory in a transportable car-trailer (Fig. 1).
This clock uses the transition in at 698 nm as reference transition, which is interrogated in atoms laser-cooled into and confined in a one-dimensional optical lattice. The OLC comprises four main parts: The physics package, where the atoms are prepared and the reference transition is interrogated; the laser systems for laser cooling, state preparation, and trapping; a highly frequency-stable interrogation laser system; and the computer control to generate the experimental sequence and feedback to the interrogation laser frequency. For a TOC it is essential that these parts are compact in size and robust in construction to provide fast and reliable measurements at different locations.
Our cooling and preparation laser systems use commercial diode lasers integrated into five compact breadboards with half-inch optics Vogt (2015); Vogt et al. (2016). These breadboards contain acousto-optical modulators (AOMs) and optical shutters for light switching and frequency modulation. They are connected to the physics package with polarization maintaining fibers. The boards have a size of 30 cm 45 cm 6 cm and a mass of less than 8 kg each. Since we do not aim for extreme compactness, we still use standard control electronics.
Similarly, the compact physics package is mounted on a 120 cm 90 cm optical breadboard, which has not been miniaturized to avoid trade-offs with the clock performance. The Zeeman slower for efficiently loading atoms into a magneto-optical trap (MOT) is based on permanent magnets to avoid heat load from a solenoid near the interrogation region of the atoms Vogt et al. (2016). Given the small volume available for a transportable setup, this helps preventing thermal inhomogeneity of the environment of the atoms as the blackbody radiation (BBR) shift is typically the largest source of uncertainty in Sr OLCs that are operated in a room-temperature environment Nicholson et al. (2015); Bloom et al. (2014). The physics package and laser-systems have been tested successfully in the car-trailer, achieving similar atom numbers and temperatures as in the laboratory.
The reference cavity to pre-stabilize the frequency of the interrogation laser is a highly critical part of the TOC. Rigid mounting Häfner (2015); Sterr (2011) is employed in our reference cavity, assembly as standard soft supports (e.g. Häfner et al. (2015)) would not withstand transport. This laser system is a further development of an earlier cavity-stabilized laser system Vogt et al. (2011) and reaches a frequency instability flicker floor of about after 10 s. For best performance in a measurement the 12 cm long reference cavity and the interrogation laser are placed outside the transport container in a seismically quieter environment.
The measurement sequence is comparable to other OLCs. Typically, the cycle time is 900 ms with a duty factor of 0.16: A rotary atom shutter is used to shield the atoms during the interrogation from the BBR of the oven at 500 ∘C loading the MOT. Opening the shutter takes 10 ms. However, we wait for additional 90 ms which increases the stability of the atom number in the lattice. The first MOT loading stage (300 ms) on the 461 nm transition is followed by a second cooling stage using the 689 nm transition, which is split into a broadband red MOT (80 ms) and a single-frequency MOT (80 ms), during which the optical lattice is loaded. The lattice is tilted by approximately 50∘ against gravity and operated at the Stark shift cancellation wavelength near 813 nm Katori (2002). The full trap depth is typically about 80 , where is the lattice photon recoil energy. The atoms trapped in the lattice are spin-polarized alternatingly to one of the stretched state () of the ground state manifold (30 ms). To remove the atoms in other Zeeman levels (clean-up), a -pulse is driving the atoms in the chosen Zeeman state on a resonant -transition in a magnetic field of about 1.9 mT to the state (30 ms). Atoms remaining in the manifold are expelled from the lattice by a pulse of 461 nm light (10 ms). The actual interrogation is performed in a magnetic field of about 45 T parallel to the linear polarization of the lattice with a Rabi -pulse duration in the range of 100 ms to 150 ms. We use a normalized electron-shelving detection technique by applying a combination of the 461 nm fluorescence detection with 707 nm and 679 nm light to repump the atoms to the ground state, which determines the excitation probability at the frequency of the interrogation laser Falke et al. (2011).
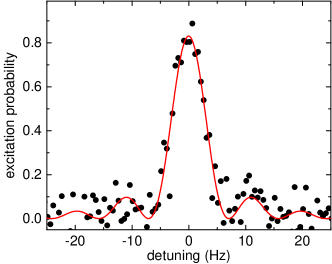
We apply this technique on both half-width points of each transition, addressing them and pulsing the light by using an AOM. A computer program evaluates these four interrogations and tracks the center frequency, the linear Zeeman splitting, and drift of the reference cavity. In this way it stabilizes the interrogation laser to the linear-Zeeman-shift-free transition frequency. Tuning the interrogation laser frequency across a single Zeeman transition, we observe a Fourier-limited linewidth of 7 Hz as shown in Fig. 2.
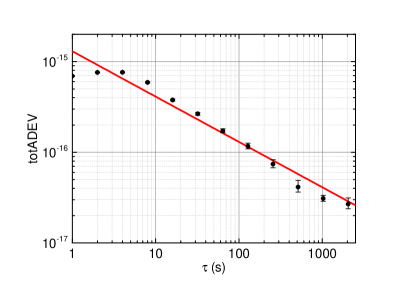
To evaluate the TOC, we perform a direct comparison with our stationary 87Sr OLC at PTB Falke et al. (2014); Al-Masoudi et al. (2015); Grebing et al. (2016). The beat frequency between the two reference lasers is recorded with a dead-time-free counter. No elements of the two clocks are shared such that the two clocks are fully independent. The instability of their frequency ratio, , is expressed by the total Allan deviation (Fig. 3). An instability of about is observed, which is governed by the transportable clock, since the stationary system exhibits an instability in the low range Al-Masoudi et al. (2015). The instability of the TOC is dominated by the performance of the interrogation laser Häfner (2015) through the Dick effect Dick (1988). This instability is lower than achieved in typical single ion clocks Chou et al. (2010); Godun et al. (2014); Cao et al. (2016); Huntemann et al. (2016), and comparable to many high perfromance lattice clocks Le Targat et al. (2013); Lodewyck et al. (2016); Hachisu and Ido (2015); Takamoto et al. (2011).
Beyond the instability of the transportable clock, the ratio measurements also test the agreement of both Sr OLCs within their uncertainties. The uncertainty of the stationary clock has been evaluated repeatedly and compared with primary Cs clocks Grebing et al. (2016); Falke et al. (2014) and another Sr OLC down to a fractional uncertainty of Lisdat et al. (2016).
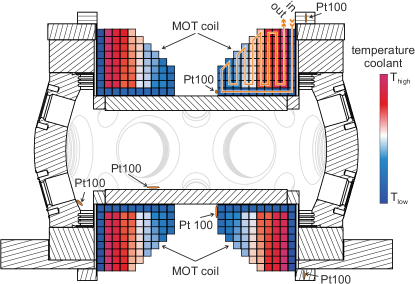
The uncertainty of the TOC was evaluated along the same lines as discussed for our stationary system Falke et al. (2012); Grebing et al. (2016): The BBR shift causes the largest fractional correction of about . To ensure a precise control of this shift even in a less temperature-stable environment than a laboratory, constructional details of the physics package are important. We avoid excessive power dissipation in the physics package by using the Zeeman slower mentioned above. For the coils generating the MOT and bias magnetic fields, we opted for compact coils with efficient water cooling (Fig. 4). The cooling water temperature is stabilized to better than 100 mK by a thermostat, which not only removes the energy dissipated in the coils, but effectively stabilizes the temperature of a large part of the environment of the atoms. Further, by adjusting the temperature of the coolant we minimize the temperature difference of the warmest () and coolest () spots of the vacuum chamber. The temperature is measured at eight locations out- and inside the vacuum chamber by platinum resistance sensors with an uncertainty of 40 mK, where we have taken care to cover the coolest and warmest spots. According to GUM we use as representative temperature to calculate the BBR shift. We assign an uncertainty of as we assume the ‘true’ temperature to lie with constant probability in the interval . Typically, we observe K resulting in an uncertainty contribution of about Nicholson et al. (2015); Middelmann et al. (2012).
Scalar and tensor lattice light shifts Westergaard et al. (2011) are determined by monitoring the difference in frequency offsets between the TOC and the stationary clock when operating the former with thermally averaged lattice depths of 50.8 and 88.8 . The atomic temperature in the lattice is derived from sideband spectra Blatt et al. (2009) and typically about 3.5 K. Higher-order light shifts are calculated using the coefficients given in Westergaard et al. (2011); Le Targat et al. (2013). Further details on the lattice light shifts are given below.
The cold-collision shift is determined similarly by varying the atom number in the lattice. Background gas collision shifts are calculated based on the theory in Gibble (2013), a lattice lifetime of 3 s and coefficients from Mitroy and Zhang (2010). While the linear Zeeman shift is directly removed by the stabilization protocol, the quadratic Zeeman shift has to be corrected independently. This is straightforward as the splitting of the Zeeman transitions provides a direct measure of the magnetic field sampled by the atoms. Tunneling between lattice sites is strongly suppressed due to the tilted and deep lattice Lemonde and Wolf (2005). The inner surfaces of the re-entrant flanges, which are the surfaces closest to the atoms (Fig. 4), are coated with a conducting material (Indium Tin Oxide) on top of an anti-reflective coating. With a separation of the windows of 54 mm, possible patch potentials of up to 100 mV, and the coefficient from Middelmann et al. (2012), we estimate a maximum DC Stark shift far below . Other known uncertainties from servo errors, optical path length variations Falke et al. (2012), and line pulling are below and will not be discussed here.
| transportable | stationary | |||
|---|---|---|---|---|
| effect | corr. | unc. | corr. | unc. |
| BBR ac Stark shift | ||||
| BBR oven | ||||
| Scalar/tensor lattice shift | ||||
| higher order lattice shifts | ||||
| probe light Stark shift | ||||
| cold collisions | ||||
| backgr. gas collisions | ||||
| 2nd order Zeeman shift | ||||
| servo error | ||||
| tunneling | ||||
| DC Stark shift | ||||
| total | ||||
During a first set of ratio measurements, the 813 nm light for the optical lattice has been delivered by a diode laser and amplified with a tapered amplifier (TA) chip. Such laser systems are known to cause problems in the determination of the ac-Stark shift cancellation wavelength due to spectral impurities caused by amplified spontaneous emission Le Targat et al. (2012). Nevertheless, it has been chosen for its compactness and mechanical robustness. The light from the TA laser system is spectrally filtered by a volume Bragg grating with a bandwidth of 0.1 nm. The filtered beam is sent through a 1 m long, large-mode-area (LMA) fiber to remove spatial and spectral correlations that could have been introduced by the grating. After this fiber, an AOM serves for power stabilization before the light is delivered through a second LMA fiber to the physics package. However, the comparison of both Sr lattice clocks has revealed a fractional frequency difference of about that is not compatible with the combined uncertainty of the clocks of below . In addition, the observed Stark shift cancellation frequency has been lower by 101 MHz than expected for the parallel alignment of the lattice polarization vector and the bias field, which even falls outside the wavelength range expected for any lattice polarization Westergaard et al. (2011).
We have replaced the TA diode laser by an titanium sapphire laser and repeated the measurements. After reevaluation of the TOC we found including a redshift correction of . Here, we use the extrapolated observed instability (Fig. 3) at the full length of the data set of as statistical uncertainty. The complete uncertainty budgets of both clocks are listed in Tab. 1.
In conclusion, we have built and characterized a TOC that achieves a systematic uncertainty of and an instability of . Note that the gross of the uncertainty stems from the uncertainty in the lattice light shift. This will be significantly reduced by a full characterization of the new lattice laser system that has been limited due to the short measurement time available. Therefore, we expect the BBR related uncertainty to become the limiting uncertainty in the near future, which is already below and can be reduced further by dedicated probes as presented in Bloom et al. (2014). An interrogation laser with improved frequency stability is under development and will reduce the instability of the clock. Already now, our TOC is outperforming the best transportable Cs fountain clock by one order of magnitude in systematic uncertainty and two orders in instability. Compared to the recently reported performance of the transportable Ca-ion clock Cao et al. (2016), our clock takes about 300-fold less averaging time to reach any given statistical uncertainty. The TOC is in a transportable container ready for applications like chronometric leveling, international clock comparisons and precision measurements for fundamental physics.
This work was supported by QUEST, DFG through the RTG 1729 and CRC 1128 geo-Q, the Marie-Curie Action ITN FACT, and the EMRP project ITOC. The EMRP is jointly funded by the EMRP participating countries within EURAMET and the European Union.
References
- Nicholson et al. (2015) T. L. Nicholson, S. L. Campbell, R. B. Hutson, G. E. Marti, B. J. Bloom, R. L. McNally, W. Zhang, M. D. Barrett, M. S. Safronova, G. F. Strouse, et al., Nature Com. 6, 6896 (2015).
- Ushijima et al. (2015) I. Ushijima, M. Takamoto, M. Das, T. Ohkubo, and H. Katori, Nature Photonics 9, 185 (2015).
- Huntemann et al. (2016) N. Huntemann, C. Sanner, B. Lipphardt, C. Tamm, and E. Peik, Phys. Rev. Lett. 116, 063001 (2016).
- Schulte et al. (2016) M. Schulte, N. Lörch, I. D. Leroux, P. O. Schmidt, and K. Hammerer, Phys. Rev. Lett. 116, 013002 (2016).
- Al-Masoudi et al. (2015) A. Al-Masoudi, S. Dörscher, S. Häfner, U. Sterr, and C. Lisdat, Phys. Rev. A 92, 063814 (2015).
- Hinkley et al. (2013) N. Hinkley, J. A. Sherman, N. B. Phillips, M. Schioppo, N. D. Lemke, K. Beloy, M. Pizzocaro, C. W. Oates, and A. D. Ludlow, Science 341, 1215 (2013).
- Riehle (2015) F. Riehle, C. R. Physique 16, 506 (2015), special issue: The measurement of time / La mesure du temps.
- Margolis (2014) H. Margolis, Nature Physics 10, 82 (2014), commentary.
- Nemitz et al. (2016) N. Nemitz, T. Ohkubo, M. Takamoto, I. Ushijima, M. Das, N. Ohmae, and H. Katori, Nature Photonics 10, 258 (2016).
- Grebing et al. (2016) C. Grebing, A. Al-Masoudi, S. Dörscher, S. Häfner, V. Gerginov, S. Weyers, B. Lipphardt, F. Riehle, U. Sterr, and C. Lisdat, Optica 3, 563 (2016).
- Le Targat et al. (2013) R. Le Targat, L. Lorini, Y. Le Coq, M. Zawada, J. Guéna, M. Abgrall, M. Gurov, P. Rosenbusch, D. G. Rovera, B. Nagórny, et al., Nature Com. 4, 2109 (2013).
- Huntemann et al. (2014) N. Huntemann, B. Lipphardt, C. Tamm, V. Gerginov, S. Weyers, and E. Peik, Phys. Rev. Lett. 113, 210802 (2014).
- Godun et al. (2014) R. M. Godun, P. B. R. Nisbet-Jones, J. M. Jones, S. A. King, L. A. M. Johnson, H. S. Margolis, K. Szymaniec, S. N. Lea, K. Bongs, and P. Gill, Phys. Rev. Lett. 113, 210801 (2014).
- Fortier et al. (2007) T. M. Fortier, N. Ashby, J. C. Bergquist, M. J. Delaney, S. A. Diddams, T. P. Heavner, L. Hollberg, W. M. Itano, S. R. Jefferts, K. Kim, et al., Phys. Rev. Lett. 98, 070801 (2007).
- Vermeer (1983) M. Vermeer, Chronometric Levelling, no. 83:2 in Reports of the Finnish Geodetic Institute (Geodeettinen Laitos, Geodetiska Institutet, 1983), ISBN 9789517110877, URL http://books.google.de/books?id=-iaUAAAACAAJ.
- Bjerhammar (1985) A. Bjerhammar, Bulletin Géodésique 59, 207 (1985).
- Bjerhammar (1986) A. Bjerhammar, Tech. Rep. Technical Report NOS 118 NGS 36, NOAA (1986), URL http://www.ngs.noaa.gov/PUBS_LIB/RelativisticGeodesy_TR_NOS118_NGS36.pdf.
- Lisdat et al. (2016) C. Lisdat, G. Grosche, N. Quintin, C. Shi, S. Raupach, C. Grebing, D. Nicolodi, F. Stefani, A. Al-Masoudi, S. Dörscher, et al., Nature Com. 7, 12443 (2016).
- Takano et al. (2016) T. Takano, M. Takamoto, I. Ushijima, N. Ohmae, T. Akatsuka, A. Yamaguchi, Y. Kuroishi, H. Munekane, B. Miyahara, and H. Katori, Nature Photonics (2016).
- Predehl et al. (2012) K. Predehl, G. Grosche, S. M. F. Raupach, S. Droste, O. Terra, J. Alnis, T. Legero, T. W. Hänsch, T. Udem, R. Holzwarth, et al., Science 336, 441 (2012).
- Raupach et al. (2015) S. M. F. Raupach, A. Koczwara, and G. Grosche, Phys. Rev. A 92, 021801(R) (2015).
- Chiodo et al. (2015) N. Chiodo, N. Quintin, F. Stefani, F. Wiotte, E. Camisard, C. Chardonnet, G. Santarelli, A. Amy-Klein, P.-E. Pottie, and O. Lopez, Opt. Express 23, 33927 (2015).
- Hachisu et al. (2014) H. Hachisu, M. Fujieda, S. Nagano, T. Gotoh, A. Nogami, T. Ido, S. Falke, N. Huntemann, C. Grebing, B. Lipphardt, et al., Opt. Lett. 39, 4072 (2014).
- Niering et al. (2000) M. Niering, R. Holzwarth, J. Reichert, P. Pokasov, T. Udem, M. Weitz, T. W. Hänsch, P. Lemonde, G. Santarelli, M. Abgrall, et al., Phys. Rev. Lett. 84, 5496 (2000).
- Fischer et al. (2004) M. Fischer, N. Kolachevsky, M. Zimmermann, R. Holzwarth, T. Udem, T. W. Hänsch, M. Abgrall, J. Grünert, I. Masimovic, S. Bize, et al., Phys. Rev. Lett. 92, 230802 (2004).
- Parthey et al. (2011) C. G. Parthey, A. Matveev, J. Alnis, B. Bernhardt, A. Beyer, R. Holzwarth, A. Maistrou, R. Pohl, K. Predehl, T. Udem, et al., Phys. Rev. Lett. 107, 203001 (2011).
- Bongs et al. (2015) K. Bongs, Y. Singh, L. Smith, W. He, O. Kock, D. Swierad, J. Hughes, S. Schiller, S. Alighanbari, S. Origlia, et al., C. R. Physique 16, 553 (2015), special Issue: The measurement of time / La mesure du temps.
- Poli et al. (2014) N. Poli, M. Schioppo, S. Vogt, S. Falke, U. Sterr, C. Lisdat, and G. M. Tino, Appl. Phys. B 117, 1107 (2014).
- Cao et al. (2016) J. Cao, P. Zhang, J. Shang, K. Cui, J. Yuan, S. Chao, S. Wang, H. Shu, and X. Huang, A transportable single-ion clock with systematic uncertainty, arXiv:1607.03731 (2016), eprint arXiv:1607.03731.
- Lodewyck et al. (2016) J. Lodewyck, S. Bilicki, E. Bookjans, J.-L. Robyr, C. Shi, G. Vallet, R. Le Targat, D. Nicolodi, Y. Le Coq, J. Guéna, et al., Metrologia 53, 1123 (2016).
- Falke et al. (2014) S. Falke, N. Lemke, C. Grebing, B. Lipphardt, S. Weyers, V. Gerginov, N. Huntemann, C. Hagemann, A. Al-Masoudi, S. Häfner, et al., New J. Phys. 16, 073023 (2014).
- Bize et al. (2004) S. Bize, P. Laurent, M. Abgrall, H. Marion, I. Maksimovic, L. Cacciapuoti, J. Grünert, C. Vian, F. Pereira dos Santos, P. Rosenbusch, et al., C. R. Physique 5, 829 (2004).
- Abgrall (2012) M. Abgrall, Frequency comparison (h_maser 140 0889) - (lne-syrte-fom) for the period mjd 56154 to mjd 56169 (2012), URL http://www.bipm.org/en/bipm-services/timescales/time-ftp/data.html.
- Guéna et al. (2012) J. Guéna, M. Abgrall, D. Rovera, P. Laurent, B. Chupin, M. Lours, G. Santarelli, P. Rosenbusch, M. E. Tobar, R. Li, et al., IEEE Trans. Ultrason. Ferroelectr. Freq. Control 59, 391 (2012).
- Vogt (2015) S. Vogt, Ph.D. thesis, QUEST-Leibniz-Forschungsschule der Universität Hannover (2015), URL http://edok01.tib.uni-hannover.de/edoks/e01dh15/837746116.pdf.
- Vogt et al. (2016) S. Vogt, S. Häfner, J. Grotti, S. Koller, A. Al-Masoudi, U. Sterr, and C. Lisdat, J. Phys.: Conf. Ser. 723, 012020 (2016).
- Bloom et al. (2014) B. J. Bloom, T. L. Nicholson, J. R. Williams, S. L. Campbell, M. Bishof, X. Zhang, W. Zhang, S. L. Bromley, and J. Ye, Nature 506, 71 (2014).
- Häfner (2015) S. Häfner, Ph.D. thesis, Leibniz Universität Hannover (2015), URL http://edok01.tib.uni-hannover.de/edoks/e01dh16/84568972X.pdf.
- Sterr (2011) U. Sterr, Frequenzstabilisierungsvorrichtung (2011), german patent DE 10 2011 015 489, URL https://depatisnet.dpma.de/DepatisNet/depatisnet?action=bibdat&docid=DE102011015489B3.
- Häfner et al. (2015) S. Häfner, S. Falke, C. Grebing, S. Vogt, T. Legero, M. Merimaa, C. Lisdat, and U. Sterr, Opt. Lett. 40, 2112 (2015).
- Vogt et al. (2011) S. Vogt, C. Lisdat, T. Legero, U. Sterr, I. Ernsting, A. Nevsky, and S. Schiller, Appl. Phys. B 104, 741 (2011).
- Katori (2002) H. Katori, in Proceedings of the Sixth Symposium on Frequency Standards and Metrology, 9–14 September 2001, St. Andrews, Scotland, edited by P. Gill (World Scientific, Singapore, 2002), pp. 323–330.
- Falke et al. (2011) S. Falke, H. Schnatz, J. S. R. Vellore Winfred, T. Middelmann, S. Vogt, S. Weyers, B. Lipphardt, G. Grosche, F. Riehle, U. Sterr, et al., Metrologia 48, 399 (2011).
- Dick (1988) G. J. Dick, in Proceedings of Annu. Precise Time and Time Interval Meeting, Redendo Beach, 1987 (U.S. Naval Observatory, Washington, DC, 1988), pp. 133–147, URL http://tycho.usno.navy.mil/ptti/1987papers/Vol%2019_13.pdf.
- Chou et al. (2010) C. W. Chou, D. B. Hume, J. C. J. Koelemeij, D. J. Wineland, and T. Rosenband, Phys. Rev. Lett. 104, 070802 (2010).
- Hachisu and Ido (2015) H. Hachisu and T. Ido, Jpn. J. Appl. Phys. 54, 112401 (2015).
- Takamoto et al. (2011) M. Takamoto, T. Takano, and H. Katori, Nature Photonics 5, 288 (2011).
- Falke et al. (2012) S. Falke, M. Misera, U. Sterr, and C. Lisdat, Appl. Phys. B 107, 301 (2012).
- (49) GUM, Guide to the expression of uncertainty in measurement, ISO/TAG 4. Published by ISO, 1993 (corrected and reprinted, 1995) in the name of the BIPM, IEC, IFCC, ISO, UPAC, IUPAP and OIML (1995), ISBN number: 92-67-10188-9, 1995.
- Middelmann et al. (2012) T. Middelmann, S. Falke, C. Lisdat, and U. Sterr, New J. Phys. 14, 073020 (13pp) (2012).
- Westergaard et al. (2011) P. G. Westergaard, J. Lodewyck, L. Lorini, A. Lecallier, E. A. Burt, M. Zawada, J. Millo, and P. Lemonde, Phys. Rev. Lett. 106, 210801 (2011).
- Blatt et al. (2009) S. Blatt, J. W. Thomsen, G. K. Campbell, A. D. Ludlow, M. D. Swallows, M. J. Martin, M. M. Boyd, and J. Ye, Phys. Rev. A 80, 052703 (2009).
- Gibble (2013) K. Gibble, Phys. Rev. Lett. 110, 180802 (2013).
- Mitroy and Zhang (2010) J. Mitroy and J. Y. Zhang, Mol. Phys. 108, 1999 (2010).
- Lemonde and Wolf (2005) P. Lemonde and P. Wolf, Phys. Rev. A 72, 033409 (2005).
- Le Targat et al. (2012) R. Le Targat, L. Lorini, M. Gurov, M. Zawada, R. Gartman, B. Nagorny, P. Lemonde, and J. Lodewyck, in European Frequency and Time Forum (EFTF), 2012 (IEEE, Gothenburg, 2012), contribution to European Frequency and Time Forum 2012, Gothenburg, Sweden,.