Audio-band Coating Thermal Noise Measurement for Advanced LIGO with a Multi-mode Optical Resonator
Abstract
In modern high precision optical instruments, such as in gravitational wave detectors or frequency references, thermally induced fluctuations in the reflective coatings can be a limiting noise source. This noise, known as coating thermal noise, can be reduced by choosing materials with low mechanical loss. Examination of new materials becomes a necessity in order to further minimize the coating thermal noise and thus improve sensitivity of next generation instruments. We present a novel approach to directly measure coating thermal noise using a high finesse folded cavity in which multiple Hermite-Gaussian modes co-resonate. This method is used to probe surface fluctuations on the order in the frequency range . We applied this technique to measure thermal noise and loss angle of the coating used in Advanced LIGO.
pacs:
04.80.Nn, 06.30.-k, 05.40.Jc, 07.60.-jI Introduction
Dielectric coatings used in high precision optical instruments consist of alternating layers of materials with low and high index of refraction. Thermal noise in these coatings arises from mechanical dissipation in the coating materials described by the fluctuation dissipation theorem. This noise limits the sensitivity of the current gravitational wave detectors Harry et al. (2007); Evans et al. (2008); Abbott et al. (2016), of the best frequency references Ludlow et al. (2007), and of macroscopic quantum measurements Abbott et al. (2009); Poot and van der Zant (2012).
Further improvement of these instruments calls for reduction of the coating thermal noise. The materials presently in use belong to the class of amorphous glassy oxides including SiO2, Ta2O5, ZrO2, Nb2O5, HfO2 and Al2O3. The search for the new high reflectivity surfaces with low mechanical loss explores a wide range of possibilities: from new amorphous coatings produced with conventional ion beam sputtering techniques Flaminio et al. (2010); Yam et al. (2015), to crystal coatings Cole et al. (2013) and grating reflectors Heinert et al. (2013).
The loss angle of new coating materials is most frequently obtained based on the measurement of the mechanical quality factor. The techniques presented in the literature include, among others, suspended disks Crooks et al. (2002); Harry et al. (2002), clamped cantilevers Pierro and Pinto (2006), and the gentle nodal suspension Cesarini et al. (2009). The level of coating thermal noise is then calculated from the measured parameters, such as mechanical loss angles, Poisson ratio, and Young’s modulus. However, due to uncertainties in the multilayer parameters a robust experimental setup is necessary to directly measure coating thermal noise of a particular sample.
Such a measurement is complicated by multiple noise sources such as table vibrations, laser frequency and amplitude noise, and various readout noises. In the past, direct measurements of the coating thermal noise have been accomplished using suspended free-space Fabry-Perot cavities Numata et al. (2003); Black et al. (2004). Seismic motion limits the sensitivity of these experiments below 100 Hz. On the other hand, fixed-spacer cavities with optically contacting mirrors were recently developed to observe coating thermal noise below 100 Hz Chalermsongsak et al. (2014). However, the readout of this experiment is located in transmission of the cavities. This sets an upper limit on the reflectivity of the measured sample.
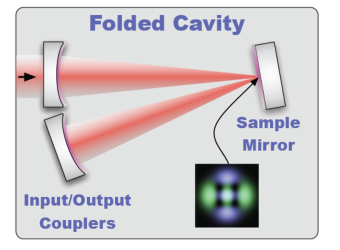
This paper describes a novel technique for the direct observation of the coating thermal noise which uses only one free-space Fabry-Perot cavity, and in which there is no upper limit on the sample reflectivity. Multiple transverse electromagnetic modes (TEM) co-resonate in the cavity: 00, 02 and 20. These modes have orthogonal spacial profiles, and probe different areas of the sample coating, while other displacement noises of the cavity are common to all resonating modes. Coating thermal noise is extracted from the frequency difference between the two higher order modes.
In Sec. II we describe analytical calculations of the coating thermal noise for the fundamental and higher order modes in the linear and folded cavities. Sec. III describes our experimental setup. We have used it to measure the coating thermal noise of an Advanced LIGO The LIGO Scientific Collaboration (2015) witness sample. In Sec. V we discuss the sensitivity of our experiment, measured coating thermal noise of Advanced LIGO sample and the estimation of : loss angle.
II Coating thermal noise
The reflectivity of an optical coating scales with the number of coating layers and for typical coating materials, a transmission of a few parts-per-million can be achieved with a coating roughly 10 optical wavelengths thick. While excellent optical properties are available for large () optics with ion beam sputtered coatings, the metal oxides are mechanically much lossier than the fused silica or silicon substrates. This loss makes coatings a dominant source of thermal noise Cole et al. (2013).
The fluctuation-dissipation theorem Kubo (1966) connects the properties of an observable, in our case the displacement of the mirror surface, with the conversion of mechanical energy to heat (i.e., dissipation in the mirror coating). The single sided power spectral density (PSD) of the observable is given by
| (1) |
where is the temperature, the Boltzmann constant, and is the time averaged dissipated power in the coating when subjected to a sinusoidally varying force Levin (1998). Though there are a variety of dissipation mechanisms in the coating which can cause the observable to fluctuate Evans et al. (2008); Braginsky et al. (1999), in this paper we focus on the dominant dissipative mechanism, mechanical loss of the coating materials. Though this is a subset of all coating thermal noises, we will refer to the noise related to this dissipation mechanism as coating thermal noise (CTN).
The features of coating thermal noise can be clearly examined if we consider a simplified model of the coating as a single lossy layer of thickness . The power dissipation in a single layer can be written as
| (2) |
where and are the Poisson ratio and Young’s modulus, is the beam waist size, and is the mechanical loss angle. By combining Eqns. 1 and 2 we can see a dependence of the PSD of CTN, assuming that and other mechanical properties are frequency independent Yam et al. (2015).
While direct measurements of the coating thermal noise are associated with a particular set of parameters, i.e. beam size, beam spatial profile, and cavity geometry, it is often necessary to predict the level of the coating thermal noise for different parameters. In particular, our experiment measures the thermal noises sensed by TEM02 and TEM20 modes, shown in Fig. 1 and referred to as . On the other hand, the lowest-order transverse mode TEM00 is commonly used in optical experiments such as gravitational wave observatories for which the coating thermal noise equals to .

In order to estimate from , we employ the correction factor :
| (3) |
A detailed description of our computation of this correction factor can be found in Sec. IV.
III Experimental Setup
The key component of the measurement technique presented in this article is the folded cavity with three co-resonant optical modes: TEM02, TEM20, and TEM00. The TEM02 and TEM20 second order transverse modes, collectively referred to as “higher order modes” (HOMs), are shown in Fig. 1. The thermal noise sensed by the TEM02 mode differs from the noise sensed by the TEM20 mode since these modes sample different areas of the coating. Both resonant modes have, on the other hand, nearly identical response to the common mode noises such as laser frequency noise, cavity length noise, and mirror substrate thermal noise. The TEM00 mode, which also shares the same sensitivity to the laser frequency and cavity length, is used to suppress these common noises (see Section III.2). The primary output of the experiment is the difference between the resonant frequencies of TEM02 and TEM20.
The TEM02 and TEM20 modes are chosen for a number of reasons. First, since they are even order modes, coupling into these modes has no first order sensitivity to the alignment of the cavity relative to the input beam Anderson (1984). Secondly, even order modes of the optical cavity can be excited by the input beam in the fundamental mode. No special optics are required to achieve 12% of the power coupling. Lastly, modes of the same order are required to maintain a small separation in their resonant frequencies and keep high common mode rejection to the cavity noises (see Sec. V.1.1).
The remainder of this section describes the parameters of the experiment such as geometry of the optical cavity, input and output optics, readout technique and feedback control loops.
III.1 Optical cavity
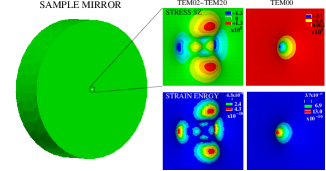
The experiment uses a 3-mirror folded cavity, with the sample to be measured as the folding mirror (see Fig. 2). The cavity is located in vacuum at a pressure of Torr and at room temperature. This folded configuration allows us to test high reflectivity coatings, and, since the sample mirror is flat, we can use the witness flats commonly included in the coating fabrication process of large optics. This configuration also allows us to change the size of the beam on the sample mirror by changing the location of the sample mirror in the cavity (without changing the cavity length), thereby enabling an exploration of the scaling of coating thermal noise with beam size.
III.1.1 Geometrical parameters
We chose a folded cavity of nominal length and input and output couplers with radius of curvature . These parameters imply that a waist size , free spectral range , and the transverse mode spacing Siegman (1986) of
| (4) |
where . This value of implies that the frequency difference between TEM00 and TEM02 or TEM20 is if the modes are in the same polarization. In practice, the horizontal and vertical radii of curvature are slightly different, and TEM02 and TEM20 modes experience different frequency shifts. The separation between these frequencies can be tuned by rotating the input coupler relative to the output coupler. The frequency difference of the two modes defines the beat note frequency used for the main readout, described in Sec. III.2. We tuned the frequency separation to in order to minimize laser frequency noise coupling and other technical noises (see Sec. III.3).
The distance from the waist to the sample mirror is , while to the input and output couplers are from the waist. These distances determine the geometry of the resonant modes in the cavity, and thus the beam size on the sample mirror and on the couplers . For our design with the CTN from the couplers is expected to contribute only a few percent of the total power spectral density.
III.1.2 Optical parameters
The transmission of the input and output couplers was chosen to be (finesse of ). The total round-trip optical loss due to the coating roughness and dust particles on the mirror surface was found to be . Since our cavity is critically coupled, most of the input power is transmitted through the cavity.
The lower limit on the beam size and the upper limit on the resonating power is determined by the following requirements. Firstly, the intensity on the mirrors should be sustainable by the optical coating and be less than . Secondly, the beam size should be much larger than the coating thickness (i.e., ). The thermal propagation length in the coating, roughly at for coatings involving silica, is also of interest since the beams smaller than this size will experience thermo-optic noise which differs from those of gravitational wave detectors, where Evans et al. (2008).
For input power of , the power resonating in the cavity and the peak intensity on the sample mirror are approximately
| (5) |
and
| (6) |
For our mode matching to the cavity , and beam size , the input power of for each higher order mode is clearly safe.
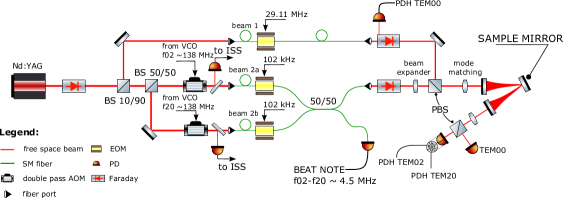
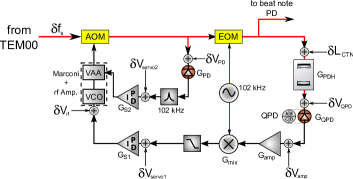
III.2 Input and output ports
The optical layout is shown in Fig. 3. The Nd:YAG laser output in the fundamental mode is split into three paths: 10% of the power is fiber coupled into the TEM00 path (beam 1) and 45% of the power goes into each of the TEM02 and TEM20 paths (beams 2a and 2b). The beams 2a and 2b are shifted in frequency relative to the beam 1 using acousto-optic modulators (AOMs). The AOMs are configured for down-conversion, double passed, and driven at to match the frequency of the input beam to the resonant frequencies of the cavity 02 and 20 modes. The output beams of each AOM are coupled into optical fibers, which provide convenient transport and spatial mode stability.
All three optical paths are phase modulated using broadband electro-optic modulators (EOMs) for the feedback control presented in Sec. III.3. In addition to phase modulation with EOMs, the first and second beams are mixed using a 50/50 coupler. The two output beams of this coupler are used to excite the cavity 02 and 20 modes and to produce the beat note readout. All three beams are recombined on the polarizing beam splitter (PBS) before the input to the folded cavity.
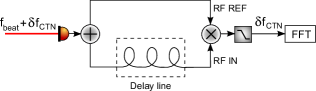
The spectrum of the coating thermal noise is obtained by mixing beams 2a and 2b on a photodetector. Note that the beams 2a and 2b are in their fundamental TEM00 mode all the way to the cavity and on the beat photodetector. The conversion to TEM02 and TEM20 transverse modes takes place in the cavity. Optical power produces a beat note signal at , which is demodulated using an RF delay line, shown in Fig. 4. The delay line is composed of an RF splitter, a long cable, and an RF phase detector.
III.3 Control Scheme
Three analog servo loops are set to keep the TEM00, TEM02 and TEM20 spatial modes on resonance in the cavity. Additional narrowband loops suppress the laser amplitude and frequency noise at and to improve sensitivity as described in Sec. V.1.6.
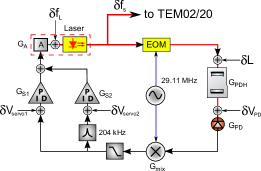
The laser frequency is stabilized to the cavity length using TEM00 with bandwidth of . The control loop is shown in Fig. 5. The Pound–Drever–Hall (PDH) error signal is derived from the reflection port. The residual frequency noise below is less than . Ideally, the difference between TEM02 and TEM20 resonant frequencies is weakly sensitive to the residual frequency noise, however, experimental imperfections make the TEM00 loop an important first layer of protection from these noise sources.
The frequency of RF oscillators used to shift frequencies of the beam 2a and 2b are stabilized to the 02 and 20 mode resonances using control loops shown in Fig. 6. The error signal is derived from the PDH signal in the transmission port. During initial testing we found that PDH signal derived from the reflection port has extra noise due to the fact that only 3% of the power from 2a and 2b beams is converted to TEM02 and TEM20 modes. The residual power reflects from the cavity in the fundamental mode and adds noise to the readout. On the other hand, only the TEM02 and TEM20 cavity modes reach the transmission port of the cavity, and the two modes can be separated on a quadrant photodetector. While offering lower noise, this control scheme implies that modulation sidebands should also resonate in the cavity, and this limits their frequency . This frequency limits the bandwidth of TEM02 and TEM20 modes to and adds noises from the down-conversion process described in Sec. V.1.6.
IV Extrapolation to TEM00 beams
In this section we describe our procedure to evaluate the correction factor required to estimate coating thermal noise for an arbitrary TEM00 beam spot size (see Eqn. 3). Based on the value of computed here , we estimate CTN in the Advanced LIGO gravitational wave detector, see Section V.2.
The correction factor in Eqn. 3 is defined as a product of individual factors related to distinct cavity parameters,
| (7) |
where is the ideal beam size scaling factor, and is the conversion factor from a folded to linear cavity. The other correction factors, which are all close to unity, are: accounts for the difference in the coating thermal noise sensed by TEM02 and TEM00 beams, corrects for the finite coating thickness, and accounts for to the fringe pattern on the sample mirror in the folded cavityHeinert et al. (2014). Finally, and correct for finite coating thickness and finite mirror size Liu and Thorne (2000); Somiya and Yamamoto (2009).
IV.1 Beam size
In the limit of thin coatings and large optics (relative to the beam radius), coating thermal noise PSD simply scales inversely with area of the beam, thus
where is the desired beam size (e.g., in LIGO) and is the beam size on the sample mirror in our experiment (see Table 1).
IV.2 Higher order modes
| Parameter | Sample mirror | aLIGO test mass |
|---|---|---|
| Diameter | ||
| Thickness | ||
| Beam spot size | ||
| Pressure profile | TEM(02-20), TEM00 | TEM00 |
| , | ||
| Substrate material | ||
| Coating material | /: | /: |
| Coating model | monolayer | monolayer |
| Coating thickness, d | ||
| Analysis | harmonic | analytical |
| Frequency | DC | |
| Element type | solid185 | N/A |
| Output | , , | , |
| , |
The correction factors , , and are calculated using the stored strain energy in the coating. Since dissipation is a product of the stored energy and the tangent of the coating material loss angle, the spectral density of the coating thermal noise scales with energy Kubo (1966).
The strain energy associated with the TEM00 mode, , is produced by a pressure profile associated with the optical field intensity, , Levin (1998)
while for the experiment readout, the energy, , results from the pressure profile
The negative sign between TEM02 and TEM20 intensities corresponds to their opposite sign in the readout, and results in the signal cancellation of the overlapping central part of the TEM20 and TEM02 modes, see Figs. 2 and 7.
In order to obtain strain energy corresponding to each pressure profile, we performed a harmonic finite element analysis ans in which an oscillating pressure profile with dimensions and shape of the optical mode is applied onto the coating surface. Both the substrate and coating models were meshed with low order 3D elements and the coating was simulated as a monolayer with effective material properties Principe et al. (2015). An example of calculated energy profiles in the coating is shown in FIG. 7.
We define the multi-mode correction factor as
| (8) |
where is the strain energy stored in a coating corresponding to the TEM00 and TEM02-20 modes, and the superscript “thick” indicates that this energy is computed with a finite coating thickness, see Table 1. The value of indicates that TEM02 and TEM20 sense a smaller coating thermal noise compared to the TEM00 of the same Hermite-Gaussian modal basis. Interestingly, goes to unity for a thin coating on a stiff substrate, and thus is entirely due to the details of the mechanical response of the mirror to the applied pressure profile.
IV.3 Folded cavities
The folded cavity conversion factor is the ratio of the coating thermal noise of the folded cavity to that of a linear cavity,
since the sample mirror is encountered twice in a cavity round-trip. This doubles the amplitude of the coating thermal noise, and thus requires a factor of 4 correction in the power spectrum density.
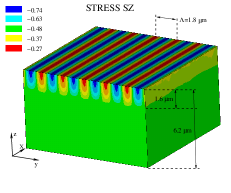
The fringe correction factor is related to the fact that folded cavities have increased thermal noise due to the fringe pattern on the folding mirror Heinert et al. (2014). For the folding angle of used in our testbed
| (9) |
where corresponds to the energy due to the uniform pressure field applied to the mirror and is the energy corresponding to the pressure profile
with fringe separation , see Fig. 8. Note that this is rather different than the limit of an infinitesimally thin coating in which approaches .
IV.4 Finite coating size
The thick to thin coating thickness correction factor is defined as
| (10) |
where corresponds to the actual coating thickness and is chosen to approximate a coating which is much smaller than the target beam size, assuming . The result indicates that the strain energy density in the thick coating does not fully reach the bottom layers, and is thus slightly smaller than in the thinner coating.
The finite mirror size correction factor is not directly related to the coating thermal noise measurement, but is required to correctly compute this noise in Advanced LIGO Liu and Thorne (2000); Somiya and Yamamoto (2009). The finite size correction factor for a large beam spot size is defined as
| (11) |
where corresponds to the coating energy of the finite size mirror to which the coating thermal noise measurement is extrapolated and corresponds to the energy of an infinite mirror. To calculate we used equations 26, 27, and 28 from Somiya and Yamamoto (2009).
V Experimental Results
| Parameter | TEM02 | TEM20 |
|---|---|---|
| Input power, mW | 14.2 | 14.3 |
| Transmitted power, mW | 0.4 | 0.4 |
| Cavity pole, kHz | 50.8 | 50.0 |
| Modulation, kHz | 102 | 102 |
| Modulation depth | 0.92 | 0.92 |
| Finesse, | 15.06 | 15.30 |
| Round trip loss, ppm | 17.3 | 10.7 |
| Mode coupling, % | 3.1 | 3.0 |
| Mode frequency, MHz | 276.462 | 280.914 |
| Beam size, m | 55.10 | 55.38 |
| RoC (effective), mm | 50.883 | 50.919 |
| Arm length, mm | ||
| Folding angle, deg | 17.23 | |
This section describes the sensitivity of the experimental setup and results for the Advanced LIGO coating sample Aasi et al. (2015). The tested coating, produced at Laboratoire des Matériaux Avancés (LMA, Lyon, France), was ion-beam sputtered and consists of alternating layers of SiO2 and Ta2O5 alloyed with 25% TiO2. The thickness of and : layers was optimized to operate at and (for more details on coating structure, see Table VII in Hong et al. (2013)). The sample mirror has a transmissivity of at the measurement wavelength ().
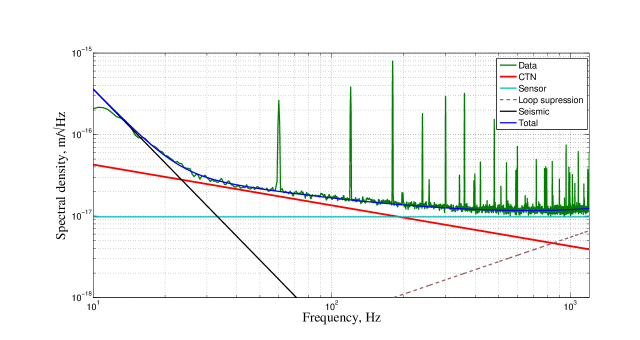
The measured amplitude spectral density is shown in Fig. 9 and the folded cavity parameters are shown in Table 2. The slope in the frequency range is a combination of the coating thermal noise and white sensing noise. This noise is a sum of multiple contributors, described in the following section.
V.1 Noise sources
The measured noise PSD contains the coating thermal noise as well as fundamental and technical noises. In this section we describe the major noise sources that contribute to . The only “fundamental” limit to sensitivity is the shot noise on the readout, but technical noise sources such as photo-thermal noise, vibration coupling through scattered light, and RF oscillator noise are also discussed here since they have the potential to limit the sensitivity of this technique.
V.1.1 Vibration Noise
Mechanical motion of the optical table couples to the readout channel via several mechanisms and limits the measurement below , as seen in Fig. 9.
First of all, fluctuations of the cavity total length couple to the readout channel very weakly due to the common mode rejection. Residual coupling is due to the frequency difference between 02 and 20 modes:
| (12) |
where Hz is the laser frequency. The measurement of the cavity length fluctuations is limited by the laser frequency noise
Coupling to the readout channel at is , which is four orders of magnitude below CTN.
Vibrations of the cavity mirrors can also couple to the readout channel through backscattering. Since only the total length of the cavity is controlled, optical phase between the couplers and the sample mirror is uncontrolled. Fluctuations of this phase introduce extra noise to the readout channel is
| (13) |
where is vibration of the distance between the input coupler and the folded mirror at frequency . The backscattering coefficient is determined by the equation
| (14) |
where is the the bidirectional reflectance distribution function of the sample mirror. Backscattering coefficients and can be slightly different since TEM02 and TEM20 reflect from the different parts of the mirror surface. Backscattering adds noise to the readout channel on the order of . We estimate this as which is still an order of magnitude below the coating thermal noise. However, backscattering also occurs outside of the cavity and adds noise to the readout channel.
Finally, mechanical motion of the input mirrors also introduces noise to the readout channel in two ways. First, longitudinal motion modulates the phase of the beams 2a and 2b according to the equation
| (15) |
Our estimations show that at . This noise couples to the readout channel at this frequency at the level of . This number is close to the coating thermal noise at . Secondly, angular motion of the input mirrors modulates the power resonating in the cavity. Power fluctuations couple to the readout channel through the photo–thermal noise.
V.1.2 Photo-thermal Noise
Power fluctuation in the cavity can couple to cavity length through thermal expansion of the sample mirror, resulting in a length noise known as “photo-thermal” or sometimes “thermo-optic” noise (not to be confused with the coherent combination of thermo-elastic and thermo-refractive noise also known as “thermo-optic” noise Evans et al. (2008)).
The expression for the thermal expansion in the case where the beam size is large compared to the thermal propagation length in the substrate, , is
| (16) |
where is the absorbed power, is the heat capacity per unit volume (written as the product of the heat capacity per unit mass and the density), is the coefficient of thermal expansion, is the power spectrum density of the laser relative intensity noise, and is the Poisson ratio (see Sec. 2.8.5 in Ballmer (2006)). In the opposing limit of low frequencies is replaced by Winkler et al. (1991).
| (17) |
A simple combination of these is
| (18) | |||||
which agrees with an experimental limit we placed on this coupling of less than for a RIN of .
A similar but more subtle noise source is the change in curvature of the optic resulting from heating of the coating, which in turn changes the transverse mode spacing and could appear in the primary output. The calculation of this “thermo-optic curvature noise” will not be reproduced here, since the result is numerically smaller than the direct length coupling by more than an order of magnitude.
V.1.3 RF Oscillator Noise
RF oscillators, used to shift the frequency of higher order modes (see Fig. 6), have noise level on the order of below 1 kHz. This noise is suppressed by the feedback loops which keep TEM02 and TEM20 on resonance. However, finite bandwidth of these loops results in the limited suppression of the RF oscillator noise, which then adds noise to the readout channel according to the equation
| (19) |
RF oscillator noise causes the degradation of the sensitivity above . The noise floor rises towards the unity gain frequency of higher order feedback control loops. (see Fig. 9).
V.1.4 Readout electronics
In order to prevent any environmental RF pickup and seismic noise, the delay line (see Sec. III.2) is enclosed in a thick metal chamber and wire suspended. The noise related to the readout system (RF Oscillator + Delay line) is estimated at the level of .
Converting this to the units of of the cavity length,
which is a factor of 20 below the level of the coating thermal noise at 100 Hz.
V.1.5 Shot noise
Photon counting noise, or “shot noise”, is an unavoidable noise source in precision optical measurements and sufficient power on the sensor is required to sustain the shot noise below the coating thermal noise level. The relevant equation for shot noise in the PDH readout of a high-finesse cavity, expressed as an equivalent displacement of the optics is
| (20) |
where are the Bessel functions, and is the wavelength of light used in the cavity Fritschel (1993). To compute a shot noise level it is further assumed that the mode matching is and modulation depth is . The resulting shot noise, assuming a total input power of and a finesse of , is
| (21) |
V.1.6 Down-conversion
A significant fraction of the observed broadband white noise at the level of can be explained by the process of downconversion. High frequency laser amplitude and frequency noises are seen in the audio band due to the non-linear demodulation processes required to produce PDH error signals.
Differential amplitude fluctuations of TEM02 and TEM20 beams at the modulation frequency () directly couple to the readout channel. These fluctuations arise from the imbalance in the cavity poles for two modes and due to different input paths of the beams 2a and 2b. This noise was suppressed by using the additional intensity stabilization servos described in Sec. III.3, without which it would be a factor of 3 above shot noise. The readout channel sees down-converted amplitude noise at the level of
| (22) |
where is the open loop gain of the intensity stabilization servo around 102 kHz.
Secondly, frequency noise around 102 kHz and harmonics is down-converted to the audio band during the demodulation process. We found that the biggest contribution comes from the noise around the second harmonic at 204 kHz. An addition servo has been introduced to suppress laser noise around this frequency as shown in the Fig. 5.
Finally, RF frequency noise around the beat frequency is downconverted to the audio band if there is an imbalance in the pole frequencies for TEM02 and TEM20 modes. A careful analysis of optical losses and cleaning the mirrors helped to reduce this imbalance as shown in the Table 2. The beat frequency was also set to minimize the laser noise at this frequency.
V.2 Advanced LIGO Coating Thermal Noise
The least square fitting of a series of spectra gives the following result for the coating thermal noise in our experiment:
Extrapolation of our measured PSD to the PSD of a large beam on an aLIGO end test mass, the total correction factor can be written as
| (23) |
Based on Eqn. 3 we estimate the value of the coating thermal noise for the Advanced LIGO end test mass (ETM):
| (24) | |||||
which is slightly higher than the value used in Advanced LIGO design documents ( at calculated with Eqn.1,2 in Harry et al. (2007) and for the loss angle value of and Aasi et al. (2015),).
Since the Advanced LIGO input test mass coating is made out of the same materials, we estimate an overall increase of the coating thermal noise by 20% compared to Aasi et al. (2015). Interestingly, there is some evidence that this higher estimation of the coating thermal noise can be associated with interface losses in the coating structure as reported in Granata et al. (2016).
V.3 Loss angle of :
To estimate the loss angle for the titania-tantala alloy used as the high refractive index material in the Advanced LIGO coatings, we use the loss angle for silicon-dioxide (the low index material) of Principe et al. (2015), and assume that the loss angles associated with shear and bulk deformation in both materials are equal.
We adopted the formula from Yam et al. (2015) and calculate the power spectrum density
| (25) |
where the unitless weighting factor for each layer is
| (26) |
under the approximation that no field penetrates into the coating.
VI Conclusions
We presented a novel experiment for the broadband direct measurements of the coating thermal noise. The sensitivity of has been achieved in the frequency band . This is made possible by our novel measurement technique, in which TEM00, 02 and 20 spatial modes all co-resonate in a folded cavity.
As a first application of this technique, we measured the coating thermal noise from Advanced LIGO coating and estimated the loss angle of :. Our results are broadly consistent with the previous estimations, but give a 20% higher coating thermal noise compared to the published Advanced LIGO noise estimates Aasi et al. (2015); Martynov et al. (2016).
With the ever increasing sensitivity of precision optical measurements, coating thermal noise has become a significant obstacle. In terms of the gravitational wave interferometers and some macroscopic quantum measurement experiments, it is essential to reduce this noise in order to reach and surpass the standard quantum limit. Our experiment design will allow for rapid testing new coatings, thereby helping to reduce the coating thermal noise in the future generation of gravitational wave detectors, frequency references and quantum measurements.
Acknowledgements.
The authors would like to acknowledge the invaluable wisdom derived from interactions with members of the LIGO Scientific Collaboration’s optics working group without which this work would not have been possible. In particular, the multi-mode cavity design developed from a seed planted several years ago in a conversation with Koji Arai. We are also very grateful for the computing support provided by The MathWorks, Inc. LIGO was constructed by the California Institute of Technology and Massachusetts Institute of Technology with funding from the National Science Foundation, and operates under cooperative agreement PHY-0757058. Advanced LIGO was built under award PHY-0823459. This paper carries LIGO Document Number LIGO-P1600228.References
- Harry et al. (2007) G. M. Harry et al., Classical and Quantum Gravity 24, 405 (2007).
- Evans et al. (2008) M. Evans, S. Ballmer, M. Fejer, P. Fritschel, G. Harry, and G. Ogin, Phys. Rev. D 78, 102003 (2008).
- Abbott et al. (2016) B. P. Abbott et al. (LIGO Scientific Collaboration and Virgo Collaboration), Phys. Rev. Lett. 116, 061102 (2016).
- Ludlow et al. (2007) A. D. Ludlow, X. Huang, M. Notcutt, T. Zanon-Willette, S. M. Foreman, M. M. Boyd, S. Blatt, and J. Ye, Opt. Lett. 32, 641 (2007).
- Abbott et al. (2009) B. Abbott et al., New Journal of Physics 11, 073032 (2009).
- Poot and van der Zant (2012) M. Poot and H. S. van der Zant, Physics Reports 511, 273 (2012), mechanical systems in the quantum regime.
- Flaminio et al. (2010) R. Flaminio, J. Franc, C. Michel, N. Morgado, L. Pinard, and B. Sassolas, Classical and Quantum Gravity 27, 084030 (2010).
- Yam et al. (2015) W. Yam, S. Gras, and M. Evans, Phys. Rev. D 91, 042002 (2015).
- Cole et al. (2013) G. D. Cole, W. Zhang, M. J. Martin, J. Ye, and M. Aspelmeyer, Nature Photonics 7, 644 (2013).
- Heinert et al. (2013) D. Heinert, S. Kroker, D. Friedrich, S. Hild, E.-B. Kley, S. Leavey, I. W. Martin, R. Nawrodt, A. Tünnermann, S. P. Vyatchanin, and K. Yamamoto, Phys. Rev. D 88, 042001 (2013).
- Crooks et al. (2002) D. R. M. Crooks, P. Sneddon, G. Cagnoli, J. Hough, S. Rowan, M. M. Fejer, E. Gustafson, R. Route, N. Nakagawa, D. Coyne, G. M. Harry, and A. M. Gretarsson, Classical and Quantum Gravity 19, 883 (2002).
- Harry et al. (2002) G. M. Harry, A. M. Gretarsson, P. R. Saulson, S. E. Kittelberger, S. D. Penn, W. J. Startin, S. Rowan, M. M. Fejer, D. R. M. Crooks, G. Cagnoli, J. Hough, and N. Nakagawa, Classical and Quantum Gravity 19, 897 (2002).
- Pierro and Pinto (2006) V. Pierro and I. M. Pinto, Measuring Coating Mechanical Quality Factors in a Layered Cantilever Geometry: a Fully Analytic Model, Tech. Rep. (TWG, University of Sannio at Benevento, 2006).
- Cesarini et al. (2009) E. Cesarini, M. Lorenzini, E. Campagna, F. Martelli, F. Piergiovanni, F. Vetrano, G. Losurdo, and G. Cagnoli, Review of Scientific Instruments 80, 053904 (2009).
- Numata et al. (2003) K. Numata, M. Ando, K. Yamamoto, S. Otsuka, and K. Tsubono, Phys. Rev. Lett. 91, 260602 (2003).
- Black et al. (2004) E. D. Black, A. Villar, K. Barbary, A. Bushmaker, J. Heefner, S. Kawamura, F. Kawazoe, L. Matone, S. Meidt, S. R. Rao, K. Schulz, M. Zhang, and K. G. Libbrecht, Physics Letters A 328, 1 (2004).
- Chalermsongsak et al. (2014) T. Chalermsongsak, F. Seifert, E. D. Hall, K. Arai, E. K. Gustafson, and R. X. Adhikari, Metrologia 52 (2014).
- The LIGO Scientific Collaboration (2015) The LIGO Scientific Collaboration, Classical and Quantum Gravity 32, 074001 (2015).
- Kubo (1966) R. Kubo, Reports on Progress in Physics 29, 255 (1966).
- Levin (1998) Y. Levin, Phys. Rev. D 57, 659 (1998).
- Braginsky et al. (1999) V. Braginsky, M. Gorodetsky, and S. Vyatchanin, Physics Letters A 264, 1 (1999).
- Siegman (1986) A. Siegman, Lasers (University Science Books, 1986).
- Anderson (1984) D. Z. Anderson, Appl. Opt. 23, 2944 (1984).
- Heinert et al. (2014) D. Heinert, K. Craig, H. Grote, S. Hild, H. Lück, R. Nawrodt, D. A. Simakov, D. V. Vasilyev, S. P. Vyatchanin, and H. Wittel, Phys. Rev. D 90, 042001 (2014).
- Liu and Thorne (2000) Y. T. Liu and K. S. Thorne, Phys. Rev. D 62, 122002 (2000).
- Somiya and Yamamoto (2009) K. Somiya and K. Yamamoto, Phys. Rev. D 79, 102004 (2009).
- (27) “Ansys academic research, release 14.5,” .
- Principe et al. (2015) M. Principe, I. M. Pinto, V. Pierro, R. DeSalvo, I. Taurasi, A. E. Villar, E. D. Black, K. G. Libbrecht, C. Michel, N. Morgado, and L. Pinard, Phys. Rev. D 91, 022005 (2015).
- Aasi et al. (2015) J. Aasi et al., Classical and Quantum Gravity 32, 074001 (2015).
- Hong et al. (2013) T. Hong, H. Yang, E. K. Gustafson, R. X. Adhikari, and Y. Chen, Phys. Rev. D 87, 082001 (2013).
- Ballmer (2006) S. W. Ballmer, PhD thesis (2006).
- Winkler et al. (1991) W. Winkler, K. Danzmann, A. Rüdiger, and R. Schilling, Phys. Rev. A 44, 7022 (1991).
- Fritschel (1993) P. Fritschel, Notes on the laser frequency stabilization. Technical Report VIR-NOTLAL-1380-51 (1993).
- Martynov et al. (2016) D. V. Martynov et al., Phys. Rev. D 93, 112004 (2016).
- Granata et al. (2016) M. Granata, E. Saracco, N. Morgado, A. Cajgfinger, G. Cagnoli, J. Degallaix, V. Dolique, D. Forest, J. Franc, C. Michel, L. Pinard, and R. Flaminio, Phys. Rev. D 93, 012007 (2016).