Present Address: ]School of Physical Sciences, National Institute of Science Education and Research, Jatni-752050, India
Centrality dependence of chemical freeze-out parameters from net-proton and net-charge fluctuations using hadron resonance gas model
Abstract
We estimate chemical freeze-out parameters in HRG and EVHRG model by fitting the experimental information of net-proton and net-charge fluctuations measured in Au + Au collisions by the STAR collaboration at RHIC. We observe that chemical freeze-out parameters obtained from lower and higher order fluctuations are though almost same for GeV, tend to deviate from each other at lower . Moreover, these separations increase with decrease of and for a fixed increase towards central collisions. Furthermore, we observe an approximate scaling behaviour of with for the parameters estimated from lower order fluctuations for 11.5 GeV 200 GeV. Scaling is violated for the parameters estimated from higher order fluctuations for and 19.6 GeV. It is observed that the chemical freeze-out parameter, which can describe of net-proton very well in all energies and centralities, can not describe the equally well and vice versa.
pacs:
25.75.-q, 24.60.Ky, 24.10.PaI Introduction
Relativistic heavy ion collisions are investigated both theoretically and experimentally to understand the properties of nuclear matter at extreme conditions. In heavy ion collisions, there is a possibility for the nuclear matter to undergo a phase transition to quark matter. The nature of the phase transition is still not well established. At low baryon chemical potential and high temperature nuclear matter is expected to smoothly cross over Aoki et al. (2006) to a quark gluon plasma (QGP) phase. Whereas, at high baryon chemical potential and low temperature the system is expected to have a first order phase transition Asakawa and Yazaki (1989); Ejiri (2008); Bowman and Kapusta (2009). Therefore, the first-order phase transition at high baryon chemical potential and low temperature should end at a critical end-point (CEP) as one moves towards a high temperature and low baryon chemical potential region in the phase diagram of strongly interacting matter Halasz et al. (1998); Fodor and Katz (2004); Gavai and Gupta (2005); Stephanov (2004). The main goal of experiments of heavy ion collisions is to map the quantum chromodynamics (QCD) phase diagram in terms of temperatures and baryon chemical potentials. One of the main objectives of the beam energy scan (BES) program of RHIC is to investigate the location of CEP. In the near future, CBM experiment at FAIR will also involve in such an investigation along with the other studies of strongly interacting matter at high baryon chemical potentials and low temperatures.
The event-by-event fluctuations of conserved charges like baryon, strangeness, and electric charge are sensitive indicators of the transition from hadronic matter to QGP. Moreover, the existence of the CEP can be signalled by the divergent fluctuations. Therefore, a non-monotonic variation of observables related to the cumulants of the distributions of the above mentioned conserved charges with a variation of centre of mass energy () are believed to be good signatures of a phase transition and a CEP Asakawa et al. (2000); Adamczyk et al. (2014a). However, this non-monotonic behaviour is a necessary but not sufficient condition for the CEP. For example, the singularities associated with first or second order transition, in the infinite volume limit, may become finite peaks due to finite volume effect. Moreover, due to the finite size of the system in heavy ion collisions, non-monotonic behaviour may be indicative of pseudo-critical region which is shifted from the actual critical region Lacey (2015); Ladrem and Ait-El-Djoudi (2005); Palhares et al. (2011).
It may be expected that with the variation of centrality, keeping fixed, similar behaviour as those found for the variation of centre of mass energy would be observed. However, the signatures of phase transition or CEP are detectable only if they survive during the evolution of the system. Several experimental results of conserved charge fluctuations (or cumulants) from BES program have recently been reported at various energies and centralities Adamczyk et al. (2014a, b); Adare et al. (2016). However, these data do not show non-monotonic behaviour as a function of . On the other hand, a new analysis of net proton moments have been reported by STAR collaboration Luo (2015) where the upper coverage for proton and anti-proton has been extended up to 2 GeV using the time of flight (ToF) detector. In this analysis a non-monotonic behaviour for higher order cumulants () at lower has been reported indicating a probable CEP like behaviour. Finite system size may also cause this non-monotonic behaviour. In principle such effects may be estimated from the ratio of cumulants, as discussed in Bhattacharyya et al. (2015) using Hadron resonance gas (HRG) model for illustration. It has been shown that though for net proton and net kaon the cumulant ratios are almost volume independent, the cumulant ratios of net charge are highly sensitive to the system volume. This is mainly due to the contribution of pions which are extremely light in the hadronic scale.
Fluctuations which are related to the thermodynamic susceptibilities via fluctuation-dissipation theorem Kubo (1966) can be studied using LQCD or models. However, since cumulants are volume dependent, ratios of cumulants are constructed to cancel volume term and they are related to the ratios of the different order of susceptibilities. Therefore, it is possible to extract chemical freeze-out parameters like temperature and chemical potential by comparing experimentally measured ratios of cumulants with ratios of susceptibilities calculated in LQCD or in a model Borsanyi et al. (2014); Alba et al. (2014). Thus the ratios of cumulants of conserved charges provide important information about chemical freeze-out parameters which is useful to locate CEP in the phase diagram. However, at finite chemical potential, LQCD faces the well-known sign problem. As a result, the region of very high chemical potential in the phase diagram can not be studied in LQCD presently. Moreover, it is not possible to employ experimental acceptance cuts in LQCD calculation. On the other hand, hadron resonance gas (HRG) model Hagedorn and Rafelski (1980); Rischke et al. (1991); Cleymans et al. (1993); Braun-Munzinger et al. (1995); Cleymans et al. (1997); Yen et al. (1997); Braun-Munzinger et al. (1999); Cleymans and Redlich (1999); Braun-Munzinger et al. (2001, 2003); Karsch et al. (2003); Tawfik (2005); Becattini et al. (2006); Andronic et al. (2006, 2009); Begun et al. (2013); Andronic et al. (2012); Tiwari et al. (2012); Fu (2013); Tawfik (2013); Garg et al. (2013); Bhattacharyya et al. (2014, 2015); Kadam and Mishra (2015, 2016); Kadam (2015); Albright et al. (2014, 2015); Begun (2016) provides us with a simpler model for the study of the strongly interacting matter in the non-perturbative domain. HRG model is based on the assumption of thermal equilibrium of a system composed of free hadrons and resonances. One may estimate the commensurate chemical freeze-out parameters by fitting the experimental data of various hadronic observables with the HRG model Cleymans et al. (2006); Xu and Kaneta (2002); Becattini et al. (2006); Andronic et al. (2006, 2010); Karsch and Redlich (2011a); Chatterjee et al. (2015). Also the susceptibilities of conserved charges calculated in LQCD have been well reproduced by HRG model Karsch et al. (2003); Tawfik (2005); Andronic et al. (2012); Bhattacharyya et al. (2014) for temperatures up to 150 MeV. Moreover the region of large chemical potential in the phase diagram, which can be accessed by low energy heavy ion collisions, can be studied by this model. Since, one can incorporate proper experimental acceptances in this model, it can be used to estimate chemical freeze-out parameters by fitting experimental data of the ratios of cumulants of conserved charges. It should be noted however that the final parameters are still model dependent.
Here we would like to emphasise the salient feature of our present study. If the system becomes thermalised well ahead of freeze-out, then all the observables would carry the signature of thermalisation. In such a scenario the observed hadrons should have a clear thermodynamic equilibrium distribution. Therefore a thermal model like HRG would show a very good agreement with the data up to all orders. Any difference from this scenario may point towards a more complex system and our attempt here is to find such discrepancies in the parametrisation of the HRG model from various experimental data and gain some insight about the system.
The paper is organised as follows. The ideal and excluded volume hadron resonance gas model are introduced in Sec. II. In Sec. III we have briefly discussed fluctuations of conserved charges and several relevant experimental observables. Then in Sec. IV we have discussed results of this paper. Finally, we summarise our results in Sec. V.
II Hadron Resonance Gas model
In HRG model, the system of thermal fireball consists of all the hadrons and resonances given in the particle data book Olive et al. (2014). There are varieties of HRG models in the literature. Different versions of this model and some of the recent works using these models may be found in Refs Hagedorn and Rafelski (1980); Rischke et al. (1991); Cleymans et al. (1993); Braun-Munzinger et al. (1995); Cleymans et al. (1997); Yen et al. (1997); Braun-Munzinger et al. (1999); Cleymans and Redlich (1999); Braun-Munzinger et al. (2001, 2003); Karsch et al. (2003); Tawfik (2005); Becattini et al. (2006); Andronic et al. (2006, 2009); Begun et al. (2013); Andronic et al. (2012); Tiwari et al. (2012); Fu (2013); Tawfik (2013); Garg et al. (2013); Bhattacharyya et al. (2014, 2015); Kadam and Mishra (2015, 2016); Kadam (2015); Albright et al. (2014, 2015); Begun (2016). HRG model is not only successful in describing the hadron yields in central heavy ion collisions from AGS up to RHIC energies Braun-Munzinger et al. (1995); Cleymans et al. (1997); Braun-Munzinger et al. (1999); Cleymans and Redlich (1999); Braun-Munzinger et al. (2001); Becattini et al. (2006); Andronic et al. (2006, 2009) but also in describing the bulk properties of hadronic matter in thermal and chemical equilibrium Karsch et al. (2003); Tawfik (2005); Andronic et al. (2012). The logarithm of the grand canonical partition function of a hadron resonance gas can be written as Andronic et al. (2012),
| (1) |
where the sum is over all the hadrons. refers to ideal i.e., non-interacting HRG. For particle species ,
| (2) |
where is the volume of the system, is the degeneracy factor, is the temperature, is the single particle energy, is the mass and is the chemical potential. In the last expression, are respectively the baryon number, strangeness and charge of the particle, are corresponding chemical potentials. The upper and lower sign corresponds to baryons and mesons respectively. We assume that the hadronic matter is in thermal and chemical equilibrium therefore we have ignored non-equilibrium phenomena like decays of particles along with minimum biased jets and harmonisation. We have ignored the effect of parton fragmentation into hadrons which produces very significant correlations at lower energies and in peripheral collisions as high as 200 GeV Trainor and Kettler (2011); Trainor et al. (2012). In addition, at lower collision energies stopping becomes important which has not been considered here. The partition function is the basic quantity from which one can calculate various thermodynamic quantities of the thermal system. The number density of th particle is defined as,
| (3) |
In case of heavy ion collision experiments, the parameters and of HRG model corresponds to those at chemical freeze-out which depend on initial conditions of the collision. The chemical potentials and are not independent, but related (on average) to each other as well as to via the relations Alba et al. (2014),
| (4) |
and
| (5) |
where is the ratio of net-charge to net-baryon number of the colliding nuclei. For Au + Au collisions , where and are respectively proton numbers and neutron numbers of the colliding nuclei. The Eq. 4 is due to fact that initially there is no net-strangeness in the colliding nuclei. In terms of transverse momentum and pseudo-rapidity (), the volume element and the single particle energy can be written as and , respectively. Instead of pseudo-rapidity, one can use rapidity () as well. In that case and respectively can be written as and , where . The experimental acceptances can be incorporated by considering the appropriate integration ranges, either in and or in and .
II.1 Excluded volume corrections
In ideal HRG model point like particles are considered. Although, attractive interactions between hadrons are incorporated through the presence of resonances, repulsive interactions are ignored in this framework. This simple model has few parameters only. Despite its simplicity, this model successfully describes the bulk properties of the system created in heavy ion collisions. The repulsive interactions are also needed, especially at very high temperature and/ or large baryon chemical potential, to catch the basic qualitative features of strong interactions where ideal gas assumption becomes inadequate. In the EVHRG model Hagedorn and Rafelski (1980); Rischke et al. (1991); Cleymans et al. (1993); Yen et al. (1997); Begun et al. (2013); Andronic et al. (2012); Fu (2013); Tawfik (2013); Bhattacharyya et al. (2014); Kadam and Mishra (2015, 2016); Kadam (2015); Albright et al. (2014, 2015), hadronic phase is modelled by a gas of interacting hadrons, where the geometrical sizes of the hadrons are explicitly incorporated as the excluded volume correction, to approximate the short-range repulsive hadron-hadron interaction.
III Fluctuations of conserved charges
Derivatives of the with respect to corresponding chemical potential define susceptibilities, which experimentally become accessible through event-by-event analysis of fluctuations of conserved quantities such as net-baryon number, net-charge, net-strangeness and others.
The order susceptibility is defined as,
| (6) |
where is the chemical potential for conserved charge .
Experimentally net-charges () are measured in a finite acceptance on an event by event basis. The mean (), variance (), skewness () and kurtosis () of net-charge distribution are related to the different order of susceptibilities by the following relations:
| (7) |
| (8) |
| (9) |
| (10) |
where . The mean, variance, skewness and kurtosis are respectively estimations of the most probable value, width, asymmetry and the peakedness of the distribution. From the above equations, volume independent ratios can be defined by the following relations:
| (11a) | |||
| (11b) | |||
| (11c) | |||
where is the th order cumulants of the charge distribution. The STAR collaboration has reported results of the above-mentioned observables of net-proton and net-charge at different energies ranging from GeV to GeV and at various centralities Adamczyk et al. (2014a, b). The PHENIX collaboration has also reported results of similar observables for net-charge Adare et al. (2016). Non-monotonic variations of these ratios with beam energy () and also with centrality at a fixed are believed to be good signatures of a phase transition and a CEP. These observables have also been studied in different models Bhattacharyya et al. (2014); Garg et al. (2013); Alba et al. (2014); Bhattacharyya et al. (2015); Albright et al. (2015); Karsch et al. (2016a); Ichihara et al. (2015); Xu (2016a, b) and also in LQCD Gupta et al. (2011); Karsch and Redlich (2011b); Karsch et al. (2016b); Bazavov et al. (2016). Recently and for charged pions have been studied using non-equilibrium HRG model Begun (2016).
IV Results
In this paper, we have studied fluctuations of net-proton and net-charge using HRG as well as its interacting version EVHRG model. In Ref. Fu (2013); Bhattacharyya et al. (2014), it was shown that the ratios of higher order cumulants are affected by the excluded volume corrections. Further, it was shown that experimental data of for net-proton as well as for net-charge in central Au + Au collisions Bhattacharyya et al. (2014) can be described quite well using this model. Not only that, , can also be described within experimental error for GeV. Therefore, it is very important to consider EVHRG model for the study of fluctuations of conserved charges. On the other hand ratio of cumulants depend on acceptance cuts as well Garg et al. (2013); Bhattacharyya et al. (2014); Karsch et al. (2016a). Therefore, in this work we have used the HRG / EVHRG model with proper experimental acceptances. For our present study we constrained the chemical freeze-out temperature and chemical potentials using some of the net-charge and net-proton measured cumulants and then predicted the others in order to test the model. In all our calculations, we have incorporated all the hadrons listed in the particle data book up to a mass of 3 GeV Olive et al. (2014).
IV.1 Centrality dependence of chemical freeze-out parameters
| Sets of parameters | Experimental data used | Model used |
|---|---|---|
| CFO1 | HRG | |
| CFO2 | EVHRG | |
| CFO3 | , | HRG |
| CFO4 | , | EVHRG |
The thermal fireball created due to heavy ion collision expands and cools. After some time inelastic collisions among the particles stop and hence particle yields (or particle ratios) get fixed. This stage is called chemical freeze-out. From the experimental information about particle yields or particle ratios, chemical freeze-out temperature and baryon chemical potential can be estimated Cleymans et al. (2006); Xu and Kaneta (2002); Becattini et al. (2006); Andronic et al. (2006, 2010); Karsch and Redlich (2011a); Chatterjee et al. (2015). Chemical freeze-out parameters are reported to be independent of centrality Kaneta and Xu (2004); Cleymans et al. (2005). However, we wanted to revisit the centrality dependence of chemical freeze‐out parameters through the study of higher order cumulants in Au + Au collisions. Therefore, in this paper, we estimate chemical freeze-out temperatures and chemical potentials within HRG model, at different energies as well as at different centralities using the experimentally measured ratios of cumulants of net-proton and net-charge measured in Au + Au collisions by STAR collaboration at RHIC Adamczyk et al. (2014a, b).
Net-proton fluctuations were experimentally measured in the mid rapidity () and within transverse momentum GeV. On the other hand, net-charge fluctuations were measured in pseudo-rapidity range and within transverse momentum range GeV (removing net-proton of GeV) Adamczyk et al. (2014b). Same acceptances have been used in the HRG / EVHRG model in the present study. We have considered hard core radii fm for all the hadrons whenever EVHRG is used. Four sets of chemical freeze-out parameters, listed in table 1, have been used in order to describe , and of net proton and net-charge.
Here we would like to discuss the modus operandi for the estimation of parameter sets listed in table 1. We have three experimental cumulant ratios , and for net charge and net proton. It should be noted that has smaller experimental errors compared to and . Not only that, experimental errors are smaller for net-proton fluctuations compared to net-charge data. In order to evaluate the chemical freeze-out parameters from these observables at a particular and centrality, we use minimisation technique where is defined as,
| (12) |
where is the number of observables, is the observable with and being its experimental values and errors respectively (statistical error has been used here). Error bars in the evaluated freeze-out parameters correspond to . We have taken care of the conservation laws Eqs. 4 and 5 in the evaluation of chemical freeze-out parameters.
First we obtained freeze-out parameters using only lower order cumulant ratios of net-charge and net-proton. For this we have the two sets CFO1 (HRG) and CFO2 (EVHRG). Then we wanted to check if the freeze-out parameters estimated including the higher order cumulant for net-charge and net-proton agrees with the above set. We found that the extremely high precision of experimental data for of net-proton completely biases the minimisation to agree with the earlier set. So finally we used and of net-charge and of net-proton to extract the second set of parameters CFO3 (HRG) and CFO4 (EVHRG). Note that if equilibration is complete then any combination of observables should reproduce mutually agreeable set of fitting parameters.

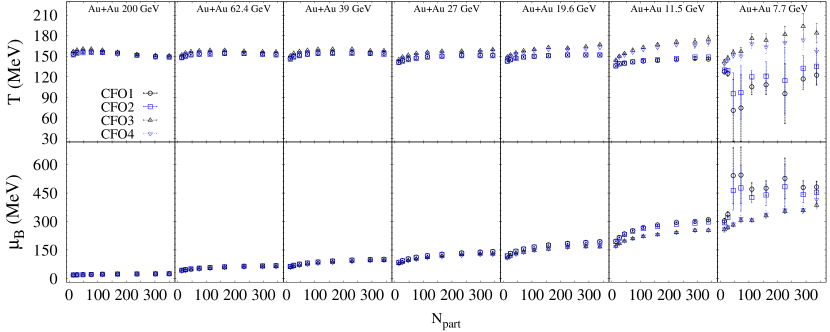
Figure 1 shows centrality dependence of chemical freeze-out at different from GeV up to GeV. Four sets of chemical freeze-out parameters (CFO1 - CFO4) have been plotted. The average number of participant () is maximum for most central () collision whereas it is minimum for most peripheral () collision. In this figure decreases column wise. The leftmost column of Fig. 1 corresponds to the highest beam energy GeV whereas the right most column corresponds to GeV.
One would expect that with higher the particle production would be higher and give rise to a high freeze-out temperature. On the other hand for low particle production would be less and the collision participants would also contribute actively to the system properties (due to baryon stopping). Thus observed temperature may be low but baryon chemical potential may be large. Note that for complete equilibration at freeze-out, all evolutionary history of the system will be erased. This will be reflected in the agreement of thermodynamic parameters fitted from all possible experimental observables. On the other hand, for incomplete equilibration certain discrepancies among the thermodynamic parameters fitted from different observables may arise. On top of that the presence of jets, hadronic decays, as well as interactions among the hadrons beyond those considered through the excluded volume effects, may also show deviation of the system from that expected from the HRG picture used to model the system.
It can be seen from Fig. 1 that chemical freeze-out temperatures of CFO1 and CFO3 (or CFO2 and CFO4) are almost the same for GeV. There are significant separations between these two sets of parameters for GeV, and these separations increase towards central collisions for a fixed . Not only that, these separations increase with the decrease of . Overall the spread in temperature for the whole range of and centrality is within 140-180 MeV. On the other hand the magnitudes of chemical freeze-out baryon chemical potentials () increase with decrease of as well as increase in centrality by about two orders of magnitude. The occurrence of high net-baryon density is expected when the participant nucleons are deposited in the collision region. More or less similar behaviour of is reported in Ref. Kumar (2012); Das (2015); Yu et al. (2014) where chemical freeze-out parameters are extracted analysing particle yields measured experimentally Kumar (2012); Das (2015) or generated by the event generator Yu et al. (2014). The separation of the parameters obtained from CFO1 and CFO3 (or CFO2 and CFO4) are also observed here, but in the opposite direction. The lower order cumulants thus seems to equilibrate with lower temperature and higher density than the higher order cumulants.
The conclusion that one can draw from this observation is that the system formed in the heavy ion collision has not completely equilibrated if we consider only the HRG model to describe it. However it is possible that HRG picture, if suitably modified, may lead to the scenario as found in Fig. 1. Here the question is whether there are any possibilities such that one can find a multicomponent system with different equilibrium parameters that can systematically explain the observed discrepancy for the fitted parameters.
At this point it is tempting to propose a possible scenario that may give rise to such an agreement of thermodynamic parameters for higher and deviations found for lower . We first assume that in the region of lower values of the effects coming from the jets are quite small, and hence are not responsible for this deviation. Now if the system has thermalised near or above the phase transition region and then evolved down to the hadronic phase then one can qualitatively describe the situation as follows. For a cross-over region the system undergoes rapid changes from partonic to hadronic phase, but all the components can still follow a given equilibrium condition at all times. This is expected to happen for large . However near the critical point, correlation length would tend to infinity and there would be a large enhancement in the fluctuations. In a realistic situation, as in heavy ion collisions, dynamical variables are functions of time. As the system moves towards the critical region, relaxation time increases and at some point the system may expand too fast to maintain thermodynamic equilibrium. So the correlation length gets constrained due to this critical slowing down Ma (1976) and becomes frozen at some time. But the system expansion continues further. This situation may lead to the difference in the information carried by the different order of cumulants. More specifically, second, third and fourth order cumulants of multiplicities are related to the correlation length by the relations , and respectively Stephanov (2009). This, in turn, implies that for higher order cumulants their relaxation time to the equilibrium values may be considerably larger compared to those of lower order cumulants. So in the final spectrum, higher order cumulants are expected to carry the information of the system farther from equilibrium compared to lower cumulants. For example, compared to lower moments, the temperature evaluated using the higher moments may be larger as being away from equilibrium system is hotter. This is what we observe for lower i.e. temperatures of CFO3 / CFO4, where third order fluctuations are involved, are larger compared to that of CFO1 / CFO2 for GeV, the corresponding chemical potential being smaller than that of CFO1/CFO2. Incidentally this is the range of temperature and baryon chemical potential where close to which the critical end point is expected to lie. Availability of higher moment data with much better statistics is extremely essential for further constraining this picture. We however emphasise that this is only a plausibility argument for effects of a CEP to modify the simple HRG parameters with different cumulants. A systematic study of various other dynamical effects would be required to ascertain how far this picture is valid Luo et al. (2014); Netrakanti et al. (2016). Another important caveat is that the contributions due to purely statistical fluctuations in the cumulants reported by the STAR experiment are not subtracted from the variances and rely on models for and . Therefore, the sensitivity of the reported cumulants to dynamical effects is ambiguous. In fact it is even difficult to ascertain whether the statistical fluctuations in the data may overwhelm the critical fluctuations or not.
Figure 2 shows chemical freeze-out parameters for 0-5 and in the () plane. In this figure, we also compare our results of chemical freeze-out parameters with previous works Alba et al. (2014); Chatterjee et al. (2015). In Alba et al. (2014), chemical freeze-out parameters for most central collisions were estimated using the experimental data of of net-proton and net-charge. In their model they considered effect of the resonance decays, experimental acceptances and randomisation of the isospin of nucleons in the hadronic phase. They excluded chemical freeze-out parameters for GeV. It can be seen that our chemical freeze-out parameters of CFO1 / CFO2 for centrality are very close to that of Alba et al. (2014) for GeV. Moreover, the agreement is slightly better for CFO2. Interesting point is that, with decrease of from GeV, chemical freeze-out increases up to GeV then it decreases at GeV and becomes almost flat up to GeV and then again decreases. In contrast, the chemical freeze-out increases with decrease of in the whole range of . This behaviour of chemical freeze-out is in contradiction to what has been reported in the Refs. Cleymans et al. (2006); Xu and Kaneta (2002); Becattini et al. (2006); Andronic et al. (2006, 2010); Karsch and Redlich (2011a); Tiwari et al. (2012); Chatterjee et al. (2015) where chemical freeze-out parameters have been extracted from particle multiplicities. We plot chemical freeze-out and of Ref. Chatterjee et al. (2015) for comparison. Refs. Cleymans et al. (2006); Xu and Kaneta (2002); Becattini et al. (2006); Andronic et al. (2006, 2010); Karsch and Redlich (2011a); Tiwari et al. (2012); Chatterjee et al. (2015) showed that chemical freeze-out rapidly increases with the increase of in SIS-AGS-SPS energy range and then saturates at top RHIC energy. However, behaviour of chemical freeze-out reported in these references were similar. In Fig. 2 we also show chemical freeze-out of CFO3/ CFO4. For both CFO3 and CFO4, chemical freeze-out increases with decrease of for GeV GeV and the temperatures are larger compared to that of CFO1 / CFO2. Although the fast rise of for higher moments as found in HRG, seems to have slowed down for EVHRG as seen in the figure for CFO4., all the chemical freeze-out parameters are within certain band in the () plane. Recently, the possibility of larger chemical freeze-out temperature is indicated also at LHC energy Vovchenko and Stoecker (2017).
IV.2 Scaling behaviour of
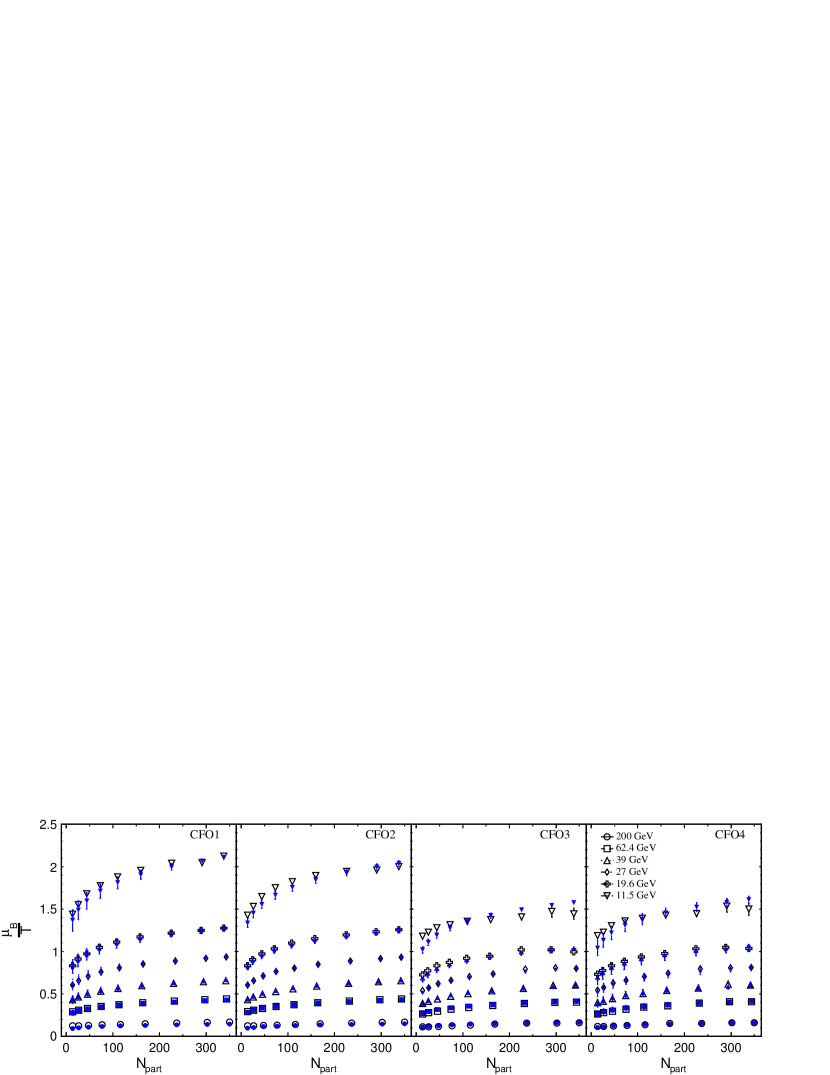
The Fig. 3 shows variation of with . increases with increase of for all energies for all four parameter sets. Moreover, increases with decrease of . It can also be seen that for CFO1 / CFO2 are larger compared to CFO3 / CFO4 and differences between the parameters of CFO1 and CFO3 (or CFO2 and CFO4), as shown in Fig. 2, increase when the value of is close to or greater than unity. In order to separate the effects of and , can be expressed by the relation,
| (13) |
where and are three parameters. In this equation, first part depends only on while second part depends only on . For fitting purpose we have simultaneously used of GeV to GeV for CFO1 / CFO2 and GeV to GeV for CFO3 /CFO4 for which per degree of freedom (ndf) is minimum. All the fitting parameters are listed in the table 2. The quality of fitting is quite good as can be seen from the figure. The fitted parameters are then used to estimate for remaining energies. It can be seen that, for the sets CFO1 / CFO2, the from Eq. 13 slightly underestimates the extracted for GeV and GeV. On the other hand, for CFO3/ CFO4, evaluated using Eq. 13 slightly underestimates the extracted for peripheral collisions of GeV and slightly overestimates towards central collisions.
| CFO | Using of | ||||
|---|---|---|---|---|---|
| CFO1 | 19.6-62.4 | 0.13 | |||
| CFO2 | 19.6-62.4 | 0.17 | |||
| CFO3 | 27-200 | 0.53 | |||
| CFO4 | 27-200 | 0.11 |
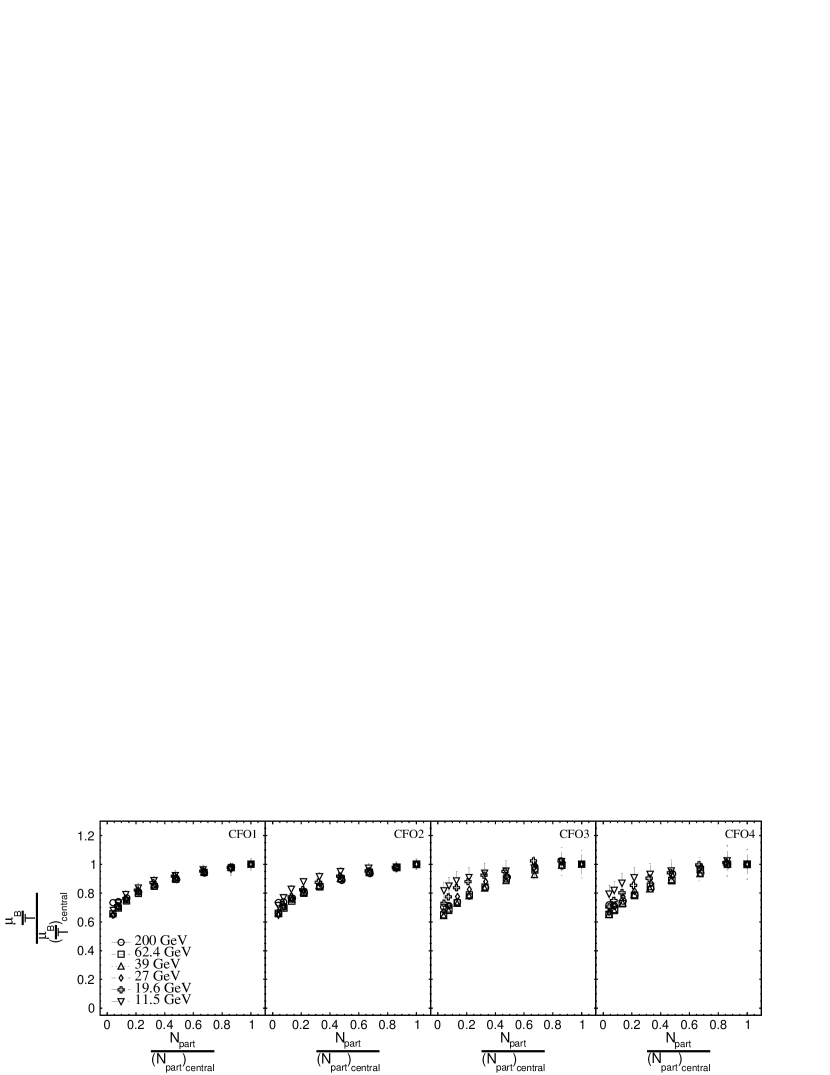
In the Fig. 4, we have explored the scaling behaviour of with . Quantities in both the axes have been normalised to the corresponding values in the most central collisions. As a result, the maximum value in the horizontal axis (equals to unity) corresponds to most-central collision () and its value decreases towards most peripheral collisions (). It can be seen that increases with increase in for all the from GeV down to GeV. For most peripheral collisions, become within of that of central collisions. for all the seem to scale well for the parameter sets CFO1/CFO2. On the other hand, scaling is found to be violated at lower for CFO3 / CFO4. The violation is large for GeV and small for GeV. This violation of scaling may again be interpreted as due to possible critical behaviour at lower , apart from being caused by other dynamical effects, as already discussed earlier. It can be noted that here separations are observed towards lower values of the horizontal axis because we have normalised both the axes with the corresponding values in the most central collisions. However, normalisation of the axes with corresponding values from most peripheral collisions would have resulted in separations towards higher values of the horizontal axis. In the above discussion GeV have been excluded due to large error bars.
IV.3 Comparison with experimental data
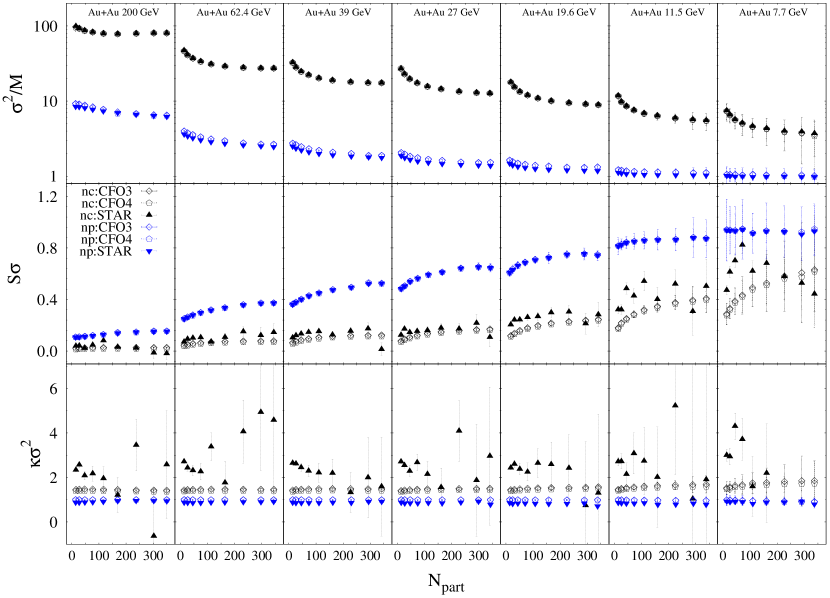
Here we have used the extracted freeze-out parameters CFO1 and CFO2 to calculate the , and of net-proton and net-charge using HRG and EVHRG model respectively. Note that for these two sets, chemical freeze-out parameters were estimated from experimental data of only. We have compared our results with experimental data of fluctuations measured in Au + Au collisions by STAR collaboration Adamczyk et al. (2014a, b). As mentioned earlier the experimental acceptances have been incorporated in our model calculation as well.
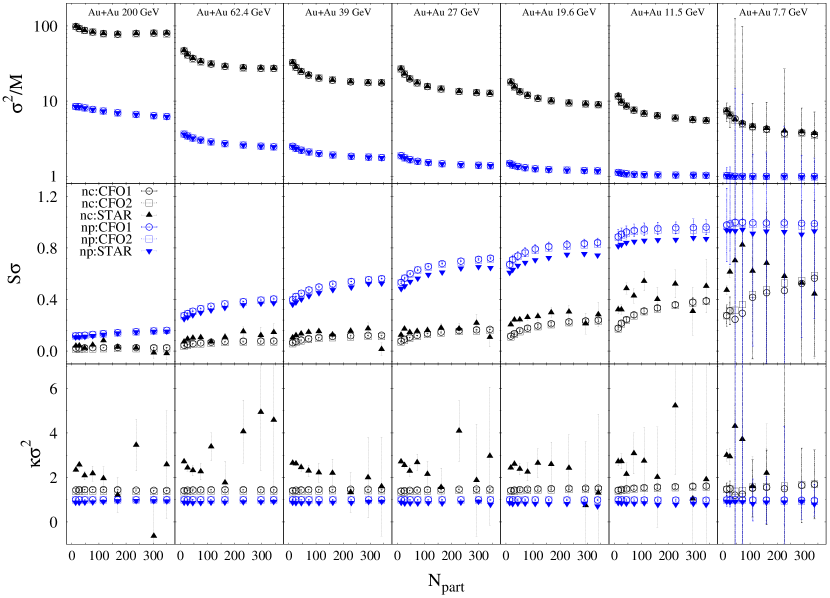
In the top row of Fig. 5, we have shown centrality dependence of of net-proton and net-charge at different beam energies. In this figure varies column wise. Blue and black points have been used for net-proton and net-charge respectively in this figure. For both net-proton and net-charge decreases with increase of for all . It can be seen that the ratios of lowest order susceptibilities ( ) of net-proton and net-charge can be reproduced quite well using the CFO1 and CFO2 parameters in our model.
We now evaluate the higher order susceptibility ratios using these two parameter sets. The middle row of Fig. 5 shows centrality dependence of of net-proton and net-charge. The quantity for both net-proton and net-charge increases with increasing for GeV. Experimental data of of net-proton also shows a similar trend.
The experimental data of of net-proton matches within the error bar for GeV. However, its value is overestimated at lower energies ( GeV). On the other hand of net-charge calculated in the HRG / EVHRG model are close to or within the error bars of experimental data for all centralities at GeV and for GeV most central data matches within error bars. In general of net-charge shows a monotonic behaviour and differs considerably from experimental data.
In the bottom row of Fig. 5 we have shown centrality dependence of of net-proton and net-charge. The for net-proton calculated in our model using CFO1 / CFO2 are almost independent of centrality for GeV and below that energy it decreases slightly with increase of . For all , of net-proton calculated in the HRG / EVHRG model are within the error bars or very close to the experimental data. The experimental data of for net-charge matches within the error bar with the HRG / EVHRG model results as we go towards central collisions for GeV.
Therefore we see that the HRG prediction of higher order cumulants calculated from the estimated freeze-out thermodynamic parameters for the lower order cumulants do not match the experimental data in general. This implies that the equilibration at freeze-out is not quite comprehensive vis-a-vis the HRG model. We can further check what happens when we consider one more higher order cumulant as discussed below.
Fig. 6 correspond to similar plot, as in Fig. 5, for parameter sets CFO3 and CFO4. While for both net-proton and net-charge show consistency when compared to the experimental data as shown in the top row, the use of CFO3 / CFO4 in the HRG / EVHRG model, show clear improvement in agreement with experimental data of for net-proton at all as shown in the middle row. On the other hand, there is almost no change in the results for of net-charge. Once again we find that the prediction for for net-proton agrees well with experimental data whereas that for net-charge does not. This further reaffirms that the matter formed in heavy ion collision system does not conform to a system of completely equilibrated hadron gas.
V Discussion and Conclusion
We have extracted the chemical freeze-out parameters by fitting the experimental data of cumulants of net-proton and net-charge measured by STAR collaboration using both HRG and EVHRG model. We have incorporated the proper experimental acceptances in our calculation. However, the dynamical effects such as particle decay, minimum biased jet, baryon stopping are not considered in the present study. The experimental data of of both net-proton and net-charge have been used to estimate chemical freeze-out parameters CFO1 / CFO2. On the other hand, parameters CFO3 / CFO4 have been estimated using the experimental data of of net-charge and of both net-proton and net-charge. For CFO1 and CFO3, HRG model has been used, whereas for CFO2 and CFO4, EVHRG has been used.
The chemical freeze-out parameters evaluated using lower order cumulants (CFO1/CFO2) starts deviating from the one obtained using higher order cumulants (CFO3/CFO4) around GeV as one goes from GeV towards lower energies. Among other possibilities, transition of the system close to the critical region may contribute to the requirement of multiple parametrisation in HRG for various orders of cumulants. In case of lower energies one need to take into account the baryon stopping as well. In these regions of low energies HRG and EVHRG starts deviating from each other as well due to the effect of repulsive interaction in EVHRG.
We observe that the effect of centrality and beam energy in can be separated. This separation leads to a scaling of with . Though the scaling is very good for CFO1 / CFO2, a deviation is observed for CFO3 / CFO4 especially in the region GeV. The study of such scaling behaviour will be useful to search for CEP which is the main goal of the ongoing STAR experiment and the future CBM experiment.
Experimental data of lowest order susceptibilities ( ) of net-proton and net-charge can be reproduced quite well using the CFO1 and CFO2 in the HRG / EVHRG model. The experimental data of of net-proton match within the error bar for GeV for these two sets of parameters. However, it is overestimated at lower beam energies ( GeV). On the other hand of net-charge calculated in the HRG / EVHRG model using CFO1 / CFO2 are close to or within the error bars for GeV and they are within the error bars for more central data at lower . For all , of net-proton calculated in the HRG / EVHRG model using CFO1 / CFO2 are within the error bars or very close to the experimental data. The experimental data of for net-charge matches within the error bar with the HRG / EVHRG model results calculated using CFO1 / CFO2 as we move towards central collisions for GeV, but underestimate the data for peripheral collisions. This points to the incomplete equilibrium distribution of the particles observed in data. On the other hand experimental data of of net-proton can be described well at all in the HRG / EVHRG model using CFO3 / CFO4. In addition, both the parameter sets give satisfactory description of of net-proton and net-charge. However the for both net-proton and net-charge calculated in the HRG / EVHRG model using CFO3 / CFO4 are similar to those calculated using CFO1 / CFO2. In this set again we found the signature of incomplete equilibration of the system formed in heavy ion collision experiments.
Thus we conclude that the freeze-out parameters, which can describe lower order cumulant ratios very well in all energies and centralities, can’t describe the higher order cumulant ratios equally well. It is difficult to pin-point all the reasons for such disagreement unless all the dynamical effects are accounted for. Looking at the systematic deviation of the thermodynamic parameters we could only present a plausibility argument for the system passing near a critical region. Precise experimental data of along with few more around GeV will be extremely useful for further investigation in this direction.
Acknowledgements
This work is funded by CSIR, UGC, and DST of the Government of India. We acknowledge the STAR collaboration for the experimental data. SS thanks Sabita Das for providing chemical freeze-out parameters of Ref. Chatterjee et al. (2015). We would like to thank Bedangadas Mohanty for useful discussions.
References
- Aoki et al. (2006) Y. Aoki, G. Endrodi, Z. Fodor, S. D. Katz, and K. K. Szabo, Nature 443, 675 (2006).
- Asakawa and Yazaki (1989) M. Asakawa and K. Yazaki, Nucl. Phys. A504, 668 (1989).
- Ejiri (2008) S. Ejiri, Phys. Rev. D78, 074507 (2008).
- Bowman and Kapusta (2009) E. S. Bowman and J. I. Kapusta, Phys. Rev. C79, 015202 (2009).
- Halasz et al. (1998) A. M. Halasz, A. D. Jackson, R. E. Shrock, M. A. Stephanov, and J. J. M. Verbaarschot, Phys. Rev. D58, 096007 (1998).
- Fodor and Katz (2004) Z. Fodor and S. D. Katz, JHEP 04, 050 (2004).
- Gavai and Gupta (2005) R. V. Gavai and S. Gupta, Phys. Rev. D71, 114014 (2005).
- Stephanov (2004) M. A. Stephanov, Non-perturbative quantum chromodynamics. Proceedings, 8th Workshop, Paris, France, June 7-11, 2004, Prog. Theor. Phys. Suppl. 153, 139 (2004), [Int. J. Mod. Phys.A20,4387(2005)].
- Asakawa et al. (2000) M. Asakawa, U. W. Heinz, and B. Muller, Phys. Rev. Lett. 85, 2072 (2000).
- Adamczyk et al. (2014a) L. Adamczyk et al. (STAR), Phys. Rev. Lett. 112, 032302 (2014a).
- Lacey (2015) R. A. Lacey, Phys. Rev. Lett. 114, 142301 (2015).
- Ladrem and Ait-El-Djoudi (2005) M. Ladrem and A. Ait-El-Djoudi, Eur. Phys. J. C44, 257 (2005).
- Palhares et al. (2011) L. F. Palhares, E. S. Fraga, and T. Kodama, J. Phys. G38, 085101 (2011).
- Adamczyk et al. (2014b) L. Adamczyk et al. (STAR), Phys. Rev. Lett. 113, 092301 (2014b).
- Adare et al. (2016) A. Adare et al. (PHENIX), Phys. Rev. C93, 011901 (2016).
- Luo (2015) X. Luo (STAR), Proceedings, 9th International Workshop on Critical Point and Onset of Deconfinement (CPOD 2014): Bielefeld, Germany, November 17-21, 2014, PoS CPOD2014, 019 (2015).
- Bhattacharyya et al. (2015) A. Bhattacharyya, R. Ray, S. Samanta, and S. Sur, Phys. Rev. C91, 041901 (R) (2015).
- Kubo (1966) R. Kubo, Reports on Progress in Physics 29, 255 (1966).
- Borsanyi et al. (2014) S. Borsanyi, Z. Fodor, S. D. Katz, S. Krieg, C. Ratti, and K. K. Szabo, Phys. Rev. Lett. 113, 052301 (2014).
- Alba et al. (2014) P. Alba, W. Alberico, R. Bellwied, M. Bluhm, V. Mantovani Sarti, M. Nahrgang, and C. Ratti, Phys. Lett. B738, 305 (2014).
- Hagedorn and Rafelski (1980) R. Hagedorn and J. Rafelski, Phys. Lett. B97, 136 (1980).
- Rischke et al. (1991) D. H. Rischke, M. I. Gorenstein, H. Stoecker, and W. Greiner, Z. Phys. C51, 485 (1991).
- Cleymans et al. (1993) J. Cleymans, M. I. Gorenstein, J. Stalnacke, and E. Suhonen, Phys. Scripta 48, 277 (1993).
- Braun-Munzinger et al. (1995) P. Braun-Munzinger, J. Stachel, J. P. Wessels, and N. Xu, Phys. Lett. B344, 43 (1995).
- Cleymans et al. (1997) J. Cleymans, D. Elliott, H. Satz, and R. L. Thews, Z. Phys. C74, 319 (1997).
- Yen et al. (1997) G. D. Yen, M. I. Gorenstein, W. Greiner, and S.-N. Yang, Phys. Rev. C56, 2210 (1997).
- Braun-Munzinger et al. (1999) P. Braun-Munzinger, I. Heppe, and J. Stachel, Phys. Lett. B465, 15 (1999).
- Cleymans and Redlich (1999) J. Cleymans and K. Redlich, Phys. Rev. C60, 054908 (1999).
- Braun-Munzinger et al. (2001) P. Braun-Munzinger, D. Magestro, K. Redlich, and J. Stachel, Phys. Lett. B518, 41 (2001).
- Braun-Munzinger et al. (2003) P. Braun-Munzinger, K. Redlich, and J. Stachel, Quark-Gluon Plasma, 3, 491 (2003).
- Karsch et al. (2003) F. Karsch, K. Redlich, and A. Tawfik, Phys. Lett. B571, 67 (2003).
- Tawfik (2005) A. Tawfik, Phys. Rev. D71, 054502 (2005).
- Becattini et al. (2006) F. Becattini, J. Manninen, and M. Gazdzicki, Phys. Rev. C73, 044905 (2006).
- Andronic et al. (2006) A. Andronic, P. Braun-Munzinger, and J. Stachel, Nucl. Phys. A772, 167 (2006).
- Andronic et al. (2009) A. Andronic, P. Braun-Munzinger, and J. Stachel, Phys. Lett. B673, 142 (2009), [Erratum: Phys. Lett.B678,516(2009)].
- Begun et al. (2013) V. V. Begun, M. Gazdzicki, and M. I. Gorenstein, Phys. Rev. C88, 024902 (2013).
- Andronic et al. (2012) A. Andronic, P. Braun-Munzinger, J. Stachel, and M. Winn, Phys. Lett. B718, 80 (2012).
- Tiwari et al. (2012) S. K. Tiwari, P. K. Srivastava, and C. P. Singh, Phys. Rev. C85, 014908 (2012).
- Fu (2013) J. Fu, Phys. Lett. B722, 144 (2013).
- Tawfik (2013) A. Tawfik, Phys. Rev. C88, 035203 (2013).
- Garg et al. (2013) P. Garg, D. K. Mishra, P. K. Netrakanti, B. Mohanty, A. K. Mohanty, B. K. Singh, and N. Xu, Phys. Lett. B726, 691 (2013).
- Bhattacharyya et al. (2014) A. Bhattacharyya, S. Das, S. K. Ghosh, R. Ray, and S. Samanta, Phys. Rev. C90, 034909 (2014).
- Kadam and Mishra (2015) G. P. Kadam and H. Mishra, Phys. Rev. C92, 035203 (2015).
- Kadam and Mishra (2016) G. P. Kadam and H. Mishra, Phys. Rev. C93, 025205 (2016).
- Kadam (2015) G. P. Kadam, (2015), arXiv:1510.04371 [hep-ph] .
- Albright et al. (2014) M. Albright, J. Kapusta, and C. Young, Phys. Rev. C90, 024915 (2014).
- Albright et al. (2015) M. Albright, J. Kapusta, and C. Young, Phys. Rev. C92, 044904 (2015).
- Begun (2016) V. Begun, Phys. Rev. C94, 054904 (2016).
- Cleymans et al. (2006) J. Cleymans, H. Oeschler, K. Redlich, and S. Wheaton, Phys. Rev. C73, 034905 (2006).
- Xu and Kaneta (2002) N. Xu and M. Kaneta, Quark matter 2001. Proceedings, 15th International Conference on Ultrarelativistic nucleus nucleus collisions, QM 2001, Stony Brook, USA, January 15-20, 2001, Nucl. Phys. A698, 306 (2002).
- Andronic et al. (2010) A. Andronic, P. Braun-Munzinger, and J. Stachel, Nucleus nucleus collisions. Proceedings, 10th International Conference, NN2009, Beijing, P.R. China, August 16-21, 2009, Nucl. Phys. A834, 237C (2010).
- Karsch and Redlich (2011a) F. Karsch and K. Redlich, Phys. Lett. B695, 136 (2011a).
- Chatterjee et al. (2015) S. Chatterjee, S. Das, L. Kumar, D. Mishra, B. Mohanty, R. Sahoo, and N. Sharma, Adv. High Energy Phys. 2015, 349013 (2015).
- Olive et al. (2014) K. A. Olive et al. (Particle Data Group), Chin. Phys. C38, 090001 (2014).
- Trainor and Kettler (2011) T. A. Trainor and D. T. Kettler, Phys. Rev. C83, 034903 (2011).
- Trainor et al. (2012) T. A. Trainor, D. J. Prindle, and R. L. Ray, Phys. Rev. C86, 064905 (2012).
- Karsch et al. (2016a) F. Karsch, K. Morita, and K. Redlich, Phys. Rev. C93, 034907 (2016a).
- Ichihara et al. (2015) T. Ichihara, K. Morita, and A. Ohnishi, PTEP 2015, 113D01 (2015).
- Xu (2016a) H.-j. Xu, (2016a), arXiv:1602.06378 [nucl-th] .
- Xu (2016b) H.-j. Xu, Phys. Rev. C94, 054903 (2016b).
- Gupta et al. (2011) S. Gupta, X. Luo, B. Mohanty, H. G. Ritter, and N. Xu, Science 332, 1525 (2011).
- Karsch and Redlich (2011b) F. Karsch and K. Redlich, Phys. Rev. D84, 051504 (2011b).
- Karsch et al. (2016b) F. Karsch et al., Proceedings, 25th International Conference on Ultra-Relativistic Nucleus-Nucleus Collisions (Quark Matter 2015): Kobe, Japan, September 27-October 3, 2015, Nucl. Phys. A956, 352 (2016b).
- Bazavov et al. (2016) A. Bazavov et al., Phys. Rev. D93, 014512 (2016).
- Kaneta and Xu (2004) M. Kaneta and N. Xu, in Ultra-relativistic nucleus-nucleus collisions. Proceedings, 17th International Conference, Quark Matter 2004, Oakland, USA, January 11-17, 2004 (2004) arXiv:nucl-th/0405068 [nucl-th] .
- Cleymans et al. (2005) J. Cleymans, B. Kampfer, M. Kaneta, S. Wheaton, and N. Xu, Phys. Rev. C71, 054901 (2005).
- Kumar (2012) L. Kumar (STAR), Central Eur. J. Phys. 10, 1274 (2012).
- Das (2015) S. Das (STAR), Proceedings, 44th International Symposium on Multiparticle Dynamics (ISMD 2014), EPJ Web Conf. 90, 10003 (2015).
- Yu et al. (2014) N. Yu, F. Liu, and K. Wu, Phys. Rev. C90, 024913 (2014).
- Ma (1976) S. Ma, Modern theory of critical phenomena (Westview Press, 1976).
- Stephanov (2009) M. A. Stephanov, Phys. Rev. Lett. 102, 032301 (2009).
- Luo et al. (2014) X. Luo, B. Mohanty, and N. Xu, Proceedings, 24th International Conference on Ultra-Relativistic Nucleus-Nucleus Collisions (Quark Matter 2014): Darmstadt, Germany, May 19-24, 2014, Nucl. Phys. A931, 808 (2014).
- Netrakanti et al. (2016) P. K. Netrakanti, X. F. Luo, D. K. Mishra, B. Mohanty, A. Mohanty, and N. Xu, Nucl. Phys. A947, 248 (2016).
- Vovchenko and Stoecker (2017) V. Vovchenko and H. Stoecker, J. Phys. G44, 055103 (2017).