Physics Program for the STAR/CBM eTOF Upgrade
Abstract
![[Uncaptioned image]](/html/1609.05102/assets/eTOF2.png)
![[Uncaptioned image]](/html/1609.05102/assets/eTOF_pic1.png)
ABSTRACT
The STAR Collaboration and the CBM Collaboration institutions: Heidelberg, Darmstadt, CCNU, Tsinghua, and USTC propose to install an end-cap time-of-flight upgrade (eTOF) to the STAR detector for the RHIC beam energy scan phase II (BES-II) program in 2019 and 2020. BES-II will cover the collision energy range 3.0 to 19.6 GeV. This is the region of interest in the search for a critical point and first-order phase transition, identified by the results from BES-I and by model calculations. For the collider-mode portion of the energy scan, 7.7 to 19.6 GeV, eTOF will extend particle identification (PID) for pions, kaons, and protons to a rapidity of 1.2, complementing the inner Time Projection Chamber (iTPC) upgrade to the forward tracking. The rapidity coverage for PID would extend to only 0.8 without the eTOF upgrade. The eTOF upgrade will enable precision studies of the key bulk property observables, essential to the BES-II search. An internal fixed-target program will allow the energy scan to cover 3.0 to 7.7 GeV. The eTOF upgrade will provide essential mid-rapidity PID for the 4.5 to 7.7 GeV portion of the scan in fixed-target mode. Otherwise there would be a large energy gap in the middle of the BES-II program. A full description of the physics provided by the eTOF upgrade to STAR is presented in this note.
I Introduction
The first RHIC Beam Energy Scan (BES-I) was an initial survey in which data were acquired from Au+Au collisions at = 62.4, 39, 27, 19.6, 14.5, 11.5, and 7.7 GeV in 2010, 2011, and 2014 Abelev et al. (2009). The results from that program have been used to develop a focused BES-II program, scheduled to run in 2019 and 2020 BES (2014). The BES-II program will rely on low-energy electron cooling and longitudinally extended bunches to improve the luminosity Fedotov et al. (2009). The program in normal collider mode will cover the energy range from 7.7 to 19.6 GeV where the most promising results from BES-I were seen. The energies from 3.0 to 7.7 GeV will be accessible through the use of an internal fixed target Collaboration . Major upgrades to the STAR detector between BES-I and BES-II will allow for more refined studies. This document presents the benefits of the addition of an end-cap time-of-flight system (eTOF). The eTOF upgrade will provide particle identification (PID) in the extended pseudorapidity range provided by the iTPC upgrade iTP (2015) to the main tracking chamber Anderson et al. (2003).
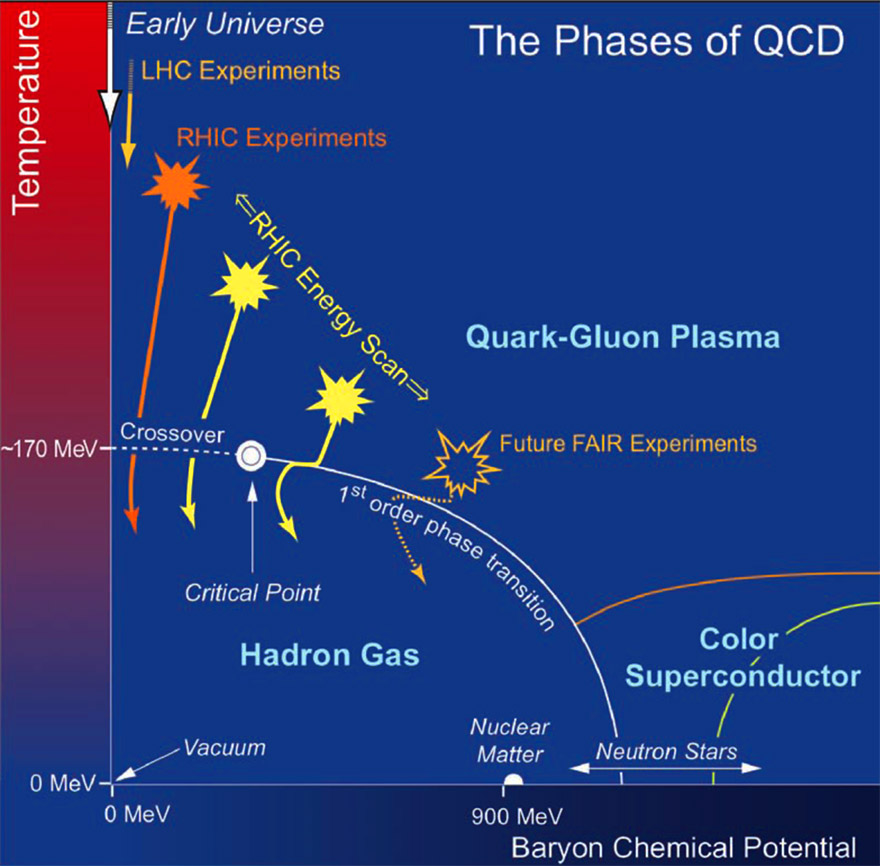
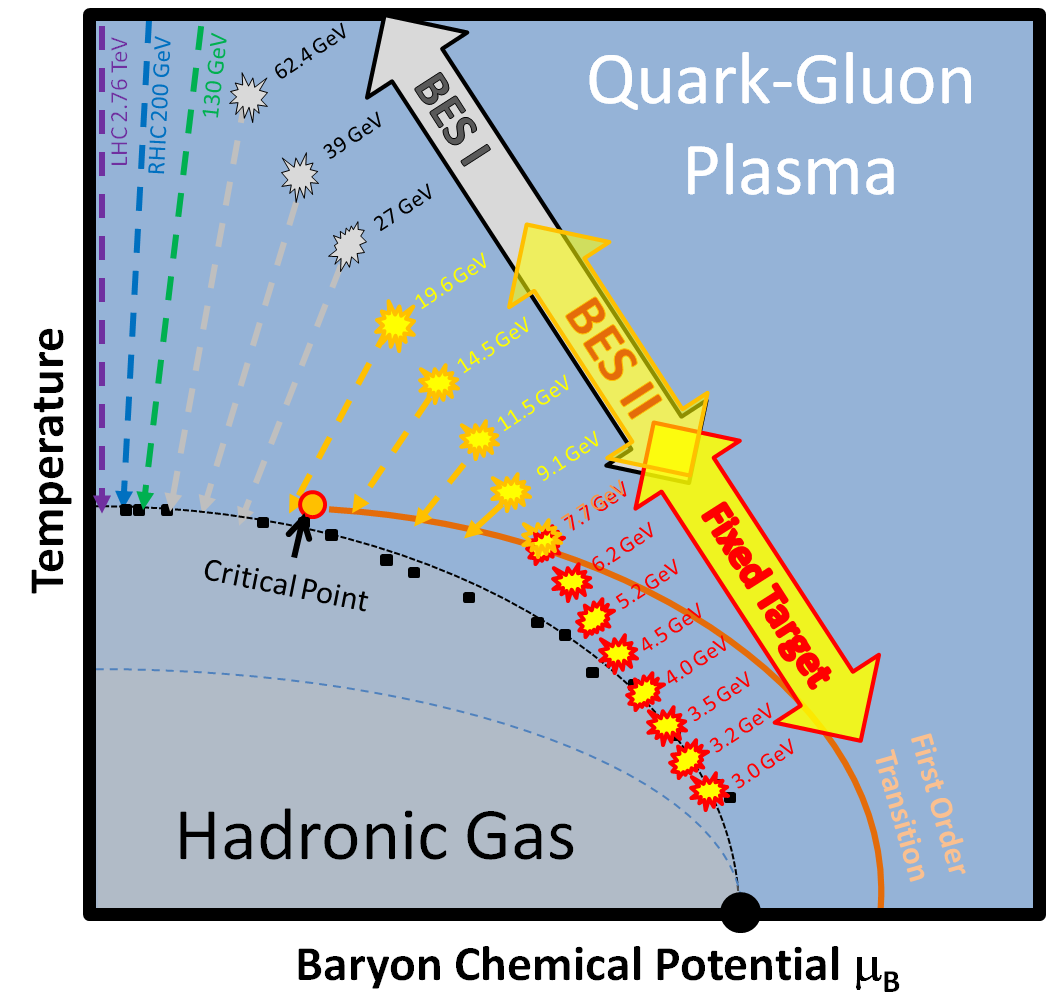
The BES-II program is designed to study the phase diagram of QCD matter (see Fig. 1). The program has several goals:
-
•
To determine the temperature () and baryon chemical potential () at chemical freezeout for events at the beam energy where the onset of deconfinement occurs. This would establish the basic structure of the QCD phase diagram.
-
•
To seek evidence of the softening of the equation of state, consistent with a first-order phase transition, to understand the nature of the phase boundary.
-
•
To look for enhanced fluctuations, which are a signature of critical behavior, to localize the possible critical point should the phase boundary change from a first-order to a crossover transition.
-
•
To observe the in-medium modification of the light vector meson mass, quantifying the effect of chiral symmetry restoration at high baryon densities.
For the collider part of the program, the upgrades extend the pseudorapidity coverage with PID from to . The eTOF is needed for PID at forward rapidities because the boost moves many particles beyond the limits of PID based on energy loss, . This extended coverage will allow for rapidity-dependent studies of the key physics observables, important because the partial stopping of the incident nucleons changes the nature of the system, effectively creating a gradient in as a function of rapidity. The iTPC and eTOF upgrades will benefit the fixed-target program in a different way. In fixed-target collisions, the center-of-mass is boosted in rapidity as a function of beam energy. Mid-rapidity will still fall inside the main TPC/TOF acceptance window for = 3.0 to 4.5 GeV. However, the additional coverage of the iTPC/eTOF is needed for = 4.5 to 7.7 GeV to provide mid-rapidity PID. The iTPC/eTOF upgrades are essential to allow a complete, gap-free scan from 3.0 to 19.6 GeV in the combined fixed-target and collider program of BES-II.
II eTOF Improvements to the Physics of the BES-II Collider Program
II.1 Acceptance
The nature of the improvements to the physics reach of the BES-II program is dependent on the details of the improved acceptance. There are four key areas which are extended by the iTPC and eTOF detector upgrades:
-
•
the low- acceptance,
-
•
the pseudorapidity coverage,
-
•
the PID limits,
-
•
the TOF PID limits.
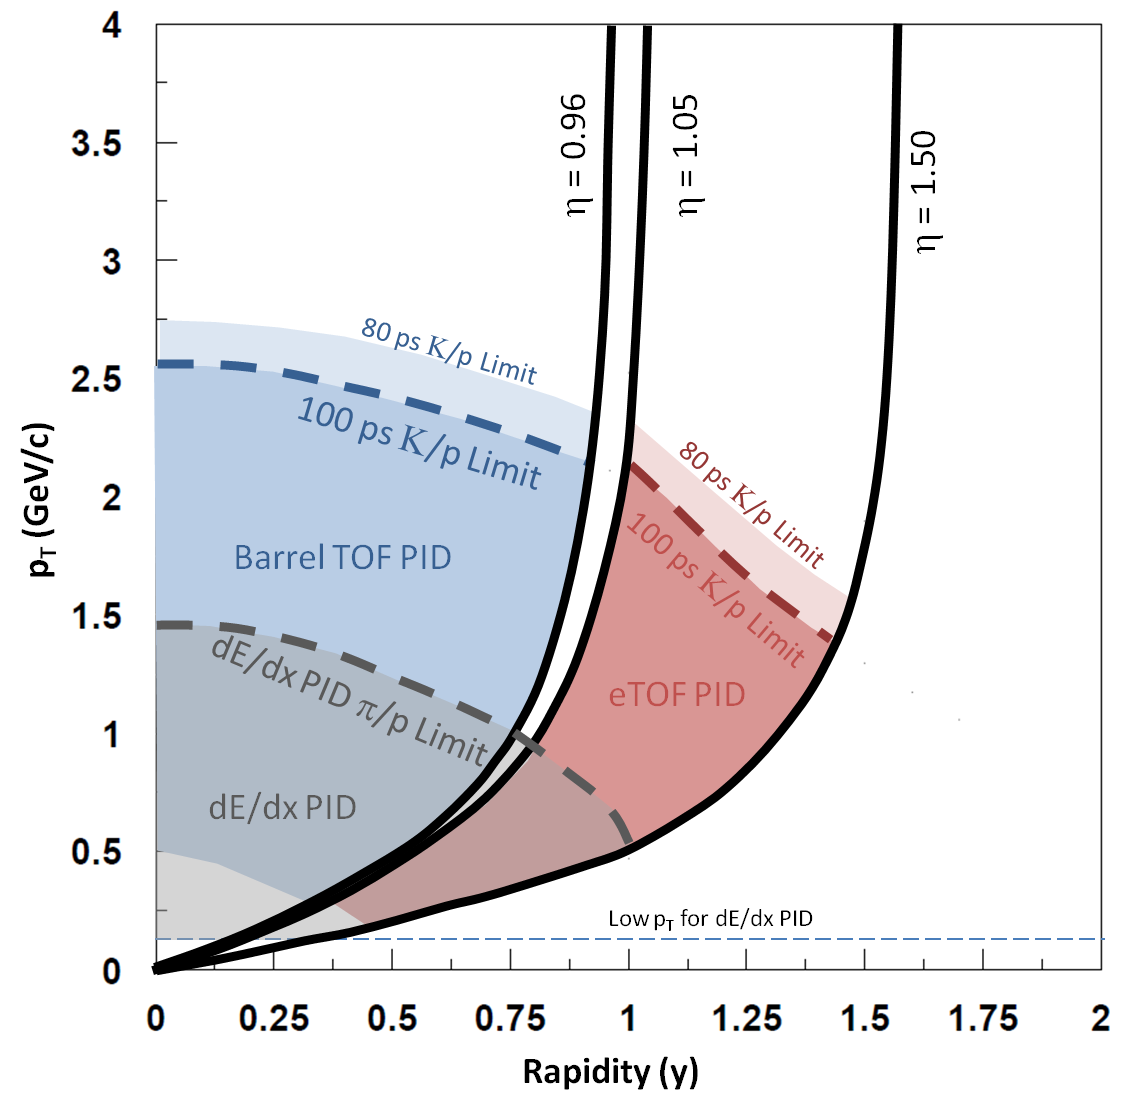
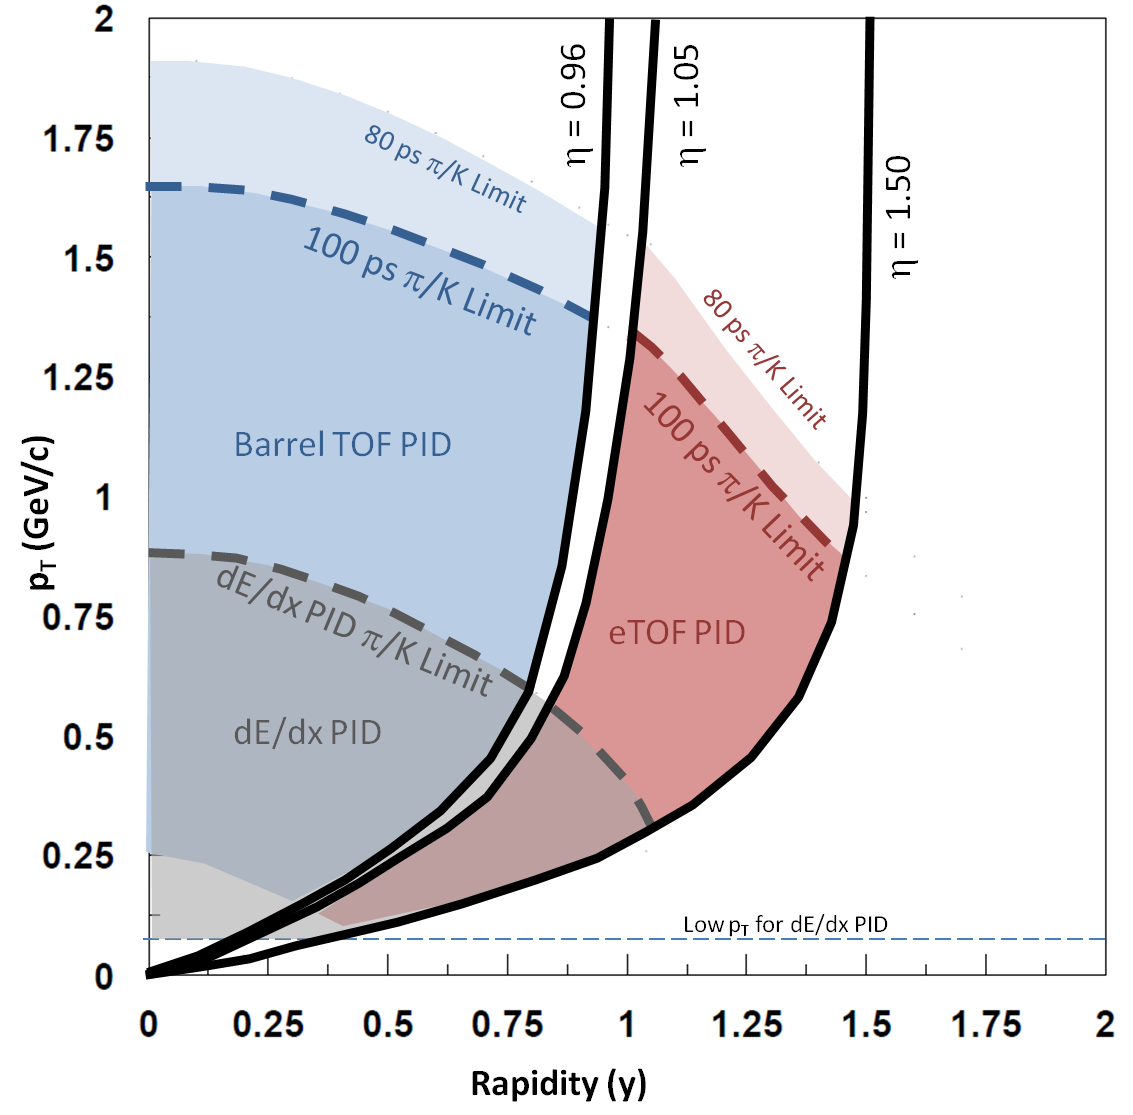
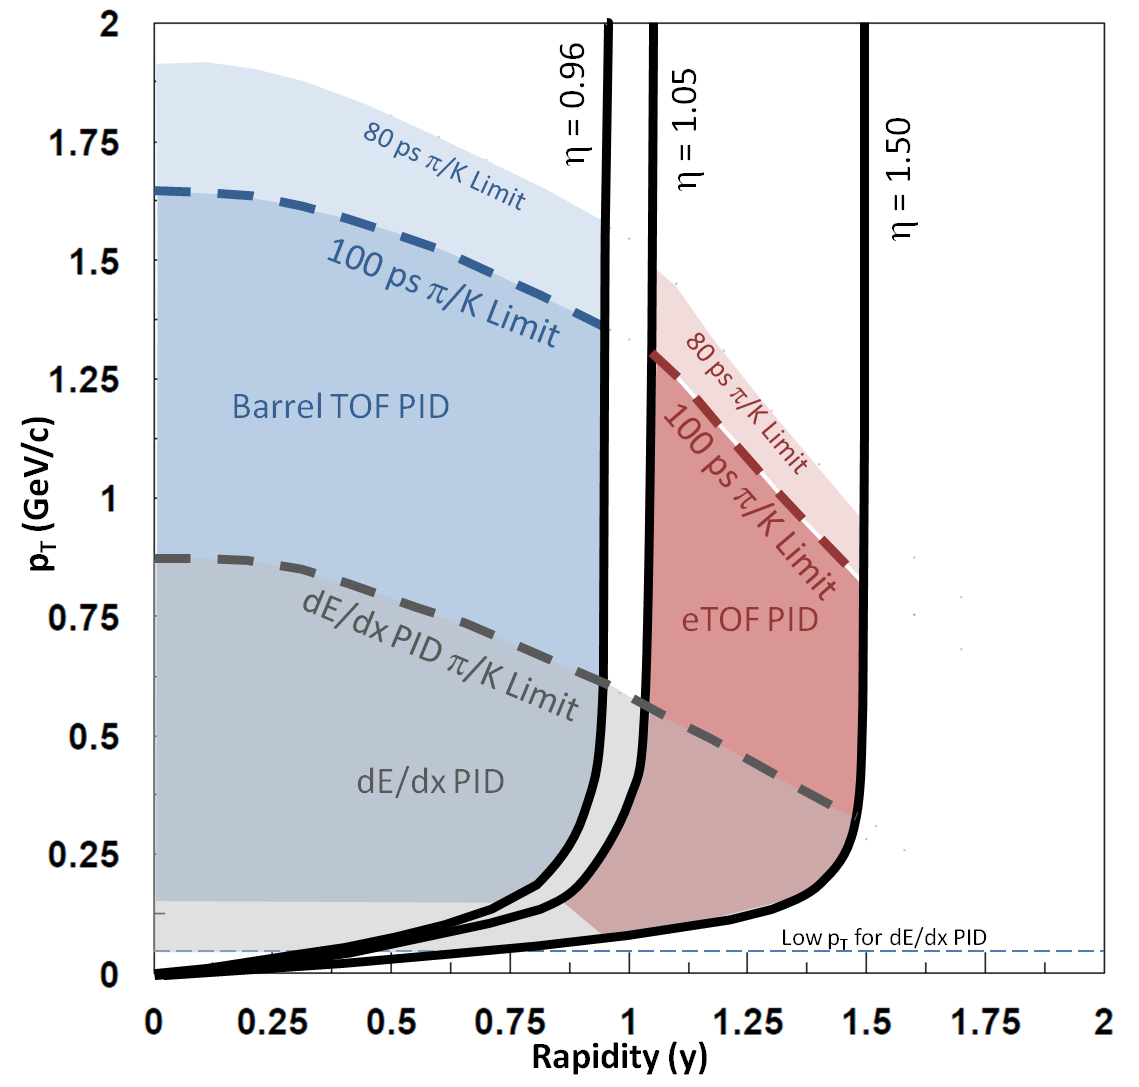
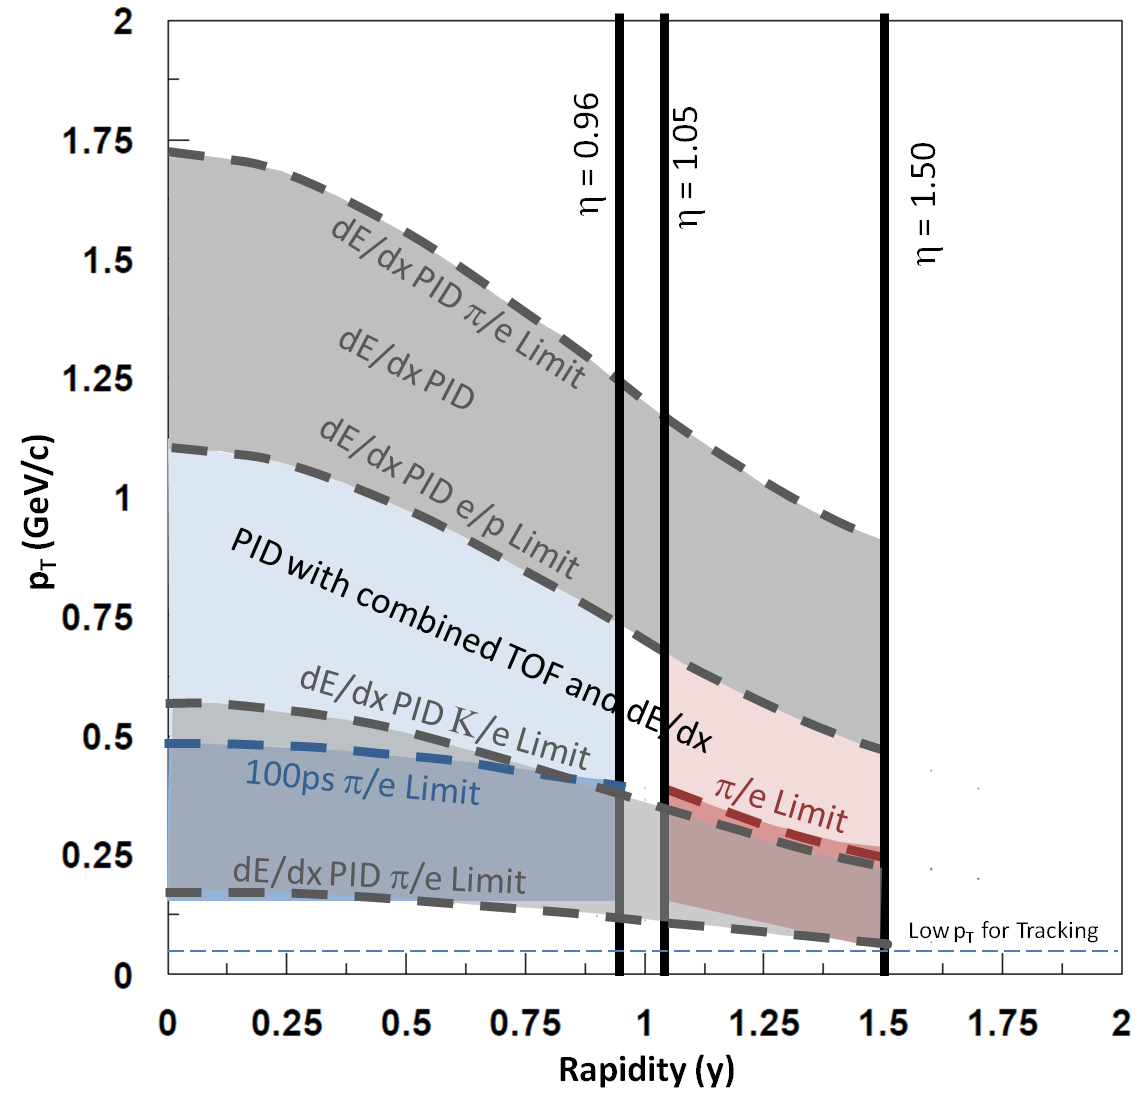
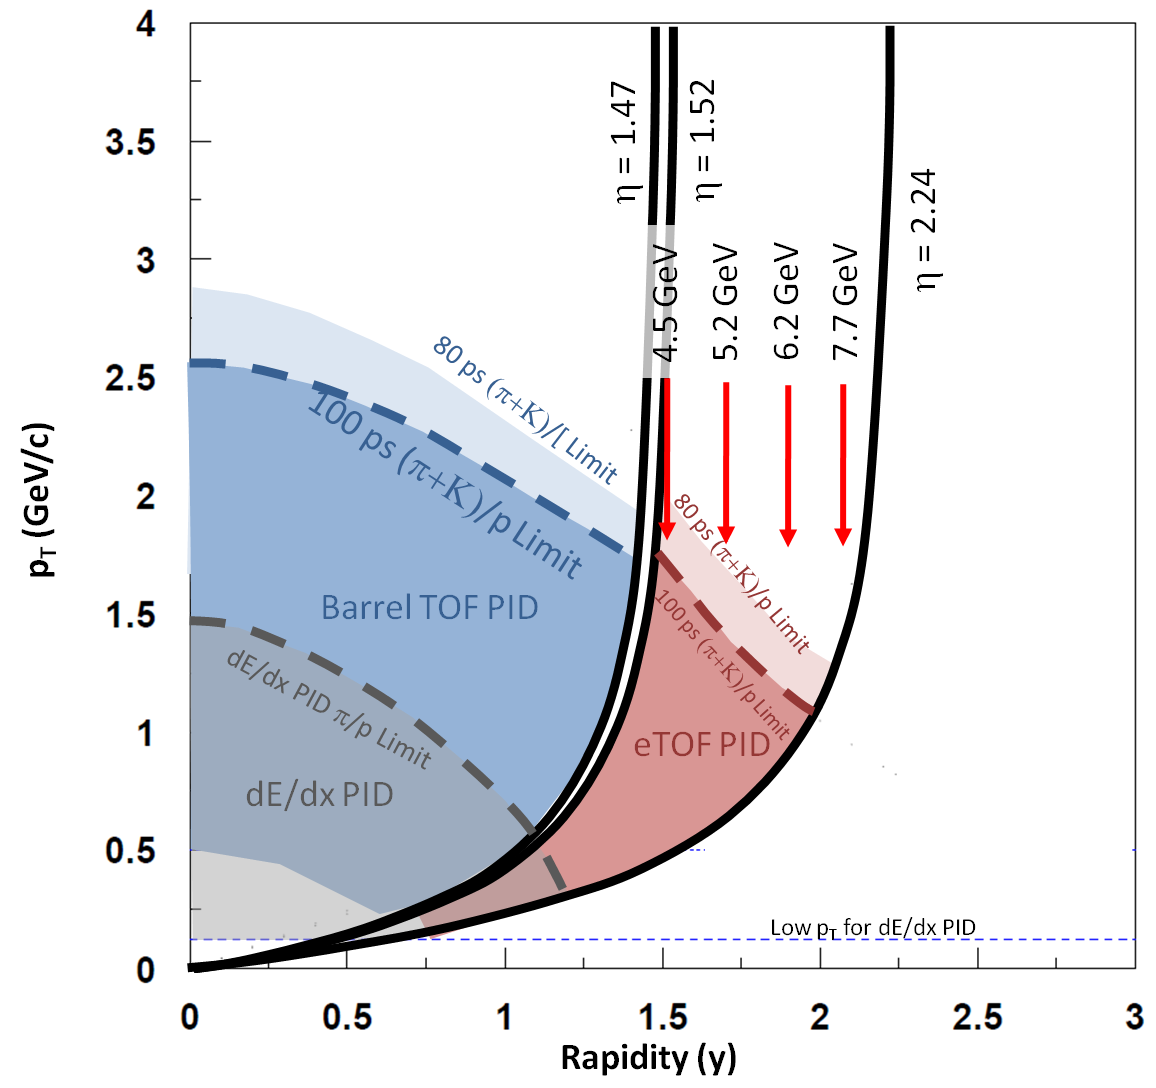
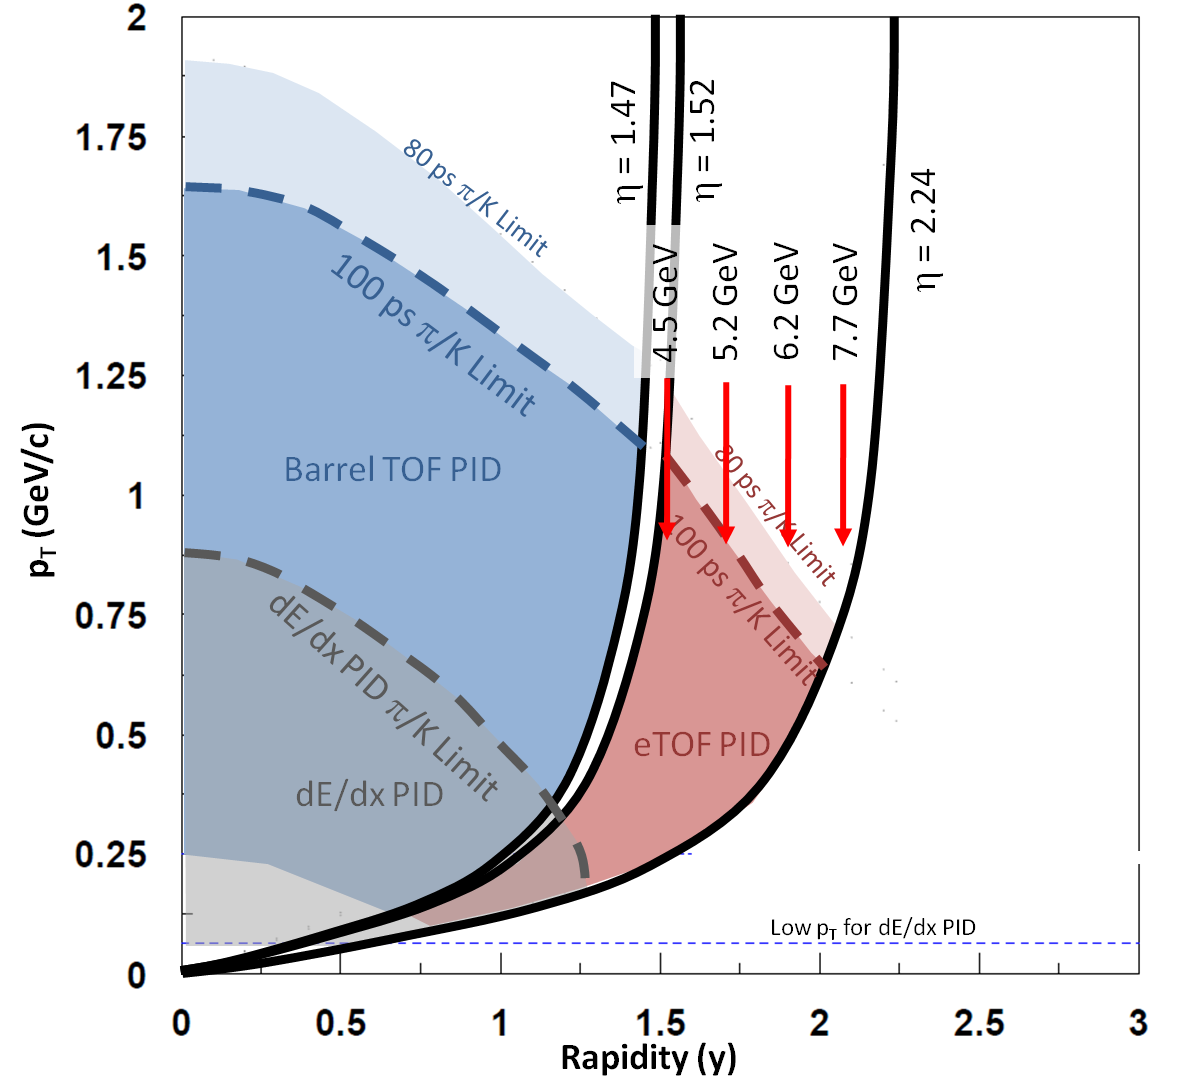
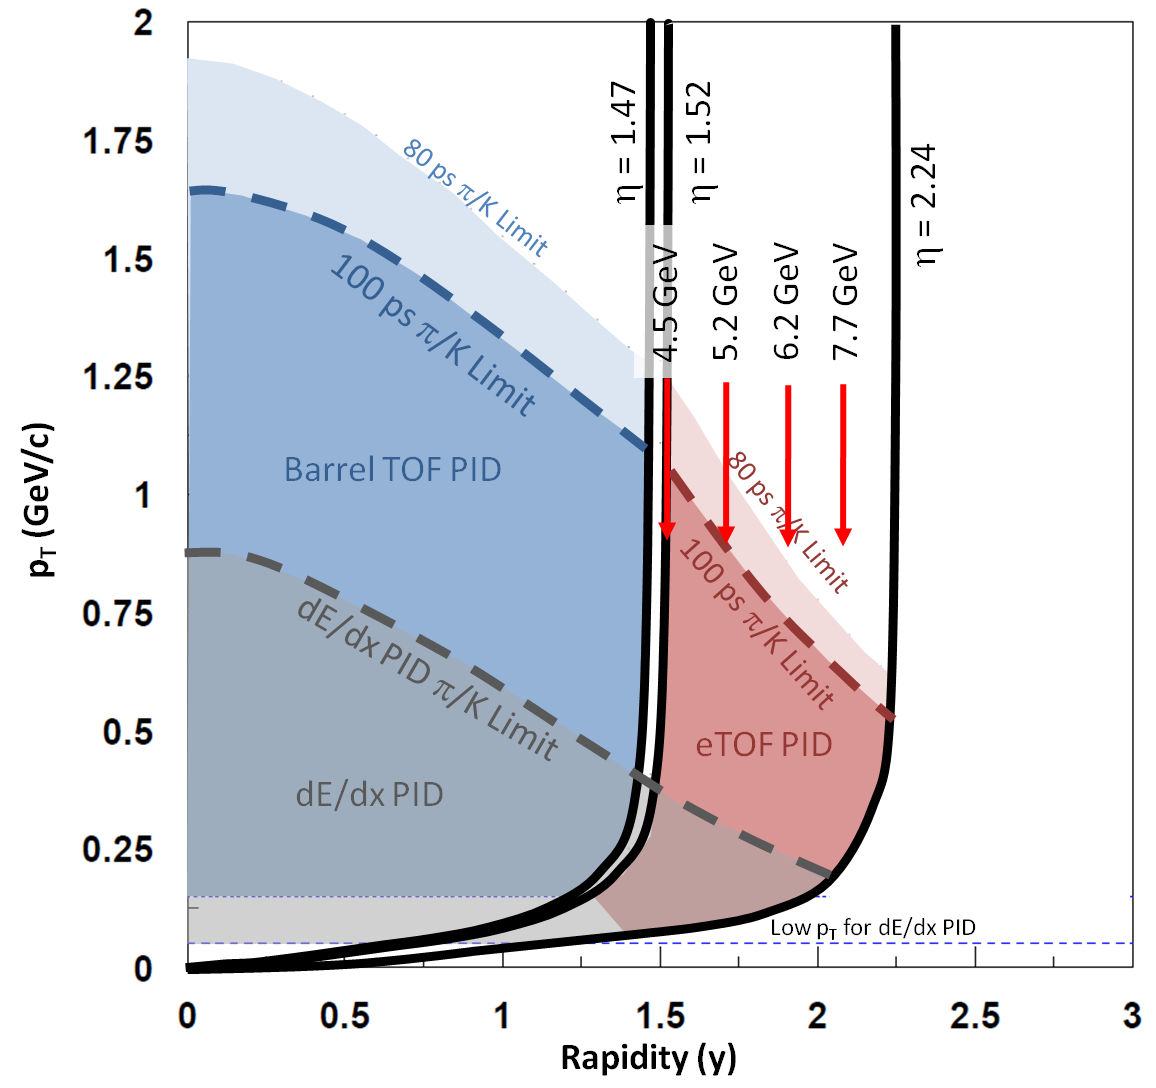
The transformation Jacobian from pseudorapidity to rapidity is different for each particle species. The coverage limits, which are determined by the hardware, have to be converted to using the appropriate transformation Jacobians. Because different species overlap in different PID spaces, a separate vs. acceptance map showing the tracking coverage limits must be generated for each particle species: , , and (see Figs. 2, 3, and 4).
The low- acceptance limit is defined by the tracking detector, while the low- TOF PID limit is set by the material of the detector and the magnetic field. For acceptance, a track must be identified and associated with the primary vertex. The pattern recognition in the STAR track finding software requires a minimum of ten hits, which sets the absolute low- limit of 50 MeV/c. However, the effect of multiple scattering and projection back to within 3 cm of the primary vertex sets effective limits of 125 MeV/c for protons and 65 MeV/c for kaons at mid-rapidity. The pion multiple scattering limit is 20 MeV/c, and therefore multiple scattering does not set the acceptance limit for pions. These multiple scattering limits are rapidity-dependent as the material through which a track must pass and the projection length from the inner pad rows to the primary vertex increase as , where is the polar angle with respect to the beam axis. However, the multiple scattering is also reduced by as one goes away from mid-rapidity. In the barrel TOF at = 0, low- TOF PID limits of 500 MeV/c for protons, 250 MeV/c for kaons, and 165 MeV/c for pions are observed. The low- limit for the pions is set by the 0.5 T field of the STAR solenoid. The limits for kaons and protons are set by the energy loss in the outer field cage. These limitations for kaons and protons will vary with as the material budget increases as and decreases as . For the eTOF, the effect of the material will be more complicated. The end-cap readout region of the TPC is far less uniform than the outer field cage. The low- thresholds are shown in Figs. 2, 3, and 4.
The pseudorapidity acceptance limits of the detector are defined by the tracking performance and by the geometric extent of the TOF arrays. The barrel TOF system provides coverage to = 0.96 which is not limited by tracking performance. The eTOF system will be mounted at a distance of 280 cm from the center of the detector and will have a radial extent from 105 to 225 cm. This provides geometric coverage of , and leaves a small gap between the two TOF systems. The limitation of at least ten hits to find a track sets an absolute high- tracking limit for the iTPC of = 1.7. However, for these very forward tracks, the shorter track length and longer projection length from the inner field cage to the primary vertex reduce the tracking efficiency. The efficiency has been demonstrated to be 50% at = 1.5. Optimization of the software matching tracks to the primary vertex will allow some improvement. The tracking coverage limits are shown as functions of and in Figs. 2, 3, and 4.
The STAR detector has the benefit of multiple and overlapping means of PID: and time-of-flight. The resolution of gas tracking chambers was empirically studied by Allison and Cobb Allison and Cobb (1980). Their formula for the percent resolution is:
| (1) |
where is the number of samples, is the pressure in atmospheres, and is the pad height or length in cm. The outer sectors cover radii from 126-190 cm with 32 pad rows of 1.95 cm pads. The iTPC inner sectors cover radii from 60-120 cm with 40 pad rows of 1.55 cm pads. From these pad dimensions, one can determine the tracking length for resolution as a function of pseudorapidity. The response as a function of momentum for each particle species is given by the parametrizations in Ref. Bichsel (1988). Using the resolutions and the parametrized response, we can determine the momentum limits where pions can no longer be resolved from kaons, and where protons can no longer be resolved from pions. A sample of the relevant values for PID using a selection are shown in Table 1. These PID limits are shown as functions of and in Figs. 2, 3, and 4.
| Track Length | |||||
|---|---|---|---|---|---|
| (CM) | (%) | (GeV/c) | (GeV/c) | ||
| 0.0 | 126 | 72 | 5.5 | 0.88 | 1.47 |
| 0.5 | 142 | 72 | 5.2 | 0.79 | 1.31 |
| 1.0 | 163 | 49 | 4.8 | 0.59 | 0.97 |
| 1.2 | 123 | 40 | 5.5 | 0.49 | 0.81 |
| 1.5 | 80 | 24 | 6.7 | 0.35 | 0.60 |
The PID derived from TOF measurements is a function of the timing resolution () of the TOF modules, momentum resolution (), and the resolution in the flight path () of the particles. The mass resolution () is given by:
| (2) |
The momentum resolution of a tracking chamber is given by:
| (3) |
where ( being the radius of curvature) and ( is the charge and is the magnetic field). The multiple scattering term () is given by:
| (4) |
where is the radiation length of the material, and the tracking term () is given by:
| (5) |
where is the transverse resolution of a TPC hit. The transverse momentum resolution of the STAR TPC has been demonstrated to rise 0.85% per GeV/c. The best resolution for protons is found to be 1.0% at 1 GeV/c while the best resolution for pions is found to be 1.4% at 0.4 GeV/c. Using these measured transverse momentum resolutions, the constants in the two momentum resolution terms have been fixed and used to estimate the momentum resolution for pions and protons at the TOF PID limits. These momentum resolutions are given in Table 2. The resolution in the flight path () is given by the resolution of the primary vertex and the spatial accuracy of the TOF modules. The accuracy of the primary vertex is determined to a few hundred microns and has a dependence on multiplicity. The spatial accuracy of the TOF modules is assumed to be a few mm. Both the barrel TOF (2004) and end-cap Herrmann (2014) TOF modules use similar signal-amplification technology, however, the end-cap modules employ a modern, improved readout design. The barrel TOF modules were designed to have a system resolution of 100 ps. This system has been demonstrated to have achieved a resolution of better then 90 ps TOF (2004). The CBM TOF wall is designed to have a system time resolution of better than 80 ps. This is to be achieved with counters having an intrinsic resolution of 60 ps and assuming that there will be a time-zero reference of better than 50 ps. This can be reached using the vertex position detector (VPD), which has been shown to provide a start time resolution of 24 ps in central collisions. The timing resolution will not be degraded through the angle of incidence as the range of angles in the plane will be from 70 to 50 degrees and in the plane the incident angle will always be greater than 45 degrees. As a conservative estimate, a time resolution of 100 ps for both the barrel and end-cap TOF arrays is assumed to generate the acceptance tables. A timing resolution performance of 80 ps for the system would extend the TOF PID limits by approximately 300 MeV/c for protons and 200 MeV/c for pions.
For mid-rapidity tracks with a flight path of 2.2 m, and separations are achieved for 1.6 GeV/c and 2.6 GeV/c, respectively. These separation cuts scale with an increase in track length. The longest flight path for the barrel TOF are the = 0.96 tracks, which have a path of 3.3 m. The eTOF is set back from the TPC end-cap at a distance of 2.8 m from the interaction point. The longest flight paths for the eTOF are those at of 1.05, which have paths of 3.6 m. The shortest paths (3.0 m) are for the tracks at = 1.7. The combined effects of timing, spatial, and momentum resolution are studied as a function of and the TOF PID limits are shown as functions of and in Figs. 2, 3, and 4.
| flight path | (pro) | |||||
|---|---|---|---|---|---|---|
| (cm) | (cm) | (%) | (GeV/c) | (%) | (GeV/c) | |
| 0.0 | 220 | 200 | 1.6 | 1.7 | 2.8 | 2.6 |
| 0.5 | 248 | 200 | 1.6 | 1.6 | 2.7 | 2.4 |
| 0.96 | 329 | 163 | 1.6 | 1.3 | 2.6 | 2.1 |
| 1.05 | 358 | 160 | 1.6 | 1.3 | 2.5 | 2.1 |
| 1.2 | 336 | 133 | 1.7 | 1.1 | 2.8 | 1.8 |
| 1.3 | 325 | 118 | 1.8 | 1.0 | 2.9 | 1.6 |
| 1.4 | 316 | 105 | 2.0 | 0.9 | 3.1 | 1.4 |
| 1.5 | 309 | 94 | 2.2 | 0.8 | 3.4 | 1.3 |
| 1.6 | 303 | 84 | 2.4 | 0.75 | 3.7 | 1.2 |
| 1.7 | 299 | 76 | 2.7 | 0.7 | 4.1 | 1.1 |
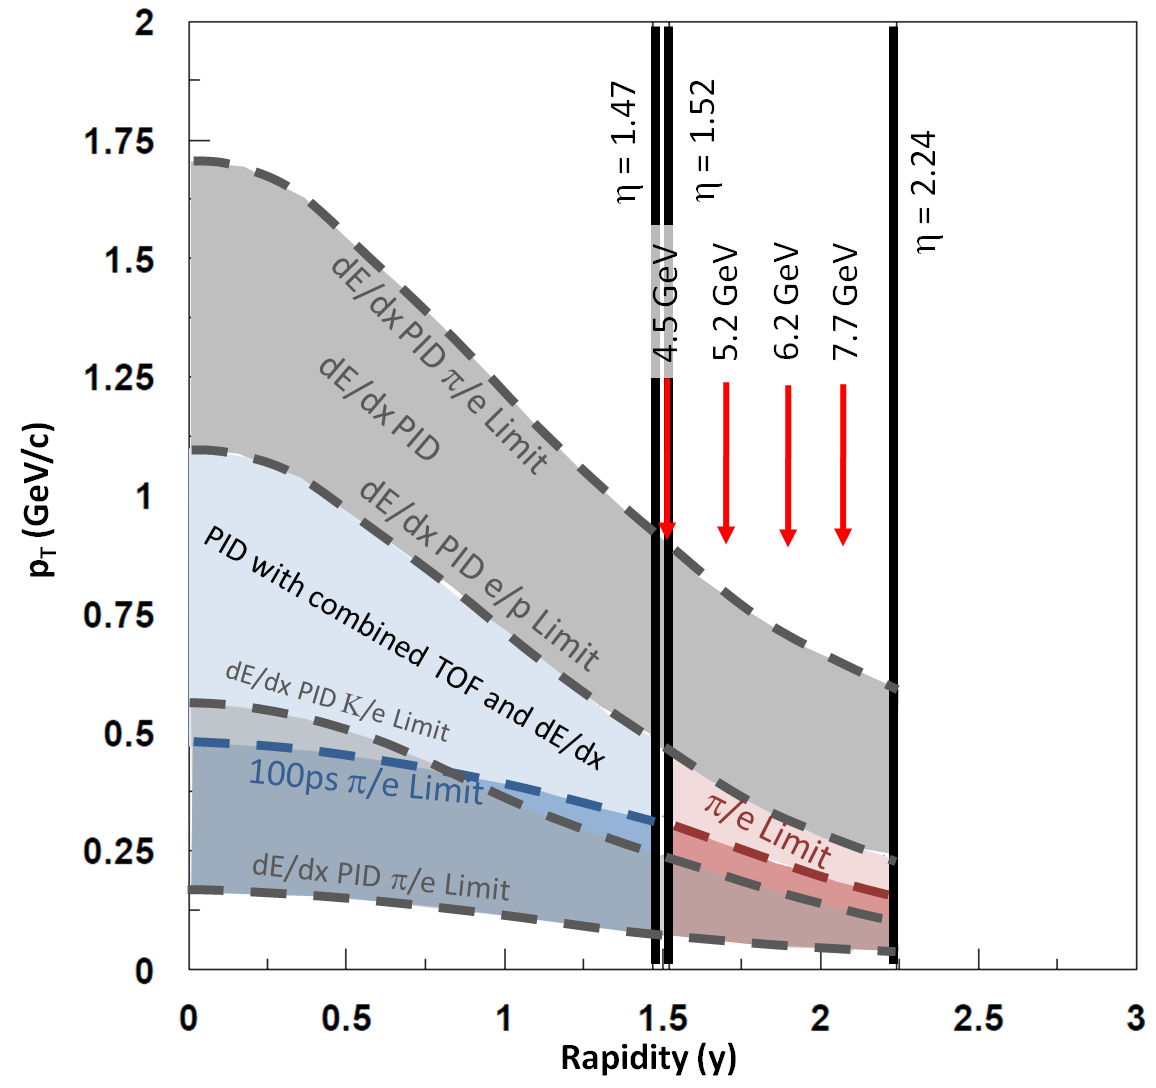
It is also relevant to consider the acceptance and PID limitations for electrons. As all measured electrons are highly relativistic, pseudorapidity and rapidity are essentially the same. The low- limit for electrons is set by the radius of curvature limits: 50 MeV/c tracking, 150 MeV/c to reach the barrel TOF, and -dependent limits for the eTOF. Electrons can be identified by TOF until they merge with the pions at 500 MeV/c. For much of this same range, the relativistic electrons also can be identified by between the pion and kaon bands which are falling in the region of -space. There is then a range of momenta from 0.5 to 1.1 GeV/c for which electrons cannot be cleanly identified by either TOF or alone. In this region, the electrons are merged with the pions in TOF-space and with either kaons or protons in -space. By using information from both systems, it is still possible to cleanly identify electrons. Finally, for momenta above 1.1 GeV/c, the relativistic electrons can be cleanly identified using up to 1.7 GeV/c when the pions approach their relativistic plateau. These acceptance regions are shown in Fig. 5.
All the acceptance windows shown in Figs. 2, 3, 4, and 5 were generated assuming that the collision was at = 0, in the center of the detector. However, for inclusive studies, the acceptance windows in rapidity can be affected by intentionally selecting events with a vertex offset as large as one meter because the longer bunches envisioned for BES-II will provide a broad interaction diamond. For offsets of = 1 m, the barrel TOF will extend from = -0.4 to 1.2 while the eTOF will cover from = 1.3 to 2.0. Selecting events with offset vertices will allow the 0.1 unit gap between the barrel and end-cap TOF systems to be covered.
II.2 Rapidity Dependence of Spectra
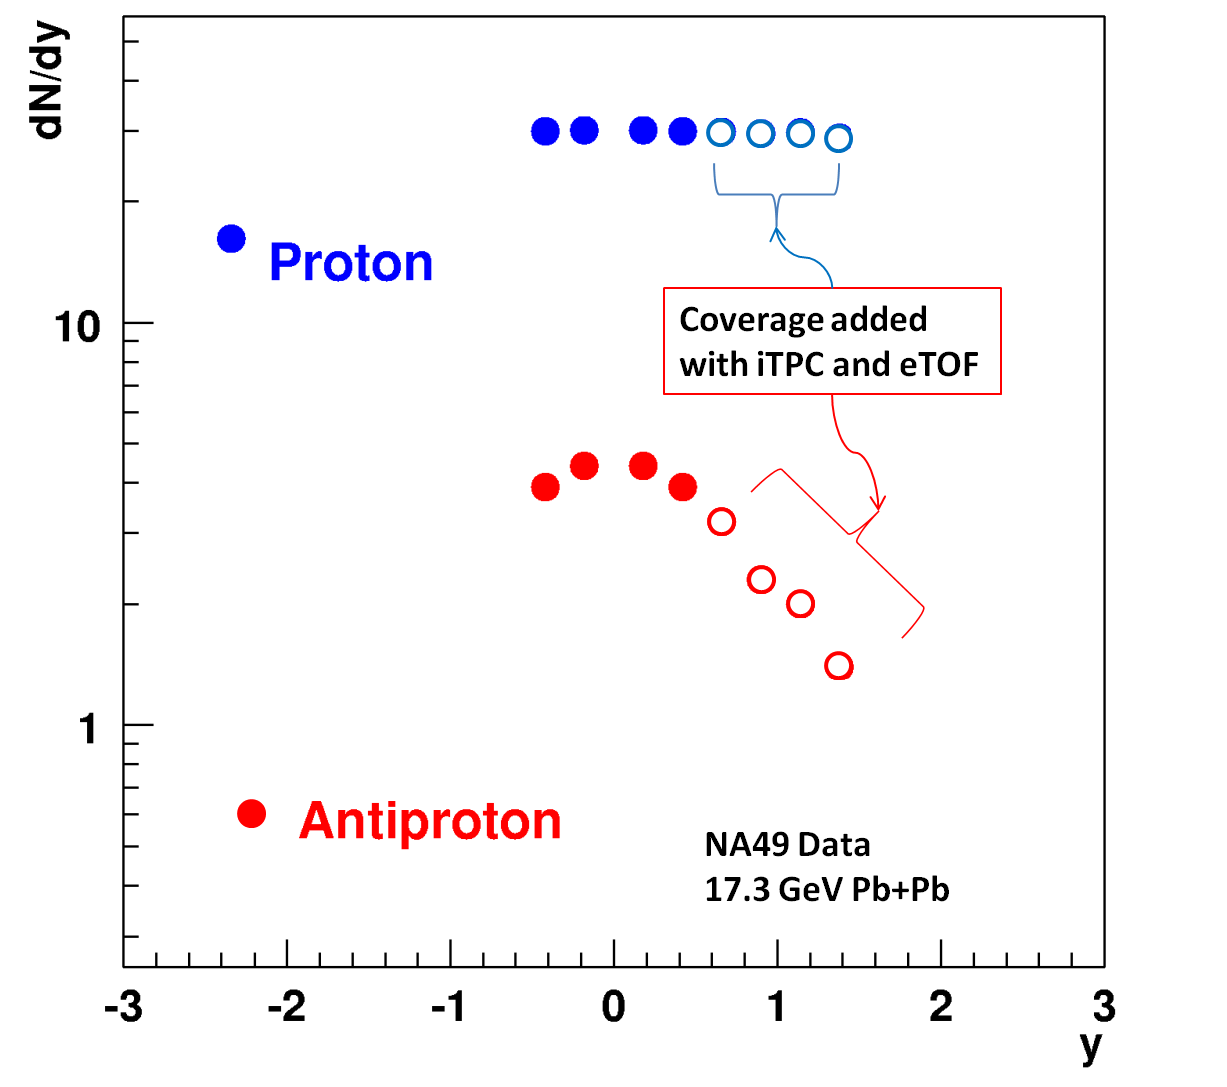
At the top RHIC energies and at the LHC, there is a region of boost invariance at mid-rapidity. However, lower collision energies are characterized by incomplete transparency and partial stopping. This is most readily observed by comparing the rapidity density distributions of protons to those of anti-protons. Sample distributions are shown in Fig. 6 Alt et al. (2006). The anti-proton yield, which is entirely comprised of produced quarks, can be well described by a Gaussian at mid-rapidity. The proton yield is much flatter in and clearly the distribution is not a thermalized Gaussian. The anti-proton to proton ratio, which is the best indicator of the baryon chemical potential, changes dramatically as a function of rapidity. For the data shown in Fig. 6, the change in the anti-proton to proton ratio would suggest a change in of 50 MeV from to . (Note the magnitude of the change depends on the collision energy). This change in the ratios also highlights why statistical equilibrium models extract quite different and values when using mid-rapidity versus full acceptance (4) yield data. The figure highlights why this added rapidity coverage with eTOF PID is so important for the BES-II program. As the of the system is a function of the degree of stopping at a given energy and centrality, it is important that this stopping be measured as directly as possible. Extended rapidity coverage allows for the study of bulk properties as a function of rapidity. The collision energy step size of the BES-II program was selected in order to measure steps of about 50-60 MeV. This is roughly the same change in expected when shifting from to . We should expect to see similar changes in bulk properties when shifting from one BES energy to the next as when shifting from mid to forward rapidity. For , the eTOF is required for PID, as seen in Figs. 2, 3, and 4.
Strange baryons and mesons allow one to carefully tease out the stopping of the quarks from the participant nucleons. The , with one and one quark, should show two thirds of the stopping effects of the proton, while the , with only a single quark, should show effects at the one-third level. The carries an quark, and should show a rapidity density that is broadened due to partial stopping, while the carries a and should therefore show no stopping effects.
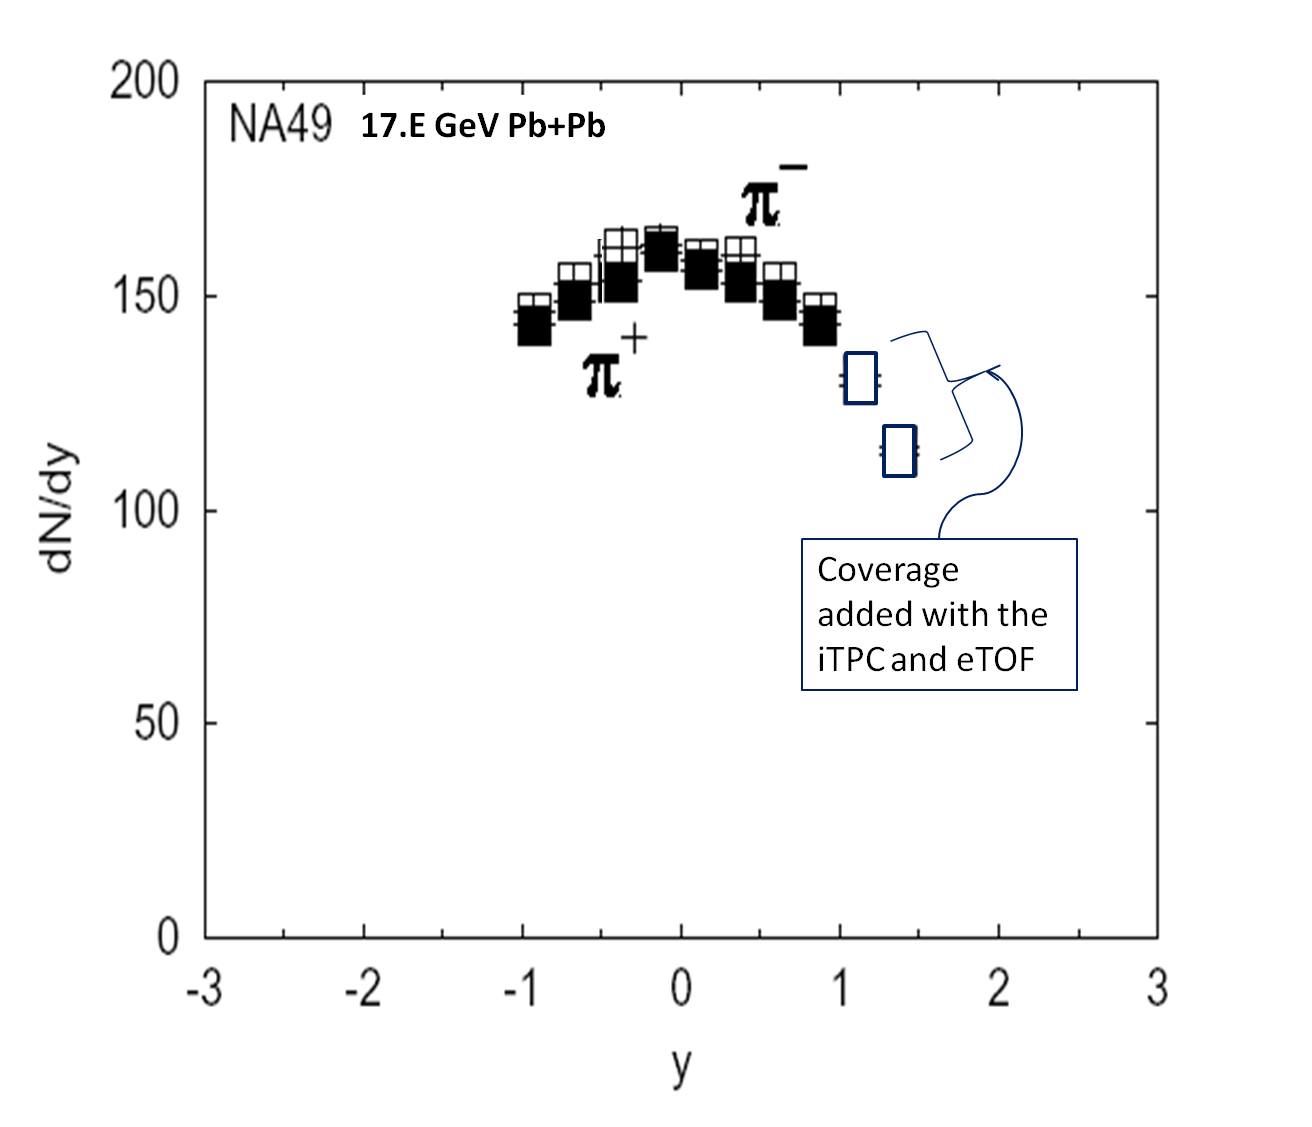
Pions are the most copiously produced particles. Although there are some isospin-dependent effects at the lowest center-of-mass energies and at very low-, the pions are for the most part indicators of the freeze-out surface. The longitudinal extent of the pion rapidity density distribution compared to the width suggested by Landau hydrodynamics has been used as evidence for a drop in the speed of sound. This is indicative of a first-order phase transition Petersen and Bleicher (2006); Alt et al. (2008). Determining the nature of the phase transition as a function of collision energy is one of the key physics goals of the BES-II program. Studying the widths of the pion rapidity distributions provides evidence of the expected softening of the equation of state. The capability of the STAR detector to measure the pion rapidity density width is illustrated in Fig. 7. Data from NA49 for Pb+Pb collisions is shown Chvala (2005) in the acceptance window of the current configuration (solid symbols) and with the extended rapidity and PID of the eTOF upgrade (open symbols). In order to determine accurately the width of a Gaussian, the measurement window should be broader than one . For the energy range of the BES-II program, the pion rapidity widths are expected to range from 1.1 to 1.6 units of rapidity as the collision energy increases from 7.7 to 19.6 GeV Rustamov (2012).
II.3 Dileptons
Short-lived vector mesons, which decay into (dilepton) pairs are seen as probes of the earliest stage of a heavy-ion reaction, because the daughter electrons escape the colored medium without substantial final-state interactions. The transition from a QGP to a dense hadron gas involves not only a deconfinement transition but also a spontaneous breaking of chiral symmetry. Chiral symmetry predicts that the spectral functions of chiral partners ( and for example) become degenerate in the symmetric phase. Since it is impossible in heavy-ion collisions to measure a spectral function for the meson, one cannot directly observe the disappearance of the mass splitting between the and experimentally. Instead, efforts are devoted to studying the modification of vector meson spectral functions in a hot dense medium.
A similar broadening of the mass of the has been observed from the top SPS energy Adamova et al. (2008); Adamczyk et al. (2015) to the top RHIC energy. This broadening causes an excess in the low-mass region (200 to 770 MeV/) of the dilepton invariant mass spectrum. Using the broadened spectral function, QCD and Weinberg sum rules, and inputs from Lattice QCD, theorists have demonstrated that when the temperature reaches 170 MeV, the derived spectral function is the same as the spectral function. This is a signature of chiral symmetry restoration. In a model calculation which describes the experimental data, the coupling to the baryons in the medium plays a dominant role in the broadening of the spectral function. The ratio , which is a proxy for the total baryon density, remains fairly constant at mid-rapidity from top RHIC energies down to the top SPS energy, and then increases as one goes down through the BES-II range Geurts et al. (2013). This behavior predicts a change in the normalized low-mass dilepton excess of a factor of two over the collision energies of 7.7 to 19.6 GeV. As can be seen in Figs. 6 and 7, one can also change the ratio by shifting the analysis frame from mid-rapidity to forward rapidity. This rapidity dependence will provide a strong and independent observable to study the total baryon density dependence of the low-mass dielectron emission. Knowing the mechanism that causes in-medium broadening and the temperature and baryon density dependence is fundamental to our understanding and assessment of chiral symmetry restoration in hot QCD matter.
Due to the high hadron background, the quality of the PID is typically the primary limitation for dielectron measurements. Even with the iTPC upgrade, the electron identification would still be limited to the pseudorapidity range between . Electrons are always in the relativistic rise region of for gas ionization chambers. Therefore, clean PID requires another discriminating measurement such as the time of flight. With the eTOF upgrade, we can extend the electron identification to the range . The STAR detector during BES-II will have a unique capability to quantify the total baryon density effect on the broadening. The improved measurements during BES-II will enable us to distinguish models with different broadening mechanisms, for example, the Parton-Hadron String Dynamic (PHSD) transport model Linnyk et al. (2011, 2012) versus a microscopic many-body model with macroscopic medium evolution Rapp (2001); van Hees and Rapp (2006). The rapidity-dependent measurements during BES-II enabled by the eTOF will provide complementary information on this important physics topic.
II.4 Directed Flow
Proton directed flow () measurements from the BES-I program have shown a very intriguing behavior Adamczyk et al. (2014a); no model yet shows good agreement, and the favored interpretations by theorists include both a crossover and a first-order phase transition Stoecker (2005); Steinheimer et al. (2014); Konchakovski et al. (2014); Cassing et al. (2014); Nara et al. (2016). The mid-rapidity slope switches from positive to negative between and 11.5 GeV, and reaches a minimum near 14.5 GeV. The slope for net-protons has a similar minimum but then switches back to a positive slope between 27 and 39 GeV. This behavior could indicate a repulsive compression at the lowest and highest energies, and a softening of the equation of state, consistent with a spinodal decomposition, at the intervening beam energies. Even though this remarkable result still needs theoretical progress to provide interpretation, further experimental tests can help elucidate the underlying physics.
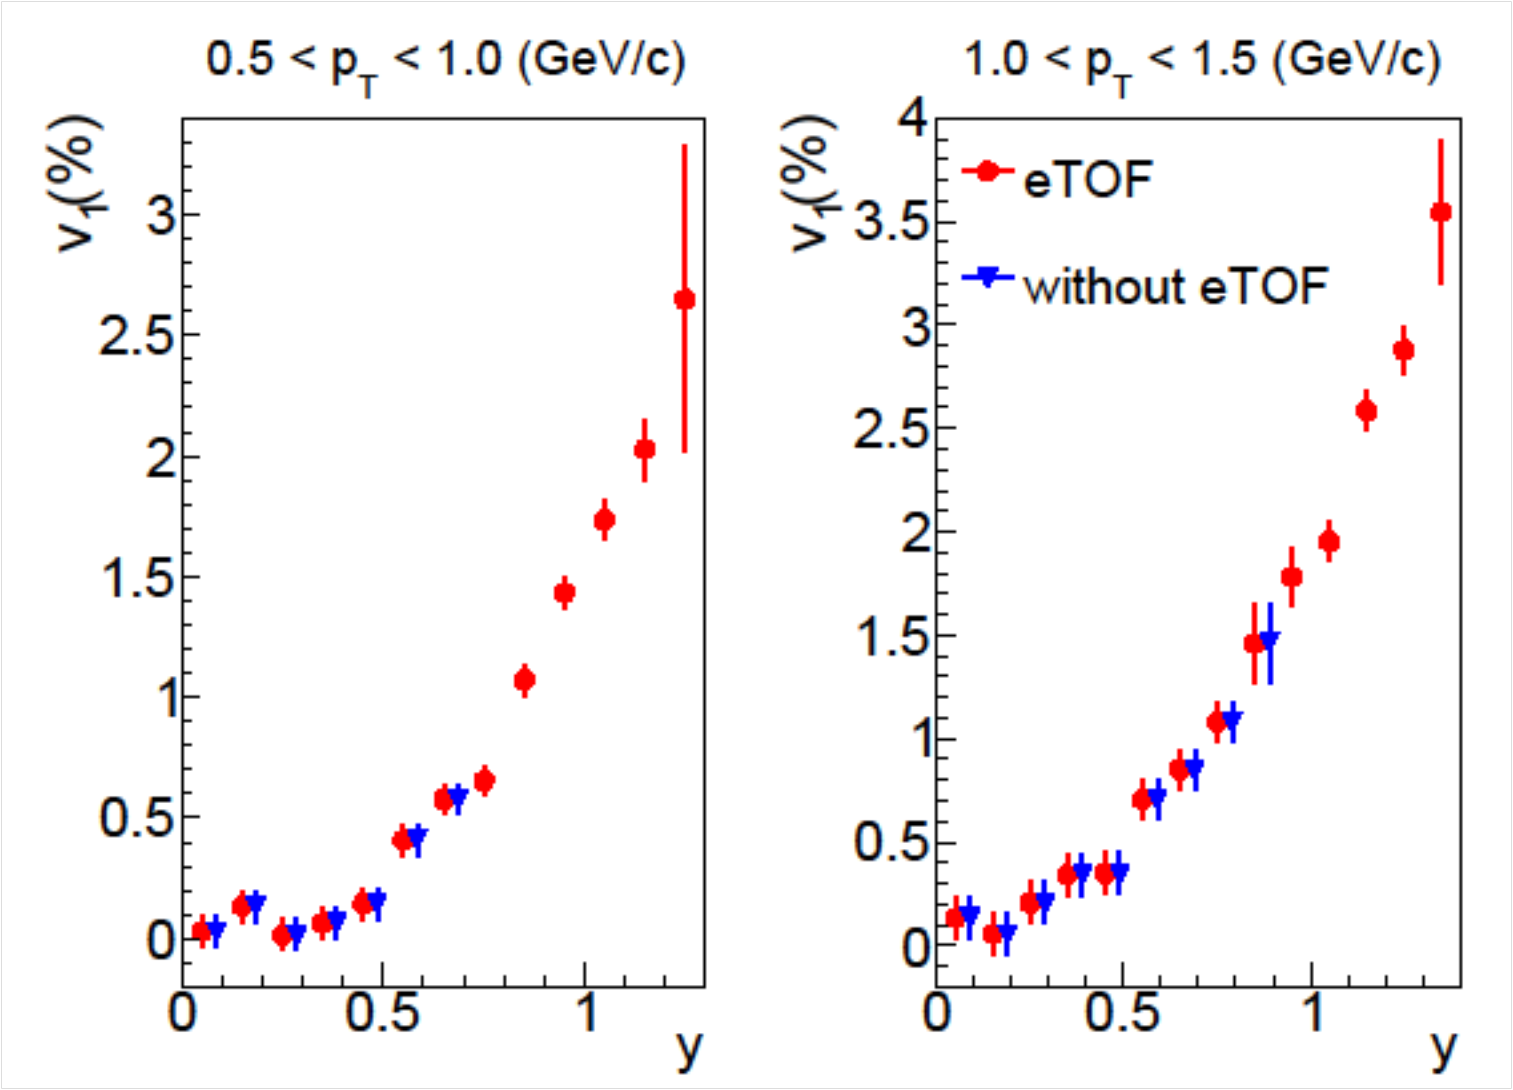
During the evolution of a heavy-ion collision, gradients of pressure, density, and temperature are established across the interaction zone. The lateral edges of the collision will have lower pressure and will be shifted in rapidity in the direction of the adjacent spectator matter. Thus while we might achieve spinodal decomposition in the center of the collision zone at a particular beam energy, the edge regions might still undergo repulsive compression due to the shifts forward and backward in rapidity. This would in turn affect the slope for protons as a function of rapidity — the so-called wiggle. While the mechanism mentioned above might not be adequate to explain the wiggle phenomenon in its entirety, it is plausible to expect it to modify the wiggle phenomenology. Therefore, a comprehensive mapping of the structure at BES energies will offer new insights into key details of the QCD equation of state in the relevant region of the phase diagram. Although NA49 reported some evidence along these lines Alt et al. (2003), a more comprehensive study is needed for conclusive results. The eTOF will provide proton identification up to a rapidity of 1.2, enabling a study of over a new rapidity region for protons, kaons, and pions. Figure 8, based on protons from 0.9 million minimum-bias UrQMD model events at GeV, illustrates the new parameter space opened up by the eTOF. Figure 8 assumes ideal reaction plane resolution, and the plotted statistical errors are typically a couple of times larger than the expected statistical errors for 7.7 to 19.6 GeV BES-II running using fine centrality bins. The for two different intervals is shown in the panels of the figure. The dependence of every Fourier coefficient is, a priori, of empirical interest. A good illustration of this is provided by constituent quark scaling and its role in QGP discovery as originally revealed by measurements of for mesons and baryons. It is evident from Fig. 8 that the steepening of the proton slope beyond the mid-rapidity region in the relevant regions of is poorly resolved without eTOF, and a substantial region of new phenomenological coverage is opened up by eTOF.
II.5 Elliptic Flow
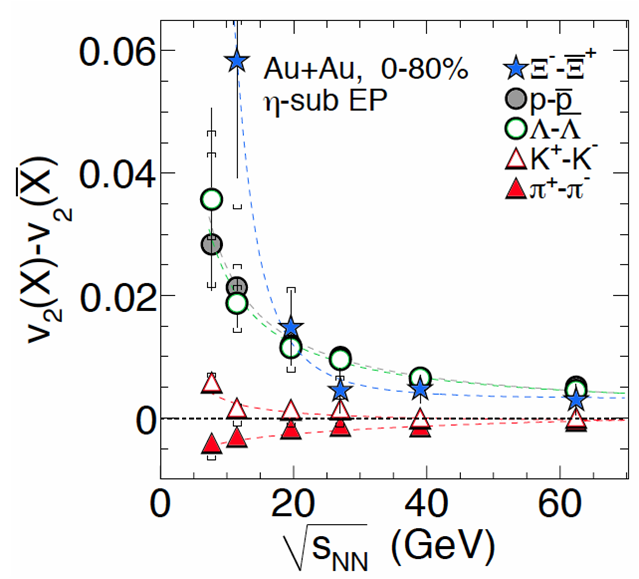
Number of constituent quark scaling (NCQ) of elliptic flow has been seen as one of the cornerstone pieces of evidence that collectivity is established on the partonic level at the top energy of RHIC Adams et al. (2004). One of the goals of the BES program is to see how these key QGP signatures evolve with collision energy. Although the quark number scaling of elliptic flow seems to hold qualitatively for particles and for anti-particles above 19.6 GeV Adamczyk et al. (2013a) (the statistics are limited below 19.6 GeV), when one compares the of particles to their respective anti-particles one sees a very different trend. This is shown in Fig. 9 Adamczyk et al. (2013b). This discrepancy could be suggesting a break down in the scaling behavior. It could also be indicating a more subtle effect coming from the incomplete transparency and partial stopping of the valence quarks. A possible explanation for this behavior is that transported quarks have a very different flow profile from quarks created in the fireball Dunlop et al. (2011). This conjecture could be tested by studying elliptic flow at more forward rapidity where the ratio of transported quarks to created quarks is much higher than at mid-rapidity. The particle to anti-particle differences are expected to increase significantly for . The eTOF will enable these rapidity-dependent measurements of . This can help us better understand the nature of this QGP signal and whether it disappears or is simply obscured by other effects as the collision energy is reduced. It must be demonstrated that the changes in the signature with energy are an effect of QGP physics.
The is a particularly interesting case because it is a meson with a mass close to that of a nucleon. Determining the constituent quark flow behavior of the would be a sensitive test of whether flow is established at the partonic level, especially because there is no transported valence quark effect. The results for the flow of the at the lowest energies of the BES-I are suggestive but far from conclusive due to marginal statistics. This open question may be answered in the BES-II program. Increased luminosities are expected to be provided by extending the bunch length at all BES-II energies and by electron cooling at the lowest three energies (7.7, 9.1, and 11.5 GeV). However, even with these increased luminosities, the of the is still one of the most statistically demanding measurements proposed for BES-II BES (2014). Since this is one of the top statistics drivers of the program, any upgrade that improves acceptance for the directly improves the program. The is detected through the decay to a pair. The iTPC improves the kaon acceptance at low-. The eTOF provides kaon identification up to 1.6 GeV/c in the extended pseudorapidity range . This would lead to a more significant signal.
II.6 Fluctuations - Higher Moments of Conserved Quantities
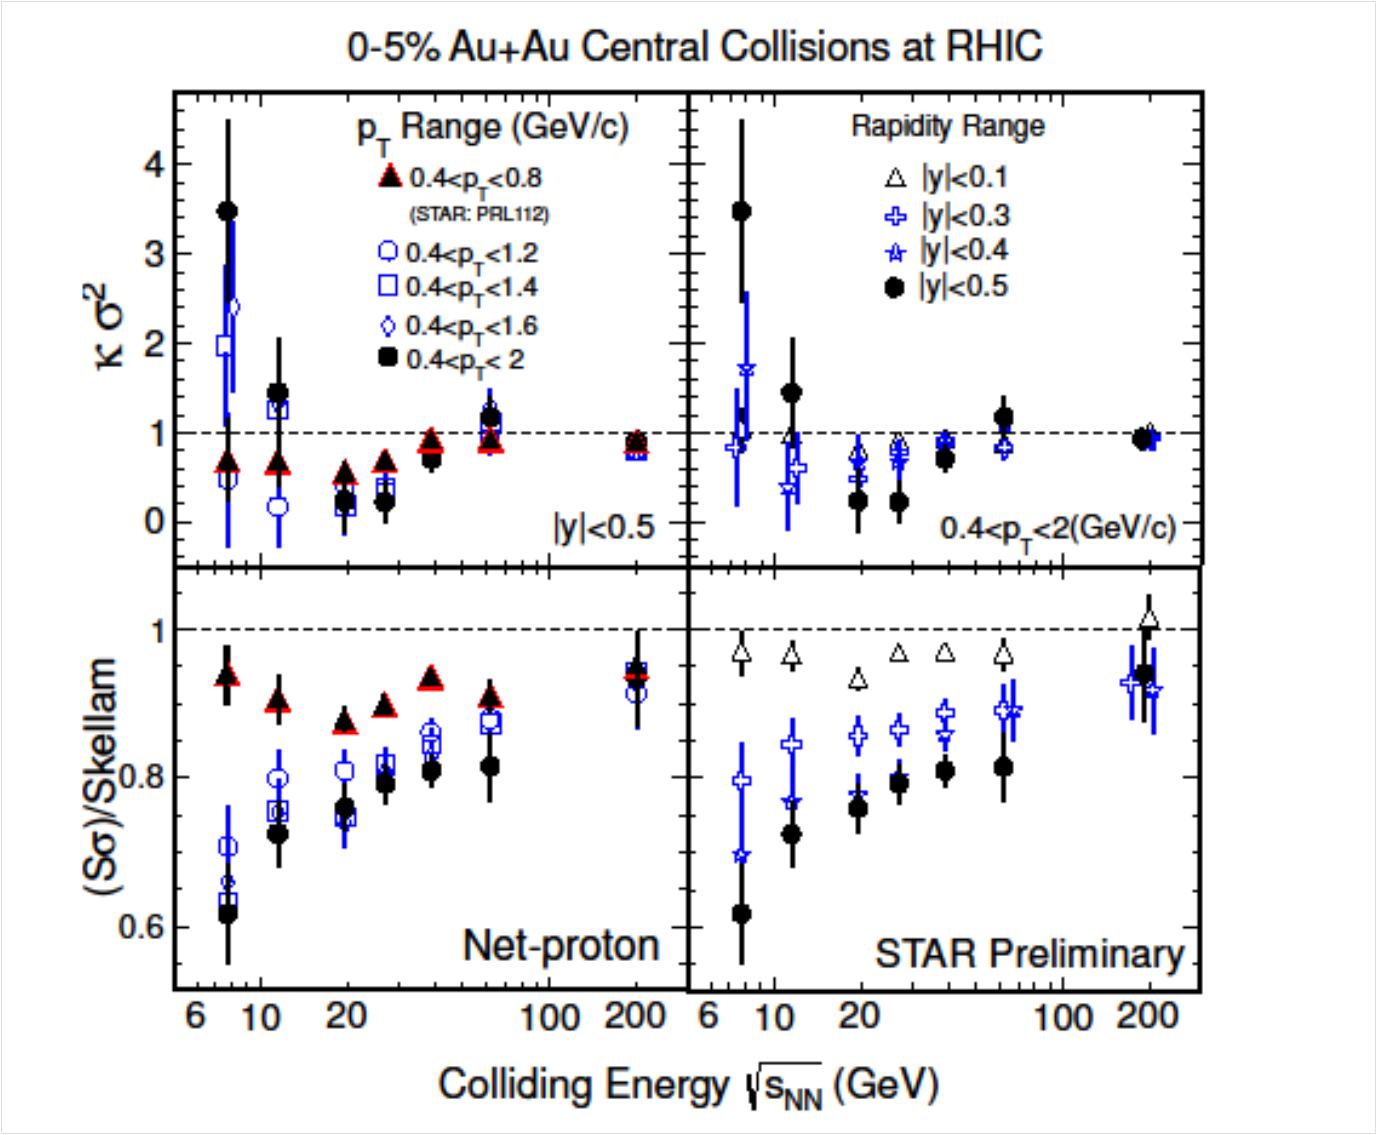
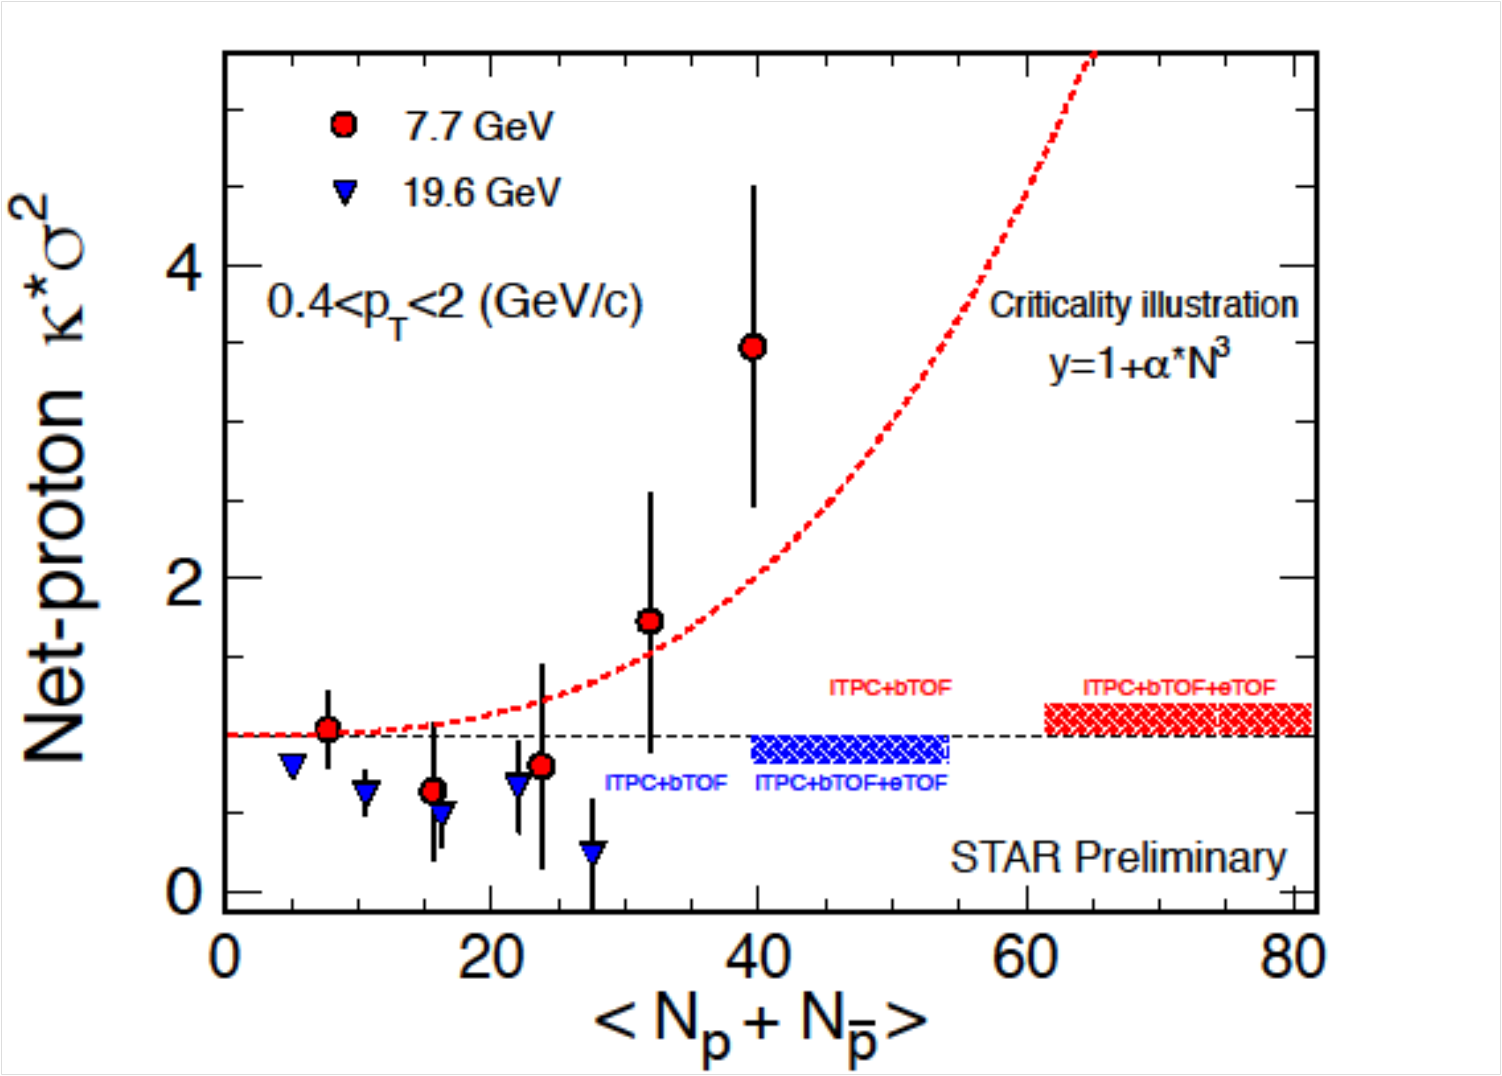
Measurements of net-proton (proxy for net-baryon) and net-kaon (proxy for net-strangeness) kurtosis times variance (), which is the same as the cumulant ratio , are likely the best indicators of critical behavior in the vicinity of a possible critical point in the QCD phase diagram. We have observed that the net-proton fluctuation signals strongly depend on the and rapidity cuts of the protons (see Fig. 10). The net-proton fluctuation analyses have used cuts of GeV/. Using the current TPC, the rapidity is cut at (), while with the iTPC, this cut can be extended to (). Additional particle identification from the eTOF extends the rapidity reach. However as the rapidity is extended past 0.8, the hard acceptance cut imposes a varying low- cut. This requires a different analysis approach. Instead of presenting the sensitivity of as a function of the width of the rapidity window as was done in Fig. 10, we use cuts, which can be opened symmetrically, and consider the sensitivity as a function of the sum of the number of measured protons and anti-protons. This analytical technique is shown in Fig. 11. The STAR BES-I data for 7.7 GeV trend upward with total baryons while for 19.6 GeV, the trend is downward. It is expected that the signal will be large for energies that create systems near the critical point, while for systems with a baryon chemical potential below the critical point, the will drop below unity. The added coverage of the eTOF will enhance the fluctuation signal providing a clearer and more significant indication of critical behavior.
The addition of the eTOF for PID will have a significant impact on the net-kaon and net-charge (which is directly measured from the yields of positive and negative hadrons) fluctuation analyses. The eTOF will allow an extension of the analysis window for net-kaons to and for net-charge to .
III Extending the Energy Scan Below 7.7 GeV with an Internal Fixed-Target and eTOF
In normal collider mode, the lowest collision energy available at RHIC is 7.7 GeV. The collider tried circulating beams at 5.0 GeV but because the luminosity is proportional to (the relativistic of the individual ion beams), operating below 7.7 GeV proved to be impractical. It is important to measure key observables at energies lower than 7.7 GeV for several reasons:
-
•
NA49 has reported that the onset of deconfinement occurs at 7.7 GeV Alt et al. (2008).
-
•
Some of the QGP signatures (local parity violation Adamczyk et al. (2014c) and narrowing of balance functions Adamczyk et al. ) show signs of disappearing at 7.7 GeV. We need to extend the energy range so that we can confirm that these signatures have indeed turned off.
-
•
There are theoretical calculations suggesting that the mixed phase is entered at energies well below 7.7 GeV Steinheimer and Randrup (2012).
The fixed-target program at STAR with the eTOF upgrade will enable the energy scan to extend below 7.7 GeV and address these questions. With the eTOF, the fixed-target program can study the center-of-mass energy region from = 3.0 to 7.7 GeV. Some of the AGS, SPS, and SIS collaborations use projectile kinetic energy per nucleon; in that notation, the above range corresponds to 2.9 to 30.3 AGeV. The five energies of the BES-II collider program cover the baryon chemical potential range from 205 to 420 MeV Cleymans et al. (2006). The inclusion of an additional seven fixed-target energies will extend the range from 420 to 720 MeV with a similar 50 MeV step size (see Fig. 12). The physics topics proposed for normal collider mode can be performed in this extended range.
It is important to note that the physics impact of the eTOF system is significantly different for the fixed-target program than for collider mode. In the BES-II collider program, the addition of the eTOF system extends the momentum range of forward rapidity PID. In the fixed-target program, the roles of the central and forward parts of the detector are reversed. This is due to the large 1-2 unit rapidity offsets between the laboratory and the center-of-mass reference frames. In the next section, we show that eTOF provides essential PID in the mid-rapidity region.
III.1 Acceptance
The calculation of the fixed-target acceptance of the STAR detector is similar to the collider mode acceptance calculations discussed in the previous section with only a few exceptions. The 1 mm thick gold target is located at +210 cm. This is the optimal location for the target because it allows measurements from target rapidity to mid-rapidity. The 210 cm shift in the location of the interactions has the following effect on the the acceptance and PID limits of STAR:
-
•
The low- threshold values for the eTOF are defined by energy loss in the backplane of the TPC, and these remain unchanged.
-
•
The limits of the detector are changed. The barrel TOF system covers up to = 1.47. The eTOF system covers = 1.52 to 2.24.
-
•
The track length in the STAR TPC for particles with is longer in fixed-target events. Therefore, the resolution for these tracks is better than for tracks with similar values in collider events. A sampling of the resolution is given in Table 3.
-
•
The flight path for particles with is longer in fixed-target events. Therefore, the TOF PID limits for these tracks extend to higher momentum than for tracks with similar in collider events. A sampling of the PID limits using TOF is given in Table 4.
The acceptance and PID ranges for fixed-target events are shown in Figs. 13, 14, 15, and 16.
| Track Length | ||||
|---|---|---|---|---|
| (cm) | % | (GeV/c) | (GeV/c) | |
| 0.0 | 126 | 5.5 | 0.88 | 1.47 |
| 0.5 | 142 | 5.2 | 0.79 | 1.31 |
| 1.0 | 194 | 4.5 | 0.60 | 0.98 |
| 1.5 | 296 | 3.7 | 0.40 | 0.66 |
| 1.7 | 252 | 4.0 | 0.33 | 0.54 |
| 1.9 | 205 | 4.4 | 0.27 | 0.44 |
| 2.1 | 174 | 4.7 | 0.22 | 0.36 |
| 2.24 | 174 | 5.3 | 0.19 | 0.31 |
| flight path | (pro) | |||||
|---|---|---|---|---|---|---|
| (cm) | (cm) | (%) | (GeV/c) | (%) | (GeV/c) | |
| 0.0 | 220 | 200 | 1.6 | 1.7 | 2.8 | 2.6 |
| 0.5 | 248 | 200 | 1.6 | 1.6 | 2.7 | 2.4 |
| 1.0 | 339 | 200 | 1.5 | 1.3 | 2.4 | 2.1 |
| 1.47 | 453 | 200 | 1.5 | 1.1 | 2.1 | 1.7 |
| 1.52 | 539 | 188 | 1.5 | 1.1 | 2.1 | 1.7 |
| 1.6 | 531 | 172 | 1.6 | 1.0 | 2.2 | 1.6 |
| 1.7 | 523 | 155 | 1.7 | 0.9 | 2.4 | 1.4 |
| 1.8 | 517 | 139 | 1.9 | 0.8 | 2.6 | 1.3 |
| 1.9 | 512 | 125 | 2.0 | 0.74 | 2.8 | 1.2 |
| 2.0 | 508 | 113 | 2.2 | 0.67 | 2.9 | 1.05 |
| 2.1 | 505 | 102 | 2.4 | 0.61 | 3.1 | 0.95 |
| 2.2 | 502 | 92 | 2.7 | 0.55 | 3.3 | 0.86 |
III.2 Energy Range Accessible
In fixed-target mode, the center-of-mass of the system is boosted in rapidity. Therefore, the mid-rapidity PID provided by the eTOF upgrade affects the range of energies that can be studied. Table 5 shows a listing of the proposed fixed-target energies and the corresponding rapidity offsets. The resulting from the boosts are indicated in Figs. 13, 14, 15, and 16 for the higher energies of the fixed-target program. From these figures, it is evident that the PID provided by the eTOF is needed for pion, kaon, and proton mid-rapidity studies at energies of 4.5, 5.2, 6.2, and 7.7 GeV. It should be noted that even with the eTOF PID, studies of protons and kaons will be limited to backward of mid-rapidity for the 7.7 GeV system. This system will also be studied in the collider program with a larger PID acceptance. Thus the 7.7 GeV system will provide important systematic consistency checks between fixed-target and collider mode, however, it is not necessary that all analyses be available for such checks. Without the eTOF, the 5.2, 6.2, and 7.7 GeV fixed-target energies will not be run. These three energies require RHIC to be tuned for energies that are not part of the BES-II program, and this can not be justified without the mid-rapidity acceptance with PID. It should also be noted that if these energies are not run in fixed-target mode, a 170 MeV gap will be left in the energy scan just below the 215 MeV range covered by the collider portion of the scan (see Table 5).
| Collider | Fixed Target | AGeV | (MeV) | |
|---|---|---|---|---|
| 62.4 | 7.7 | 30.3 | 2.10 | 420 |
| 39 | 6.2 | 18.6 | 1.87 | 487 |
| 27 | 5.2 | 12.6 | 1.68 | 541 |
| 19.6 | 4.5 | 8.9 | 1.52 | 589 |
| 14.5 | 3.9 | 6.3 | 1.37 | 633 |
| 11.5 | 3.5 | 4.8 | 1.25 | 666 |
| 9.1 | 3.2 | 3.6 | 1.13 | 699 |
| 7.7 | 3.0 | 2.9 | 1.05 | 721 |
Although a detailed proposal for running the fixed-target program has not been finalized, the general concept has always been a key part of the BES-II proposal. Based on the performance from the 2015 fixed-target test, it is clear that the number of events which can be recorded is limited by the DAQ rate, the expected store length, and the machine duty cycle. The estimate is that approximately 50 million events can be recorded per day of running, independent of energy.
III.3 Mapping out the Phase Space
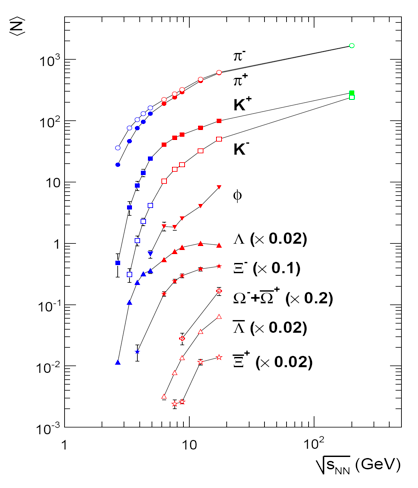
Exploring the phase diagram of QCD matter requires that at each collision energy there is sufficient yield (both and full acceptance) of each species to determine the chemical equilibrium and values. The coverage maps shown in Figs. 13, 14, and 15 demonstrate that we have acceptance for , , and from to for all fixed-target energies except 7.7 GeV, where even with eTOF PID, the and acceptances do not reach . The efficiency for hyperon reconstruction is a convolution of the single particle acceptances. This will make possible -dependent measurements of , , and . Currently, there is only a single measurement for collision energies below 7.7 GeV Chung et al. (2003). The STAR fixed-target program will map out the turn on of production with collision energy. Measurements of , , and have not been made at these energies previously (see Fig. 17). Studying the onset of the production of these species could be possible with the fixed-target program using the eTOF.
III.4 The Onset of Deconfinement
NA49 has argued that the onset of deconfinement is achieved at 7.7 GeV Alt et al. (2008). This result is based on a set of inclusive observables: there is a kink in the rate of increase of the pion production with collision energy, there is a step in the slope parameter of the kaon spectra, and there is a peak (horn) in the ratio. We will study all of these inclusive observables. In addition, the fixed-target program will allow us to track other QGP signature observables, studied in BES-I, spanning a collision energy range from 3.0 to 19.6 GeV ( from 720 to 205 MeV). The eTOF PID is essential for a number of deconfinement observables that will be studied in the fixed-target program:
-
•
Number of constituent quark scaling of elliptic flow is a key QGP signature Adams et al. (2005). The results from BES-I show the scaling is exhibited independently for particles and anti-particles Adamczyk et al. (2013b). At fixed-target energies, the scaling for particles is expected to break. The elliptic flow is a mid-rapidity observable, and PID is necessary in order to observe the scaling. This study is only possible with eTOF as it is needed for mid-rapidity proton PID for all fixed-target energies except 3.0 GeV.
-
•
One form of balance function is a rapidity correlator. This correlator is sensitive to QGP formation Pratt (2012). The BES-I data show the balance function narrowing signal decreases with decreasing beam energy. This signal is almost, but not quite, gone at 7.7 GeV Adamczyk et al. . Lower energy measurements are needed to demonstrate that this signature disappears. A key to the sensitivity of this measurement is the width of the total rapidity window. The eTOF extends the rapidity range and will improve the significance of this study.
-
•
Strangeness enhancement is seen as an important QGP signature. The energy range covered by the fixed-target program sees the opening of several strange particle production channels (see Fig. 17). The strange particle production is maximum at mid-rapidity, and cleanly identifying weakly decaying strange hadrons requires clean PID for the daughters. The eTOF significantly improves the efficiency and acceptance for strange hadrons and allows measurements of their rapidity density distributions.
III.5 Compressibility and the First-Order Phase Transition
Assuming that there is a first-order phase transition, the concept of a single “onset of deconfinement” is an oversimplification. Depending on the universality class of the phase transition, there may be a spinodal decomposition which would imply a mixed-phase region with a negative compressibility. Rather than a single “onset”, there may actually be several interesting onsets: the lowest energy which causes some fraction of the system to enter the mixed phase region, the energy at which the system spends the maximum amount of time in the instability regime, and the energy at which the system passes into the pure QGP phase. In order to understand the nature of the phase transition, we propose to study several observables which are expected to have sensitivity to the compressibility. The observables for which eTOF PID is essential include:
-
•
The directed flow of protons, which offers sensitivity to the early compressibility. Most of these particles are transported participants recoiling off the interaction region Adamczyk et al. (2014a); Stoecker (2005); Steinheimer et al. (2014); Konchakovski et al. (2014); Cassing et al. (2014); Nara et al. (2016). The eTOF is needed to study the evolution of the mid-rapidity“wiggle” which is particularly sensitive to compressibility and is known to be absent Liu et al. (2000) at the lower end of the proposed fixed-target beam energy range.
- •
-
•
The volume of the pion source, measured through femtoscopy Lisa et al. (2005). The eTOF is needed for mid-rapidity PID for energies from 4.5 to 7.7 GeV.
-
•
The width of the pion rapidity density distribution, which has been argued to be sensitive to the speed of sound in nuclear matter Petersen and Bleicher (2006). This study relies on the ability to characterize the shape of the rapidity density distribution. Measurements with sufficient rapidity acceptance are required in order to understand the shape of the distribution. Mid-rapidity pion measurements are only possible using the eTOF for PID for energies above 4.5 GeV.
-
•
The elliptic flow of protons, which has been shown to change sign at a fixed-target beam energy of 6 AGeV ( GeV) Pinkenburg et al. (1999). This sign change of is explained by the transit speed of the projectile nucleus through the target nucleus matching the expansion speed from compression (speed of sound). Mid-rapidity PID from eTOF is essential for further investigation of this behavior.
-
•
The Coulomb potential of the pion source provides an independent means of assessing the source volume, being affected by the expansion velocity of the system Baym and Braun-Munzinger (1996). To study this physics, pion PID from eTOF is needed at mid-rapidity.
-
•
The life-time of the emitting source, measured through low-mass dileptons Rapp and van Hees (2016).
III.6 Criticality
The observation of enhanced fluctuations would be the clearest evidence that the reaction trajectory of the cooling system had passed near the possible critical end point on the QGP/hadronic gas phase boundary. Recent analyses of the higher moments of the net-proton distributions have suggested the possibility of enhanced fluctuations at 7.7 GeV Adamczyk et al. (2014b). These results require higher statistics to improve the significance. The significance of the higher moments signal has also been shown to depend strongly on acceptance. It was shown in Fig. 11 that the significance of the signal scales as .
An important test to determine if the enhanced fluctuations are related to critical behavior would be to see the fluctuation signals return to their base-line levels at energies below 7.7 GeV. The energies of the fixed-target program will provide these important control studies, allowing critical behavior searches to be extended to higher . Clean PID is essential for this analysis and its sensitivity has been shown to depend strongly on the efficiency and acceptance. At 4.5 GeV, test run data indicate that we accept 20% of all protons using the current configuration of the TPC. This would drop to 5% for the 7.7 GeV fixed-target energy. The key mid-rapidity coverage of the eTOF raises these acceptance numbers to 50% and 20% respectively (increasing the significance of the results by a factor of 15 to 65). Although there are some fluctuation analyses performed by the NA49 Afanasiev et al. (2001) collaboration, the more sensitive higher moments studies have been done only by STAR Adamczyk et al. (2014b, d), PHENIX Adare et al. (2015), and are being studied by HADES at 2.42 GeV. There were no critical fluctuation studies performed at the AGS so the fixed target program will provide the first data in this energy regime.
III.7 Chirality
Dilepton experiments have been an important part of the physics program at almost all heavy-ion facilities, with the notable exception of the AGS. At the lowest energies, HADES measured e+e- productions in Au+Au collisions at = 2.42 GeV. In the SPS heavy-ion program, dilepton data were taken by experiments Helios-3, NA38/50, CERES, and NA60. And at RHIC, both PHENIX and STAR have dilepton capabilities. The eTOF detector will provide electron ID at mid-rapidity for all energies of the fixed-target program. This provides the first opportunity to study the evolution of the low-mass dilepton excess in this collision energy region in which the low-mass yield might be also sensitive to the emitting source temperature in addition to being sensitive to the total baryon density. These dependencies will help us to understand the mechanism of in-medium broadening which is the fundamental probe of chiral symmetry restoration in hot, dense QCD matter.
III.8 Hypernuclei
The first species of hypernuclei, H and H, were discovered in the 1950s Sekido and Elliot (1985). Several isotopes of hyper-helium and hyper-lithium have been found in kaon beam -transfer reactions. In heavy-ion collisions, light nuclei are formed through coalescence of nucleons. As the energy is raised, nucleons can coalesce with hyperons to form light hypernuclei. At even higher energies, anti-nucleons can coalesce to form light anti-nuclei. This coalescence mechanism has allowed STAR to make the discoveries of anti-hyper-tritium () Abelev (2010) and anti-alpha () Agakishiev et al. (2011).
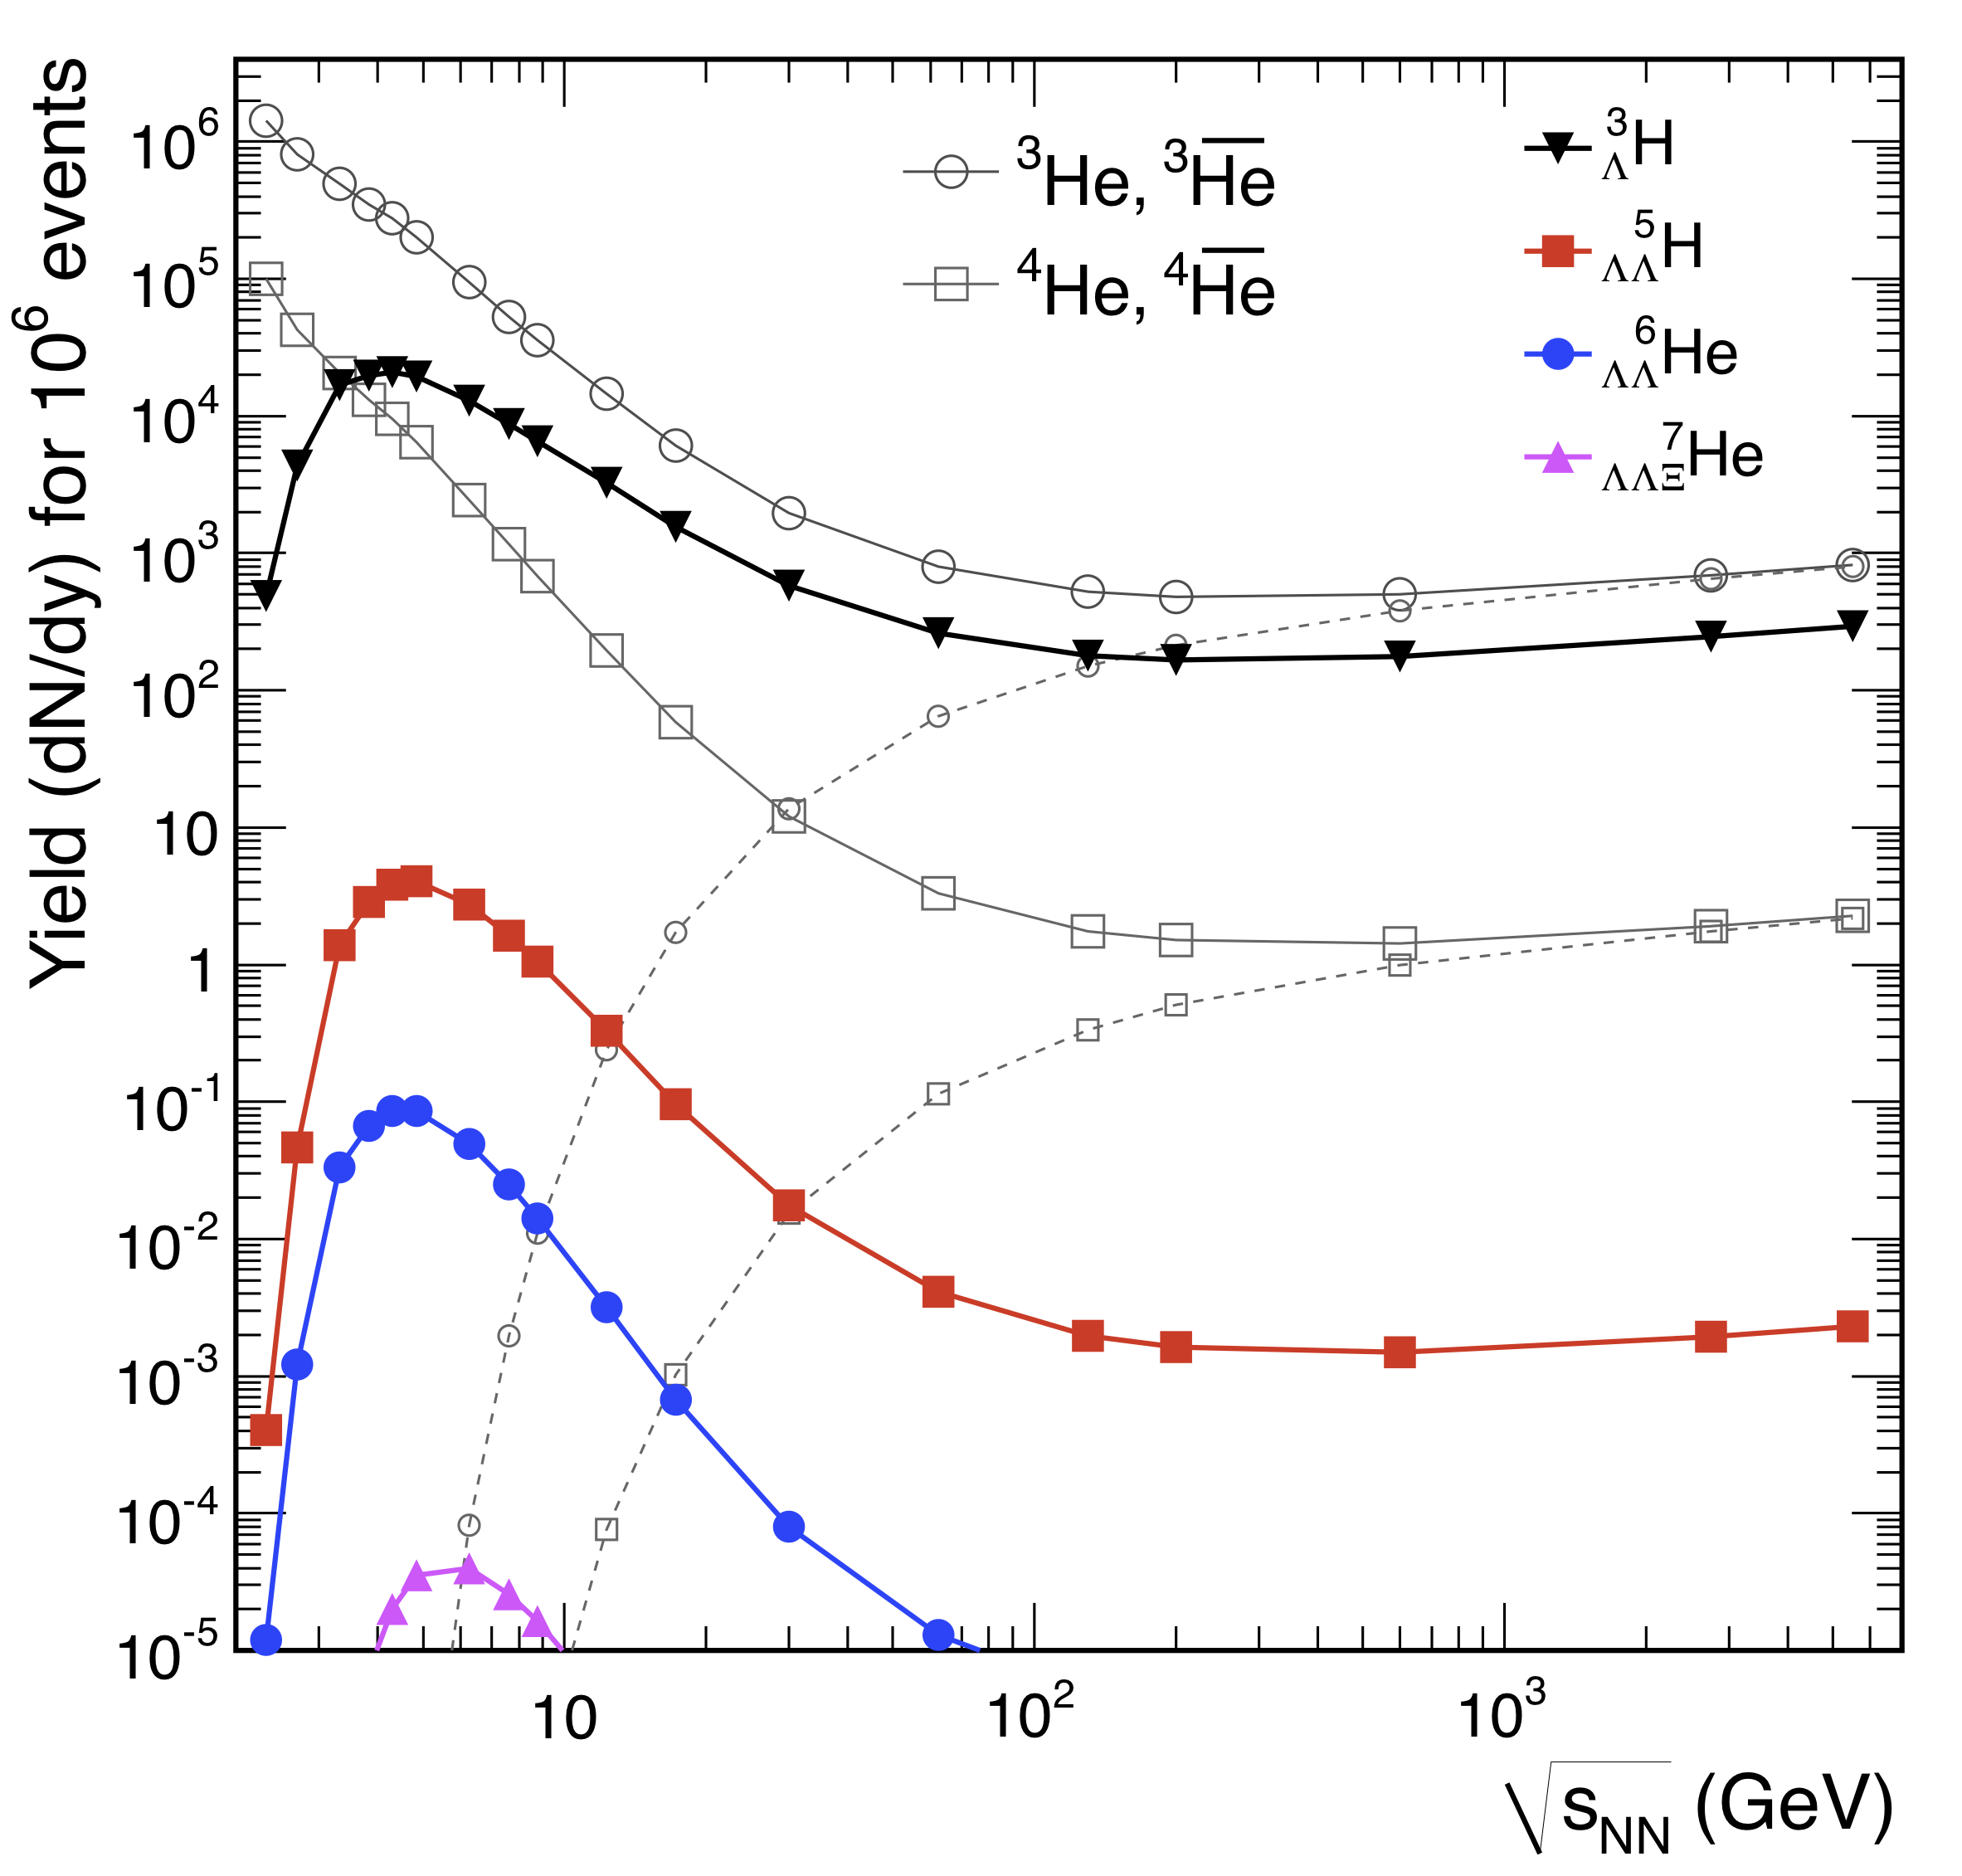
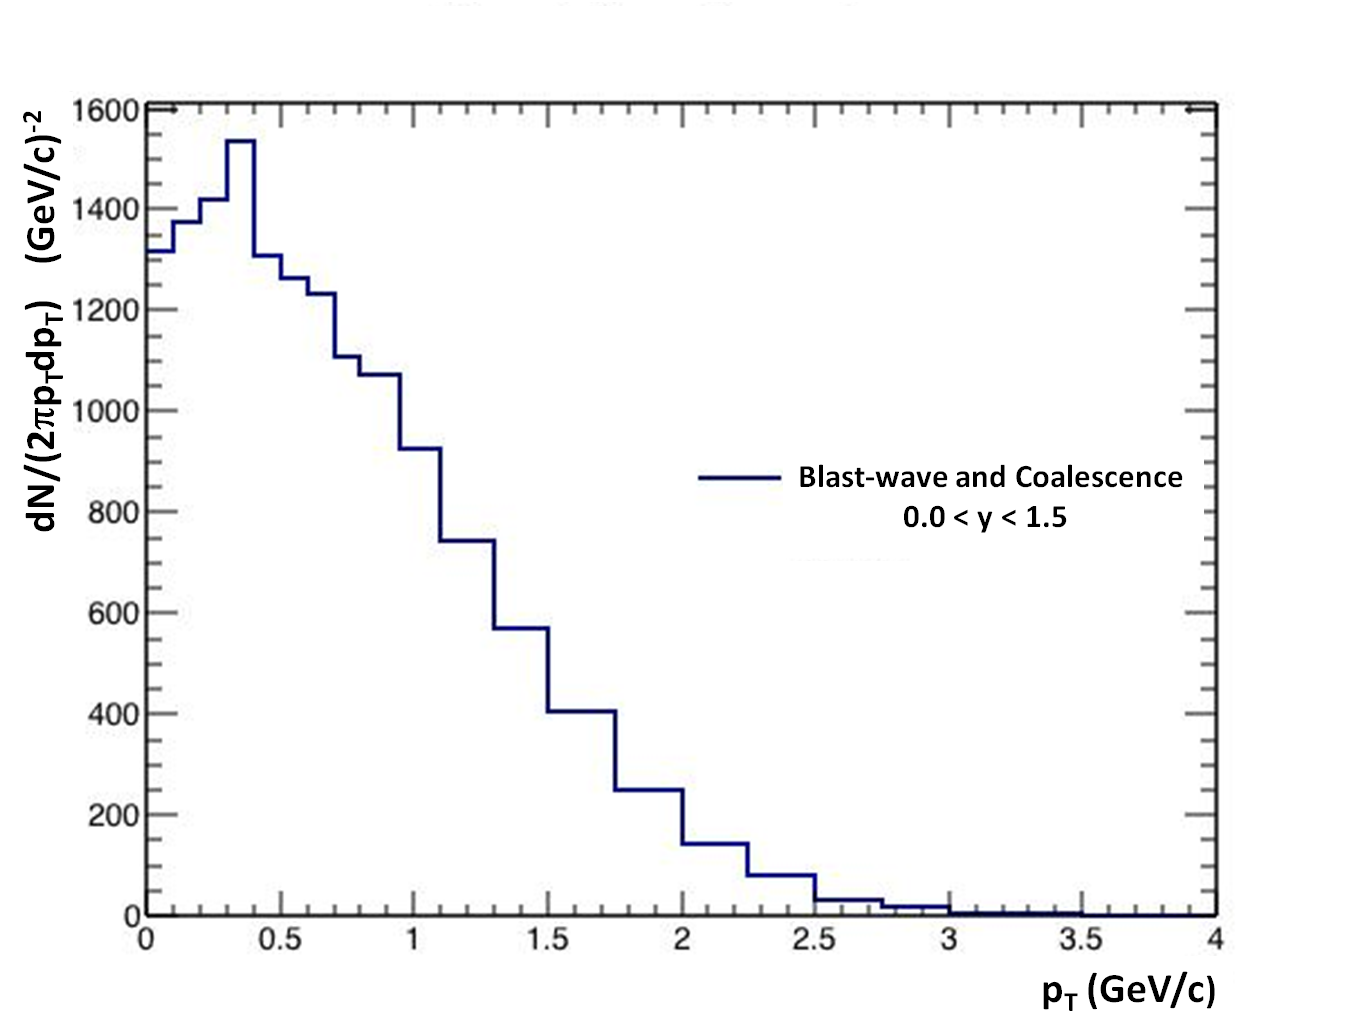
The energy regime covered by the fixed-target program (3.0 to 7.7 GeV) should be optimal for the formation of matter (as opposed to anti-matter) hypernuclei. At energies below 3.0 GeV, few hyperons are produced, whereas at energies above 8 GeV, the increased production of anti-baryons stifles formation of composites of matter particles (see Fig. 18). Meaningful samples of H and H will be observed at all the fixed-target energies. Figure 19 shows the expected distribution of hypertritons from a single day of running at 4.5 GeV assuming a coalescence model for production and a blast wave model to describe the distribution. These simulations were made assuming eTOF coverage and PID, which increases the efficiency of H reconstruction by a factor of eight. The statistics are expected to be comparable to STAR data samples from 200 GeV collider data; this will allow a precise measurement of the light hypernuclei lifetimes and a mapping of the HHe, and HHe ratios as a function of . Searches for multi-strange hypernuclei (H and He) make appealing physics goals. However, further simulations are required to determine if these measurements will be feasible with the expected integrated luminosity.
IV Summary
The eTOF upgrade to the STAR detector complements the iTPC upgrade and enables forward PID, critical for precision studies of the rapidity dependence of key bulk property observables. Because this energy regime is characterized by the incomplete transparency of the participant nucleons (partial stopping), inspecting the particle distributions over a wide rapidity interval will help to disentangle dynamic from thermodynamic effects. This additional analysis handle will help constrain the models and help clarify the phase diagram of QCD matter. We emphasize the following signals:
-
•
Dileptons. Extending the rapidity for PID will provide an independent observable to study the baryon density dependence of low-mass dielectron emission, extend electron ID to , and quantify the baryon density effect on broadening.
-
•
Directed flow. Extending PID to = 1.2 will allow the study of over a new rapidity region. This can help confirm the possible softening of the equation of state.
-
•
Elliptic flow. Rapidity dependent measurements of will be enabled. The flow can be studied.
-
•
Fluctuations. Enhanced fluctuation signals will provide a cleaner and more significant indication of possible critical behavior.
For the internal fixed-target program, the eTOF will provide PID for mid-rapidity and justify running at collision energies from 4.5 to 7.7 GeV. This will make it possible to have a comprehensive scan from = 3.0 to 19.6 GeV, = 720 to 205 MeV. Without the mid-rapidity PID provided by eTOF, there would be a large gap in the data from = 590 to 420 MeV. The energy range from 3.0 to 19.6 GeV spans from regions well understood to be compressed baryonic matter up to regions for which partonic behavior is well established. The eTOF upgrade to the STAR detector will bring compelling new physics capabilities to the RHIC BES-II program.
References
- Abelev et al. (2009) B. I. Abelev et al., Experimental Study of the QCD Phase Diagram & Search for the Critical Point: Selected Arguments for the Run-10 Beam Energy Scan, STAR Internal Note SN-0493 ([STAR Collaboration], 2009).
- BES (2014) Studying the Phase Diagram of QCD Matter at RHIC, STAR Internal Note SN-0598 ([STAR Collaboration], 2014).
- Fedotov et al. (2009) A. Fedotov et al., in Proc. of Cool09 (2009) pp. 11–15.
- (4) S. Collaboration, “A fixed target program for star,” In prep.
- iTP (2015) A Proposal for STAR Inner TPC Sector Upgrade (iTPC), STAR Internal Note SN-0619 (2015).
- Anderson et al. (2003) M. Anderson et al., Nucl. Instrum. Meth. A499, 659 (2003).
- (7) Picture courtesy of Thomas Ullrich.
- Allison and Cobb (1980) W. Allison and J. Cobb, Annual Reviews in Nuclear & Particle Science 30, 253 (1980).
- Bichsel (1988) H. Bichsel, Rev. Mod. Phys. 60, 663 (1988).
- TOF (2004) Proposal for a Large Area Time of Flight System for STAR, STAR Internal Note SN-0621 (2004).
- Herrmann (2014) N. Herrmann, Technical Design Report for the CBM Time-of-Flight System (TOF), GSI Report GSI-2015-01999 (2014).
- Alt et al. (2006) C. Alt et al. (NA49), Phys. Rev. C73, 044910 (2006).
- Petersen and Bleicher (2006) H. Petersen and M. Bleicher, Critical point and onset of deconfinement. Proceedings, 3rd Conference, CPOD2006, Florence, Itlay, July 3-6, 2006, PoS CPOD2006, 025 (2006), arXiv:nucl-th/0611001 [nucl-th] .
- Alt et al. (2008) C. Alt et al. (NA49), Phys. Rev. C77, 024903 (2008), arXiv:0710.0118 [nucl-ex] .
- Chvala (2005) O. Chvala (NA49), Proceedings, 18th Nuclear Physics Division Conference of the EPS: Phase Transitions in Strongly Interacting Matter (NPDC 18), Nucl. Phys. A749, 304 (2005).
- Rustamov (2012) A. Rustamov, Central Eur. J. Phys. 10, 1267 (2012), arXiv:1201.4520 [nucl-ex] .
- Adamova et al. (2008) D. Adamova et al., Phys. Lett. B666, 425 (2008), arXiv:nucl-ex/0611022 [nucl-ex] .
- Adamczyk et al. (2015) L. Adamczyk et al. (STAR), Phys. Lett. B750, 64 (2015), arXiv:1501.05341 [hep-ex] .
- Geurts et al. (2013) F. Geurts et al., Nucl. Phys. A904-905, 217c (2013).
- Linnyk et al. (2011) O. Linnyk, E. L. Bratkovskaya, V. Ozvenchuk, W. Cassing, and C. M. Ko, Phys. Rev. C84, 054917 (2011), arXiv:1107.3402 [nucl-th] .
- Linnyk et al. (2012) O. Linnyk, W. Cassing, J. Manninen, E. L. Bratkovskaya, and C. M. Ko, Phys. Rev. C85, 024910 (2012), arXiv:1111.2975 [nucl-th] .
- Rapp (2001) R. Rapp, Phys. Rev. C63, 054907 (2001), arXiv:hep-ph/0010101 [hep-ph] .
- van Hees and Rapp (2006) H. van Hees and R. Rapp, Phys. Rev. Lett. 97, 102301 (2006), arXiv:hep-ph/0603084 [hep-ph] .
- Adamczyk et al. (2014a) L. Adamczyk et al. (STAR), Phys. Rev. Lett. 112, 162301 (2014a), arXiv:1401.3043 [nucl-ex] .
- Stoecker (2005) H. Stoecker, Quark gluon plasma. New discoveries at RHIC: A case of strongly interacting quark gluon plasma. Proceedings, RBRC Workshop, Brookhaven, Upton, USA, May 14-15, 2004, Nucl. Phys. A750, 121 (2005), arXiv:nucl-th/0406018 [nucl-th] .
- Steinheimer et al. (2014) J. Steinheimer, J. Auvinen, H. Petersen, M. Bleicher, and H. Stöcker, Phys. Rev. C 89, 054913 (2014).
- Konchakovski et al. (2014) V. P. Konchakovski, W. Cassing, Y. B. Ivanov, and V. D. Toneev, Phys. Rev. C 90, 014903 (2014).
- Cassing et al. (2014) W. Cassing, V. P. Konchakovski, A. Palmese, V. D. Toneev, and E. L. Bratkovskaya, EPJ Web Conf.C 95, 01004 (2014), arXiv:nucl-th/1408.4313 [nucl-th] .
- Nara et al. (2016) Y. Nara, A. Ohnishi, and H. Stoecker, (2016), arXiv:1601.07692 [hep-ph] .
- Alt et al. (2003) C. Alt et al. (NA49), Phys. Rev. C68, 034903 (2003), arXiv:nucl-ex/0303001 [nucl-ex] .
- Adams et al. (2004) J. Adams et al. (STAR), Phys. Rev. Lett. 93, 252301 (2004), arXiv:nucl-ex/0407007 [nucl-ex] .
- Adamczyk et al. (2013a) L. Adamczyk et al. (STAR), Phys.Rev. C88, 014902 (2013a), arXiv:1301.2348 [nucl-ex] .
- Adamczyk et al. (2013b) L. Adamczyk et al. (STAR), Phys.Rev.Lett. 110, 142301 (2013b), arXiv:1301.2347 [nucl-ex] .
- Dunlop et al. (2011) J. C. Dunlop, M. A. Lisa, and P. Sorensen, Phys. Rev. C84, 044914 (2011), arXiv:1107.3078 [hep-ph] .
- Adamczyk et al. (2014b) L. Adamczyk et al. (STAR), Phys. Rev. Lett. 112, 032302 (2014b), arXiv:1309.5681 [nucl-ex] .
- Adamczyk et al. (2014c) L. Adamczyk et al. (STAR), Phys. Rev. Lett. 113, 052302 (2014c), arXiv:1404.1433 [nucl-ex] .
- (37) L. Adamczyk et al., “Beam-Energy Dependence of Charge Balance Functions from Au+Au Collisions at RHIC,” Submitted Jul. 13, 2015, 1507.03539 .
- Steinheimer and Randrup (2012) J. Steinheimer and J. Randrup, Phys. Rev. Lett. 109, 212301 (2012), arXiv:1209.2462 [nucl-th] .
- Cleymans et al. (2006) J. Cleymans, H. Oeschler, K. Redlich, and S. Wheaton, Phys. Rev. C73, 034905 (2006), arXiv:hep-ph/0511094 [hep-ph] .
- Chung et al. (2003) P. Chung et al. (E895), Phys. Rev. Lett. 91, 202301 (2003), arXiv:nucl-ex/0302021 [nucl-ex] .
- Blume (2005) C. Blume, J. Phys. G31, S57 (2005).
- Adams et al. (2005) J. Adams et al. (STAR), Phys. Rev. Lett. 95, 122301 (2005), arXiv:nucl-ex/0504022 [nucl-ex] .
- Pratt (2012) S. Pratt, Phys. Rev. C85, 014904 (2012), arXiv:1109.3647 [nucl-th] .
- Liu et al. (2000) H. Liu et al. (E895), Phys. Rev. Lett. 84, 5488 (2000), arXiv:nucl-ex/0005005 [nucl-ex] .
- Lisa et al. (2000a) M. A. Lisa, U. W. Heinz, and U. A. Wiedemann, Phys. Lett. B489, 287 (2000a), arXiv:nucl-th/0003022 [nucl-th] .
- Lisa et al. (2000b) M. A. Lisa et al. (E895), Phys. Lett. B496, 1 (2000b), arXiv:nucl-ex/0007022 [nucl-ex] .
- Lisa et al. (2011) M. A. Lisa, E. Frodermann, G. Graef, M. Mitrovski, E. Mount, H. Petersen, and M. Bleicher, New J. Phys. 13, 065006 (2011), arXiv:1104.5267 [nucl-th] .
- Lisa et al. (2005) M. A. Lisa, S. Pratt, R. Soltz, and U. Wiedemann, Ann. Rev. Nucl. Part. Sci. 55, 357 (2005), arXiv:nucl-ex/0505014 [nucl-ex] .
- Pinkenburg et al. (1999) C. Pinkenburg et al. (E895), Phys. Rev. Lett. 83, 1295 (1999), arXiv:nucl-ex/9903010 [nucl-ex] .
- Baym and Braun-Munzinger (1996) G. Baym and P. Braun-Munzinger, Nucl. Phys. A 610, 286c (1996).
- Rapp and van Hees (2016) R. Rapp and H. van Hees, Physics Letters B 753, 586 (2016).
- Afanasiev et al. (2001) S. V. Afanasiev et al. (NA49), Phys. Rev. Lett. 86, 1965 (2001), arXiv:hep-ex/0009053 [hep-ex] .
- Adamczyk et al. (2014d) L. Adamczyk et al. (STAR), Phys. Rev. Lett. 113, 092301 (2014d), arXiv:1402.1558 [nucl-ex] .
- Adare et al. (2015) A. Adare et al. (PHENIX), (2015), arXiv:1506.07834 [nucl-ex] .
- Sekido and Elliot (1985) Y. Sekido and H. Elliot, “Early history of cosmic ray studies,” (D. Reidel Publishing Company, 1985) p. 323.
- Abelev (2010) B. I. Abelev (STAR), Science 328, 58 (2010), arXiv:1003.2030 [nucl-ex] .
- Agakishiev et al. (2011) H. Agakishiev et al. (STAR), Nature 473, 353 (2011), [Erratum: Nature475,412(2011)], arXiv:1103.3312 [nucl-ex] .
- Andronic et al. (2011) A. Andronic, P. Braun-Munzinger, J. Stachel, and H. Stocker, Phys. Lett. B697, 203 (2011), arXiv:1010.2995 [nucl-th] .