Discovery of an Enormous Ly nebula in a massive galaxy overdensity at
Abstract
Enormous Ly Nebulae (ELANe), unique tracers of galaxy density peaks, are predicted to lie at the nodes and intersections of cosmic filamentary structures. Previous successful searches for ELANe have focused on wide-field narrowband surveys, or have targeted known sources such as ultraluminous quasi-stellar-objects (QSOs) or radio galaxies. Utilizing groups of coherently strong Ly absorptions (CoSLAs), we have developed a new method to identify high-redshift galaxy overdensities and have identified an extremely massive overdensity, BOSS1441, at (Cai et al. 2016a). In its density peak, we discover an ELAN that is associated with a relatively faint continuum. To date, this object has the highest diffuse Ly nebular luminosity of erg s-1. Above the 2 surface brightness limit of SB erg s-1 cm-2 arcsec-2, this nebula has an end-to-end spatial extent of 442 kpc. This radio-quiet source also has extended C iv and He ii emission on kpc scales. Note that the Ly, He ii and C iv emission all have double-peaked line profiles. Each velocity component has a full-width-half-maximum (FWHM) of km s-1. We argue that this Ly nebula could be powered by shocks due to an AGN-driven outflow or/and photoionization by a strongly obscured source.
1. Introduction
During the peak epoch of galaxy formation at (e.g., Bouwens et al., 2011), most of the baryons in the Universe reside outside galaxies; they lie within the intergalactic medium (IGM) and circumgalactic medium (CGM) (e.g., Cen et al., 1994; Miralda-Escudé et al., 1996; Hernquist et al., 1996; Rauch, 1998). The IGM and CGM provide a vast reservoir for fueling the star formation of galaxies and also serve as a “sink” for metals driven from the galactic feedback (e.g., Prochaska et al., 2011; Tumlinson et al., 2011). On the other hand, the properties and structures of the IGM/CGM, such as kinematics, morphology, and metallicity, are increasingly reshaped by the energetic processes occuring in galaxies, and therefore the IGM/CGM acts as a laboratory to stringently constrain the physics of the galaxy formation (e.g., Fumagalli et al., 2011).
Intergalactic/circumgalactic filaments have been studied via QSO absorption lines (e.g., Rauch, 1998). But QSO absorption studies are limited due to the sparseness of background QSOs. To reveal the connection of intergalactic gas to galaxies and their circumgalactic medium (i.e. on scales of 100 kpc), one must constrain the full three-dimensional intergalactic/circumgalactic material using more numerous, but fainter, background galaxy populations (e.g., Lee et al., 2014) or directly map the faint diffuse emission of the intergalactic medium (IGM) or circumgalactic medium (CGM) (e.g., Cantalupo et al., 2014; Martin et al., 2015; Borisova et al., 2016). The Ly line is the primary coolant of gas with K and can be used to trace the CGM/IGM via emission. Such Ly nebulae provide us an indispensable opportunity to study the CGM in emission.
Theoretical models suggest that several mechanisms may generate circumgalactic Ly emission: (1) recombination radiation following photoionization (fluorescence) powered by ultraviolet (UV) sources (Gould & Weinberg, 1996; Cantalupo et al., 2005; Geach et al., 2009; Kollmeier et al., 2010); (2) cooling radiation due to the gravitationally heated gas (Fardal et al., 2001; Yang et al., 2006; Dijkstra & Loeb, 2009; Faucher-Giguère et al., 2010); (3) radiation from shock-heated gas driven by the feedback of galactic outflow (e.g., Villar-Martín et al., 2007; Taniguchi & Shioya, 2000; Wilman et al., 2005); and (4) resonant scattering of Ly from the embedded source (Dijkstra & Loeb, 2009; Hayes et al., 2011; Cantalupo et al., 2014; Geach et al., 2014, 2016). The photoionization radiation is generated when the dense regions of the CGM are photoionized by strong ionizing sources and then recombine to emit Ly photons. Cooling radiation is the Ly photons released when gas settles into galactic potential wells (e.g., Yang et al., 2006). Shock-heating can be powered by supernovae, or by relativistic winds or jets resulting from gas accretion onto supermassive black holes (SMBHs). Ly resonant scattering produces extended Ly halos as Ly photons propagate outward and is characterized by a double-peaked structure of the resonant emission lines (e.g., Yang et al., 2014). These mechanisms are believed to power the extended Ly emission in high-density regions of the early Universe. The Ly nebulae/blobs (LABs) are expected to occupy massive dark matter halos ( 1013 M⊙), representing sites of the most active star formation and tracing large-scale mass overdensities (e.g., Steidel et al., 2000; Prescott et al., 2009; Yang et al., 2009).
A few observational efforts have been made to search for Ly nebulae/blobs at . These successful searches include narrowband imaging surveys of random fields (e.g., Steidel et al., 2000; Francis et al., 2001; Palunas et al., 2004; Dey et al., 2005; Yang et al., 2009; Prescott et al., 2009; Yang et al., 2010), narrowband imaging of known overdensities (Matsuda et al., 2005), and targeting biased halo tracers, such as ultraluminous QSOs (e.g., Cantalupo et al., 2014; Hennawi et al., 2015) and radio galaxies (e.g., Heckman et al., 1991; Villar-Martín et al., 2007; Miley & De Breuck, 2008). Using VLT/MUSE, Borisova et al. (2016) present a blind survey for Ly nebulae associated with 17 brightest radio-quiet QSOs at . They find that 100% of the QSOs are associated with Ly nebulae with linear sizes of – 320 kpc. In this sample, the relatively narrow Ly FWHMs (300 – 600 km s-1) are consistent with a fluorescent powering mechanism. Increasing evidence has shown that the Ly nebulae often lie in regions that contain both enhanced UV-radiation (or nearby UV sources) and gas overdensities (Hennawi & Prochaska, 2013; Hennawi et al., 2015).
The extended He ii and C iv associated with Ly nebulae contain crucial information about the powering mechnisms. The extended C iv line allows us to estimate the metallicity of the CGM gas and the size of the metal enriched halos (Arrigoni Battaia et al., 2015). In turn, such metal line emission allows us to examine whether the shocks of the galactic outflow could power the LABs (e.g., Villar-Martín et al., 1999, 2007; Allen et al., 2008; Arrigoni Battaia et al., 2015). Arrigoni-Battaia et al. (2015a) conducted a deep survey of 13 Ly blobs in the SSA22 overdensity (Steidel et al. 2000; Matsuda et al. 2005), targeting the He ii and C iv . These observations did not detect extended He ii and C iv emission in any of the LABs, suggesting that photoionization could be a major powering mechanism. Borisova et al. (2016) also did not detect strongly extended He II and C IV emission in their sample of the 17 ultraluminous QSOs, indicating a large fraction of the gas in massive QSO host halos at could be cold ( K) and metal-poor (). Prescott et al. (2009) detect a LAB that has a spatial extent of 80 kpc at associated with extended C iv and He ii. The Ly, C iv, He ii and C iii]lines all show a coherent velocity gradient of 500 km s-1, strongly indicating a 50 kpc large rotational disk illuminated by an AGN.
Recently, two enormous Ly nebulae (ELANe) have been discovered to have a large spatial extent of kpc (Cantalupo et al., 2014; Hennawi et al., 2015). These ELANe further offer excellent laboratories to detect and map the gas in the dense part of the intergalactic medium (IGM), and to study how the IGM feeds star formation in massive halos (Martin et al., 2014, 2015). Arrigoni Battaia et al. (2015) conducted deep spectroscopic integrations targeting He ii and C iv emission and report a null detection, suggesting ELANe are mainly due to AGN photoionization on the cool, metal-poor CGM gas.
In this paper, we report a discovery of another ultraluminous ELAN that resides near the density peak of our newly discovered massive overdensity BOSS1441 at (Cai et al. 2016a). This nebula has a projected linear size of kpc, comparable with the Slug nebula (Cantalupo et al., 2014), and remarkably extended He ii and C iv emission over kpc. The Ly, He ii and C iv lines all show double-peaked kinematics, with each component having the line widths of 700 1000 km s-1. The large spatial extent of Ly emission, the strongly extended He ii and C iv, and the emission line structures and kinematics all make this ELAN unique. This Ly nebula resides in an overdense field selected utilizing the largest QSO spectral library from the Baryon Oscillations Spectroscopic Survey (BOSS) (e.g., Dawson et al., 2013). It contains a group of extremely rare, high optical depth Ly absorption (Cai et al. 2015) arising from the IGM overdensity and a rare QSO group (e.g., Cai et al., 2016). We refer to this program as MApping the Most Massive Overdensity Through Hydrogen (MAMMOTH) (Cai et al. 2015). In this paper, we refer this nebula as MAMMOTH-1.
This paper is structured as follows. In §2, we introduce the selection of MAMMOTH-1 and our follow-up observations. In §3, we discuss our observational results. In §4, we discuss the physical properties and several powering mechanisms that could be responsible for such a unique ELAN. We also estimate the cool gas mass. We give a brief summary in §5. We convert redshifts to physical distances assuming a CDM cosmology with , and (). Throughout this paper when measuring distances, we normally refer to physical separations or distances. We use cMpc to represent comoving Mpc, and kpc to represent physical kpc.
2. Observations
2.1. Target Selection
MAMMOTH-1 is located in the density peak of the large-scale structure BOSS1441 (Cai et al. 2016a). BOSS1441 was selected because this field contains a group of 5 strong Ly absorption systems within a 20 comoving Mpc (cMpc) scale at . Each Ly absorption has an effective optical depth on a scale of 15 cMpc of the mean optical depth (). These absorption systems are not due to DLAs. Two of them have and the optical depth is higher than the threshold of coherently strong Ly absorption (CoSLA, see Cai et al. 2016a). This group of absorbers satisfies the selection criteria (a) – (d2) proposed in Cai et al. (2015). The redshift is chosen by our custom narrowband filter NB403.
The NB403 filter has a central wavelength of Å and a bandwidth of FWHM Å. The NB filter is very efficient to search for the overdensities, because (1) the BOSS QSO density peak lies at . With a NB filter at a similar redshift, we can fully take advantage of the SDSS Ly forest survey; (2) The KPNO-4m/MOSAIC camera is highly sensitive at 4000 Å. In addition, is a good redshift for studying galaxy properties using ground-based telescopes. Optical and infrared spectrographs can fully cover the emission lines from Ly to H.
2.2. KPNO-4m/MOSAIC Narrowband + Broadband Imaging
After selecting BOSS1441 field, we conducted deep narrowband + broadband imaging and multi-object spectroscopy to select and confirm Ly emitting galaxies (LAEs). We used the KPNO-4m/MOSAIC-1.1 camera for deep imaging with a custom narrowband filter NB403 and the Bw broadband filter. These deep imaging observations were designed to reveal LAEs in the BOSS1441 field.
We briefly review our observations in BOSS1441 field. More details can be found in Cai et al. (2016a). The BOSS1441 field was observed on Mar. 2013, Apr. 2014, and Jun. 2014. For the NB403 filter, the total exposure time was 17.9 hours, which consisted of individual 15 or 20 minute exposures with a standard dither pattern to fill in the gaps between the eight MOSAIC CCD chips. The seeing ranged from , with the median seeing about . For the Bw filter, the total exposure time is 3 hours, which consists of individual 8 minute exposure with fill gap dither pattern. The seeing for taking Bw band ranges from , with the median value of 1.37′′. Around the LAE density peak region, we discovered strong, highly extended Ly emission: the ELAN MAMMOTH-1, which is detected in each individual frame with a 15 – 20 min exposure. The broadband filter (Bw) was observed for total 3 hours to match the depth of narrowband filter. These observing conditions enable us to achieve a narrowband magnitude at 5 (aperture: 2.5”), and Bw-band magnitude at 5. This depth corresponds to a Ly surface brightness limit of SB erg s-1 cm-2 arcsec-2.
2.3. LBT Imaging and Multiobject Spectroscopy
We used the Large Binocular Camera (LBC) on the Large Binocular Telescope (LBT) to obtain deep imaging using the , , and broadband filters. The LBC imaging enables the selection of the star-forming galaxies at (e.g., Adelberger et al., 2005) and helps to eliminate [OII] contaminants using the BX galaxy selection technique.
We also used the Dual channel of the Medium-Dispersion Grating Spectroscopy (MODS) (Byard & O’Brien, 2000) on the LBT to spectroscopically confirm the redshifts of galaxies and the Ly nebula in the BOSS1441 overdense field. The LBT/MODS provides high efficiency over 3200Å – 10,000 Å with a resolution of . We used a dichroic that divides the incoming beam at 5700Å. This configuration covers Ly and a few interstellar lines, e.g., C iv , He ii , C iii] , for galaxies at .
We used a MODS mask to observe the MAMMOTH-1 nebula and other LAEs in the field. The total exposure time was 6 hours. Each mask was split into six 1,800 sec integrations, with a typical seeing of 1′′. The slit length on the MAMMOTH-1 nebula is (Figure 1).
The MODS data reduction followed the LBT/MODS reduction routine. First, each raw image was processed with the MODS CCD reduction utilities (modsTools v03) to obtain bias-subtracted and flat-fielded images. We generated polynomial fits to the arc calibration to determine the transformation between image pixels and wavelength. The sky model was fit to each image using B-splines and then subtracted. We used LACOSMIC (Van Dokkum 2010) to identify cosmic rays during the construction of the sky model. The individual exposures were combined with inverse variance weighting to produce the final 2D spectrum.
3. Observational Results
3.1. Mapping the Ly Emission
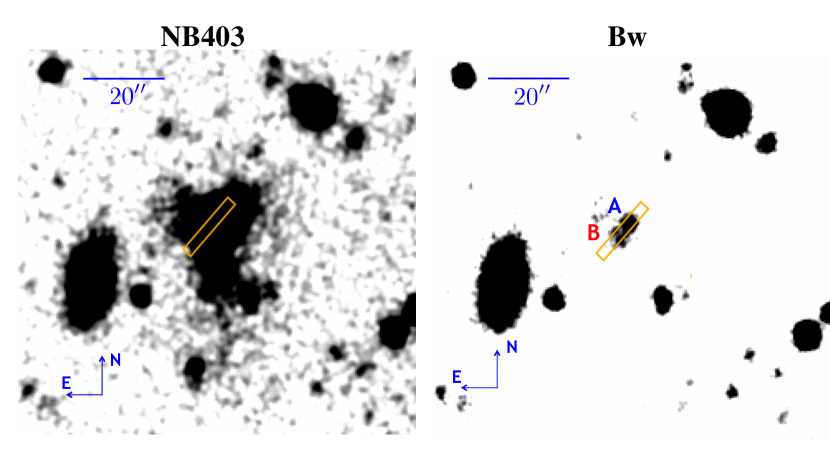
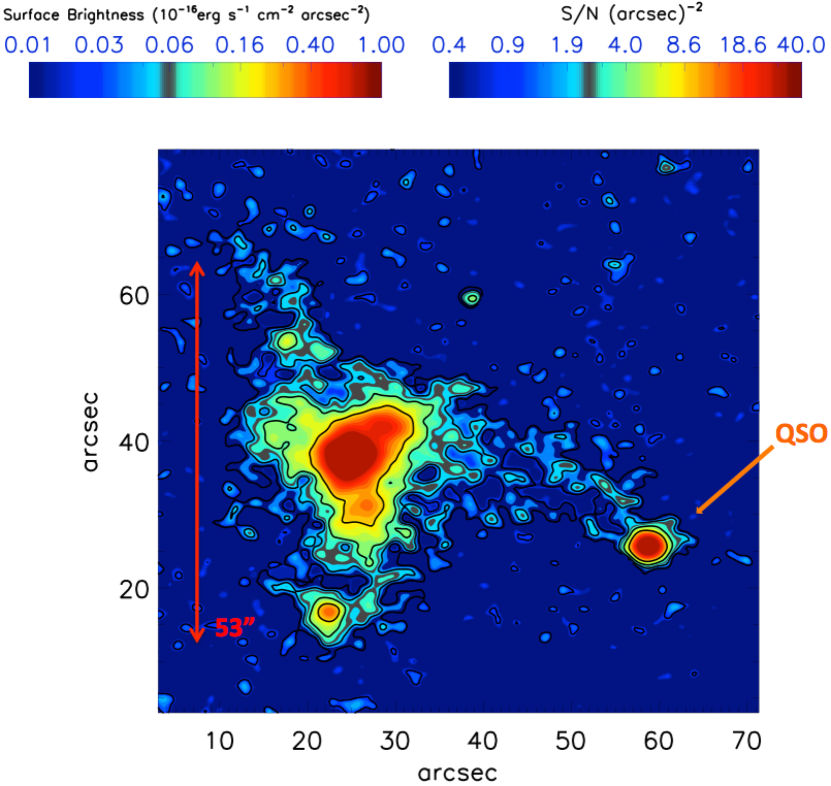
In Figure 1, we present the stacked images of MAMMOTH-1 in both the NB403 narrowband and Bw broadband images. We also overplot the LBT/MODS spectral slit. From this figure, we detect extended structures in both the narrowband (NB403, left panel) and broadband images (Bw, right panel). In the Bw broadband, we detect multiple sources associated with the MAMMOTH-1. In Figure 2, we present the continuum subtracted Ly image. We smooth the image using a Gaussian Kernel with (Cantalupo et al., 2014; Hennawi et al., 2015). Within the 2 ( erg s-1 cm-2 arcsec-2) surface brightness contour, this ELAN has an end-to-end projected extent of 53 arcsec (442 physical kpc).
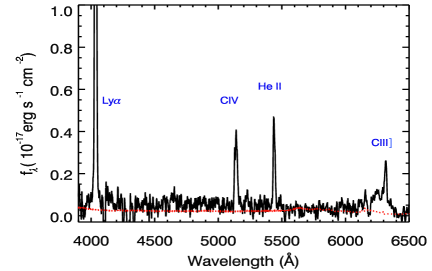
In the broadband image, the brightest two sources: brighter source A () and fainter source B (, ) are marked in Figure 1. Source B resides in the flux peak of the broad-band subtracted narrowband image. Our LBT/MODS spectroscopy shows that source A is a low-redshift AGN at , while source B is an object at . In Figure 3, we present the 1-D spectrum of source B which has strong emission in Ly, He ii, C iv, and C iii]. Using LBT/LBC imaging, we find that source B has a brightness of , , . Although it is difficult to identify all the possible powering sources associated with MAMMOTH-1, source B’s location and redshift suggest that it could be the dominant powering source of MAMMOTH-1. We use source B’s position as the center of the MAMMOTH-1: = 14:41:24.475 +40:03:09.45.
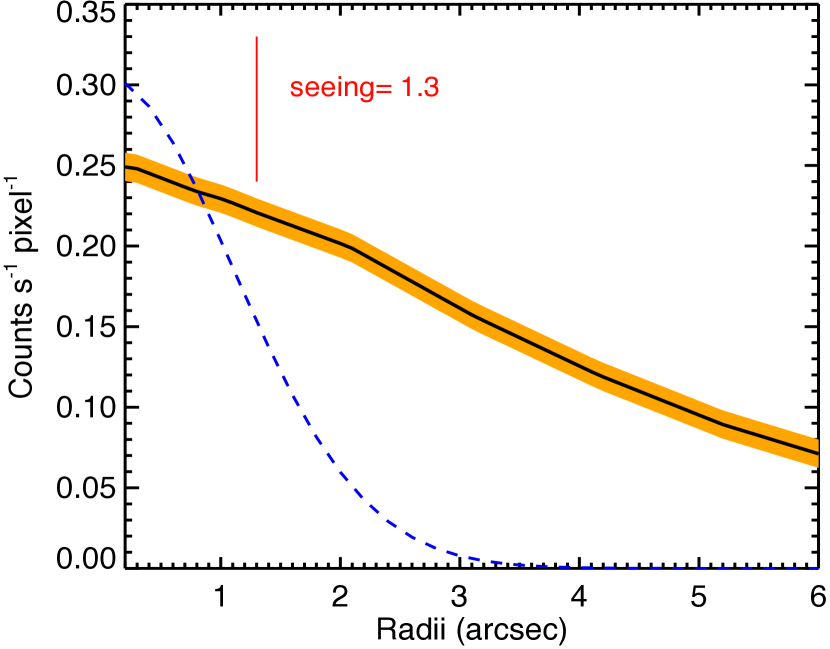
From the broadband-subtracted narrowband image (Figure 2), we measure that MAMMOTH-1 has a total Ly luminosity of erg s-1. Unlike ELANe powered by ultraluminous type-I QSOs, the Ly emission of MAMMOTH-1 arises mainly from the diffuse nebula rather than from the point-spread function (PSF). In Figure 4, we present the radial profile of MAMMOTH-1’s surface brightness. This ELAN has an extremely high extended nebular luminosity, and the central PSF contributes only of the total Ly luminosity. If we subtract the Ly PSF (source B in Figure 1), MAMMOTH-1 has an extended nebular Ly luminosity of erg s-1, the highest discovered to date. We summarize the size and luminosity of MAMMOTH-1 in Table 1.
In Figure 2, the northern/eastern part of MAMMOTH-1 seems to have a filamentary structure. If this filamentary structure is real, it aligns the same direction with the morphology of the large-scale structures (see Cai et al. 2016a). In the cosmic hierarchical nature of structure formation, large-scale filaments are formed out of the merging of small-scale pieces. Simulations suggest that cosmic webs containing baryonic matter tend to align with underlying large-scale structures of dark matter (e.g. Cen et al. (1994); Cen & Ostriker (2006); Fukugita & Peebles (2004), Colberg et al. 2005, Hellwing 2014). Our observations tentatively support these simulations.
3.2. Emission Line Profiles
The deep LBT/MODS spectra reveal Ly, He ii, C iv, and C iii] emission (Figure 4). Both C iv and He ii extend over kpc scales (Figure 5). Extended He ii and C iv have been observed previously in radio galaxies, but MAMMOTH-1 is unlikely to be powered by radio jet. From the FIRST radio catalog (Becker et al. 1995), we do not find any radio-loud sources with a radio flux at 1.4 GHz mJy in the area within 30 arcsec of the MAMMOTH-1 nebula. We use the redshift of the non-resonant He ii line as the redshift of MAMMOTH-1, yielding .
The Ly, C iv, and He ii line profiles reveal two main components. In Figure 5, we fit these lines with two Gaussians. For the Ly line, the blue component has a best-fit FWHM of km s-1 and the red component has a best-fit FWHM of km s-1. The redshift offset between the two components is km s-1. For the He ii line, the blue component has a FWHM of km s-1, and the red component has a best-fit FWHM of km s-1. The offset between the two components is the same as that of Ly.
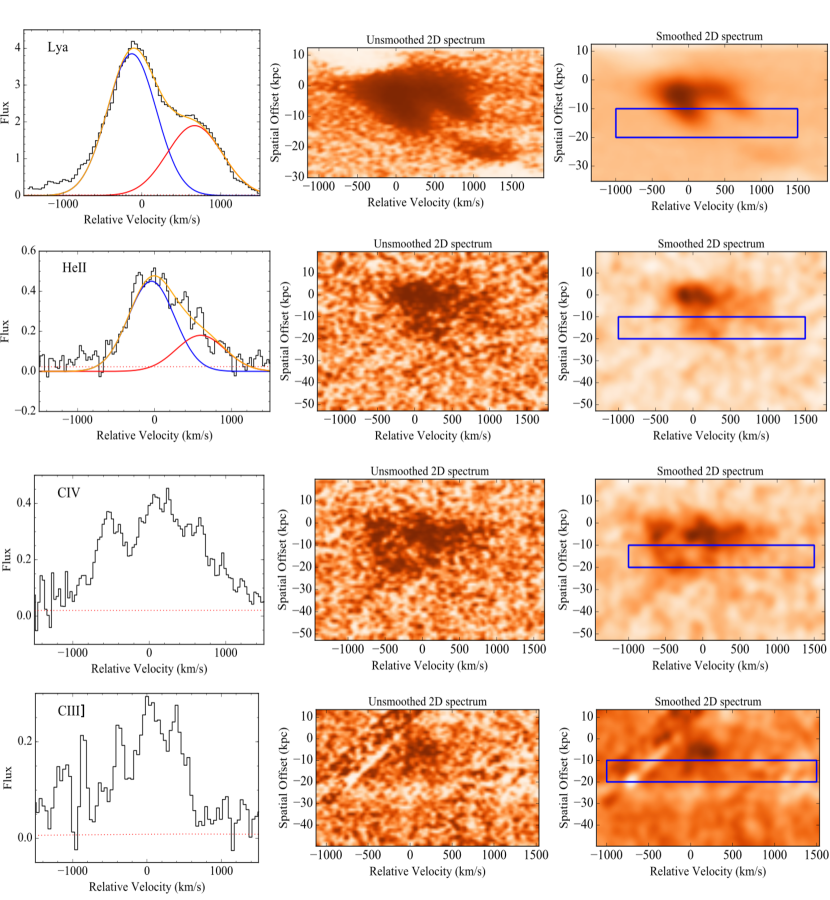
3.3. Flux and Surface Brightness
In our LBT/MODS spectra, the slit is 10′′ long and 2′′ wide. We measure the flux of Ly, He ii, C iv, and C iii]. The aperture we applied is 15 kpc (1.8) away from source B along the slit direction, and within 3000 km s-1 in the wavelength direction (see blue rectangle in Figure 5), sufficiently large to include all the diffuse emission in the wavelength direction. This gives a size of 2′′ (slit width) (along the slit direction). We apply this aperture to measure the surface brightness of the emission lines. We regard the flux as the CGM emission at 1.8′′ (15 kpc) away from the central source.
Applying this aperture to the LBT/MODS 2D spectrum (Figure 5), we determine that the Ly emission (first panel) has a flux of erg s-1 cm-2, corresponding to erg s-1. The surface brightness of Ly is SB erg s-1 cm-2 arcsec-2.
The extended He ii emission (second panel of Figure 5) has a line flux of erg s-1 cm-2, corresponding to a luminosity of erg s-1, and a surface brightness erg s-1 cm-2 arcsec-2.
The extended C iv emission (third panel of Figure 5) has a line flux of erg s-1 cm-2, corresponding to erg s-1 and erg s-1 cm-2 arcsec-2.
The C iii] emission (fourth panel of Figure 5) has a line flux of erg s-1 cm-2, corresponding to erg s-1 and erg s-1 cm-2 arcsec-2. We summarize our surface brightness measurements in Table 2.
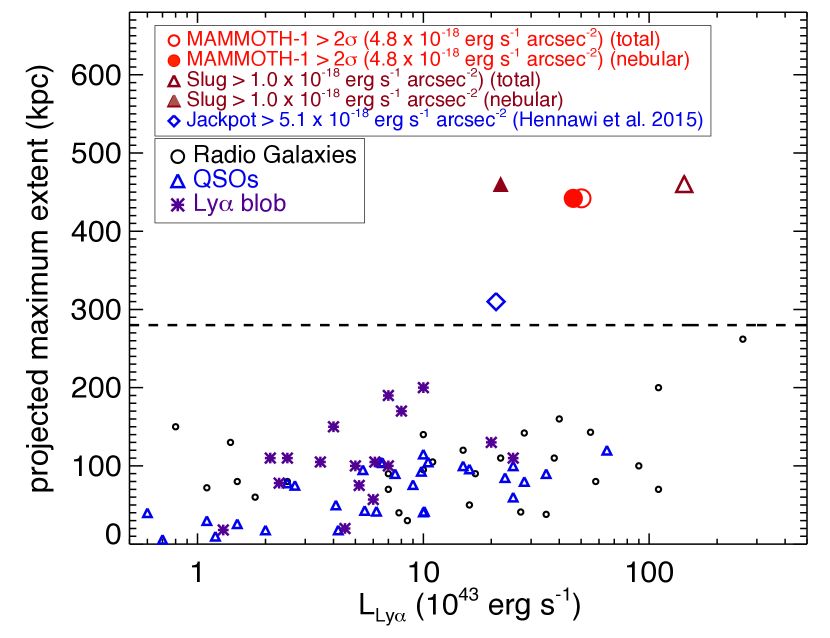
3.4. Comparison between MAMMOTH-1 and Other Ly Nebulae
In Figure 6, we present the sizes and Ly luminosities for different Ly nebulae from the literature in comparison with MAMMOTH-1. The Ly emission from the central source has also been included. The typical size measurements for these objects are above surface brightness contours of erg s-1 cm-2 arcsec-2, comparable to our measurements for MAMMOTH-1, which are above erg s-1 cm-2 arcsec-2. If we restrict the size measurements to the surface brightness coutour of erg s-1 cm-2 arcsec-2, MAMMOTH-1 has a similar size to the Slug nebula (Cantalupo et al. 2014). But note that Cantalupo et al. (2014) reached a factor of deeper than our current narrowband imaging, so MAMMOTH-1 nebula may be extended on an even larger scale in deeper data. In Table 3, we further compare the diffuse nebular luminosities (with excluding the PSF contribution). MAMMOTH-1 has the highest diffuse nebular luminosity among all the confirmed Ly nebulae and ELANe.
4. Discussion
In the previous section, we showed that the ELAN MAMMOTH-1 has a Ly spatial extent of kpc and a total luminosity of erg s-1. This nebula resides in an extremely overdense galaxy environment previously discovered at . Moreover, this radio-quiet nebula has the strongly extended He ii, C iv, and C iii]emission (Figure 4). The Ly, He ii, C iv line profiles are all double-peaked. In Table 3, we compare the properties of MAMMOTH-1 to other ELANe recently discovered. The Ly spatial extent and the strong emission of C iv and He ii make MAMMOTH-1 unique. In this section, we derive the physical properties of MAMMOTH-1, and we discuss several possible physical explanations for powering this ELAN.
4.1. Ionizing Radiation
A comparison between hydrogen ionizing photons and helium ionizing photons constrains the hardness of the ionizing radiation. The number of H+ ionizing photons can be expressed as:
| (1) |
where erg s-1 cm-2, corresponding to erg s-1. We have assumed that % of the ionizing photons are converted into Ly emission (Spitzer, 1978). This is a lower limit of Ly, because it may be destroyed by dust.
Using the same spatial region, we measured that the He ii emission has a flux of erg s-1 ( erg s-1). We calculated the He+-ionizing photon number ( eV) using the equation of:
| (2) |
where we assumed the case B recombination model, with a temperature of K. Under this assumption, cm3 s-1 (Prescott et al. 2009). Therefore Q(He+)/Q(H) is equal to 0.19. Note this is an upper limit for the Q(He+)/Q(H) ratio because Ly could be destroyed by dust. The Q(He+)/Q(H) ratio suggests that the powering source of MAMMOTH-1 produces a hard ionizing radiation spectrum. In comparison, if we assume a typical Pop II stellar population with a Salpeter IMF, and a low metallicity of , then Q(He+)/Q(H) equals 0.005 (Schaerer, 2003; Prescott et al., 2009), two orders of magnitude smaller than the value we estimated from MAMMOTH-1. This hard ionization ratio could arise because of significantly lower metallicity (e.g., Population III), a stellar population with a top-heavy IMF (Tumlinson et al., 2003; Schaerer, 2003; Cai et al., 2011), or an AGN. The detection of strong C iv and C iii] emission make this nebula unlikely to be powered by a low metallicity (e.g., Pop III) stars. Our current data support the conclusion that this ELAN is powered by one or more hard ionizing sources (e.g., AGN).
4.2. Sources of the enormous Ly, strong extended C iv, and He ii emission in a radio-quiet system
At least 15 Ly nebulae with Ly spatial extents larger than kpc have recently been discovered (e.g., Cantalupo et al., 2014; Hennawi et al., 2015; Borisova et al., 2016). But in none of these nebulae have strongly extended He ii and C iv been reported. We will discuss below several mechanisms that may power MAMMOTH-1.
4.2.1 Photoionization Model
In photoionization models, C iv emission is mainly powered by collisional excitation (e.g., Arrigoni Battaia et al., 2015). The intensity of collisional excitation has a strong dependence on the temperature (e.g., Gurzadyan, 1997). A higher ionization parameter () yields a higher gas temperature, and thus the C iv intensity strongly depends on the ionization parameter. Collisional excitation also depends on the gas density and column density of C iv. The He ii emission is mainly due to recombination. The fraction of He ii emission reaches a peak at , where a larger fraction of the helium has been doubly ionized (e.g., Arrigoni-Batta et al. 2015b). Higher ionization parameters only modestly change the He ii intensity. The C iii] emission increases with the ionization parameter, and it is also highly sensitive to the metallicity. The C iii] emission peaks at a gas metallicity of , and it decreases at both higher and lower metallicities (Erb et al. 2009). Therefore, the combination of He ii, C iv, and C iii] strongly constrains the physical properties of the CGM.
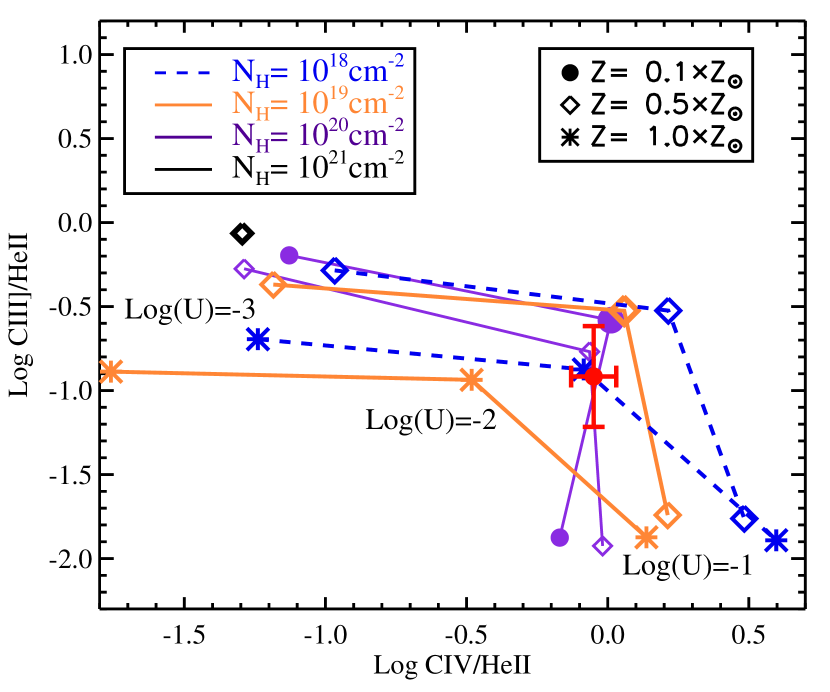
Using CLOUDY ionization modeling (Ferland, 1996), Arrigoni Battaia et al. (2015) have thoroughly investigated the He ii/ Ly and C iv/Ly ratios under different ionization parameters, gas densities (), and QSO ionizing luminosities () for the Slug nebula and nebulae in SSA22 protocluster. In §3, we suggest that MAMMOTH-1 could be powered mainly by source B. Source B may be a strongly obscured source, e.g., a type-II AGN. The Ly emission from a strongly obscured source may be complicated to interpret. In this section, we conduct a similar studies as Arrigoni Battaia et al. (2015), but focus on reproducing the He ii surface brightness and the C iv/He ii and C iii]/He ii line ratios. In our CLOUDY modeling, the AGN continuum follows the recipe in Mathews & Ferland (1987). We assume that the CGM clouds have a constant hydrogen density (). We assume that the emitting gaseous clouds are uniformly distributed throughout the halo, and we further assume a standard plane-parallel geometry for these clouds. To match our measurements in §3.3, we assume that the distance between the CGM cloud and the central QSO is kpc. In our CLOUDY models, we try combinations of different values, with cm-3 (steps of 0.5 dex); different ionization parameters, with Log (steps of 0.5 dex); different column densities of cm-2 (steps of 0.5 dex), and metallicities with (steps of ). We assume a gas covering fraction of (e.g., Cantalupo et al., 2014).
Our observed He ii surface brightness is erg s-1 cm-2 arcsec-2. We require that the parameter combinations yield a He ii surface brightness of erg s-1 cm-2 arcsec-2 to roughly match the observed He ii emission. In Figure 7, we present models that yield the observed He ii surface brightness, and present our observed value using a red dot with an error bar. Using the parameter combinations with (, , Log(U), )= (1020 cm-2, 0.5 , , 0.1 cm-3) and ( cm-2, 1.0 , , 2.0 cm-3) reproduce the observed intensities of He ii, C iv and C iii], and the line ratios of C iv/He ii and C iii]/He ii within 1 errors (red error bars in Figure 7). Therefore, the C iv/He ii and C iii]/He ii line ratios are consistent with AGN photoionization.
4.2.2 Resonant Scatter
In §3, we have shown that the Ly, C iv and He ii emission line profiles contain at least two major components. Double-peaked Ly emission is predicted by the resonant scattering of Ly photons (e.g. Dijkstra et al., 2006; Yang et al., 2014). The key prediction of these radiative transfer (RT) calculations is that the Ly spectrum is double peaked with an enhanced blue peak, producing a blueshift of the Ly profile. Although it is true that this prediction matches the Ly profile of MAMMOTH-1, the He ii emission has the same double-peaked structure as Ly. He ii is an optically-thin, non-resonant emission line whose photons escape the halo without radiative transfer effects (e.g., Yang et al., 2014). The non-resonant, optically thin emission lines should directly reflect the spatial distribution and kinematics of the gas. Thus, the emission-line structure of He ii strongly suggests that the double peaks are due to the actual kinematics (e.g., gas flows) rather than the radiative transfer effects.
4.2.3 Shocks due to a Gas Flow
The shocks due to flowing gas can also explain the double peaks of the emission lines. If the fast wind of an outflow is launched, then the shock could heat the surrounding interstellar gas over scales of kpc (Debuhr et al. 2012; Harrison et al. 2014). Current galaxy formation simulations and observations suggest that high-velocity ( km s-1) galactic outflow can quench star formation in the most massive galaxies and eject heavy elements into the IGM (e.g., Taniguchi & Shioya, 2000; Martin, 2005; Ho et al., 2014). Such galactic winds can be driven by (1) intense star formation or (2) relativistic winds or jets resulting from the gas accretion onto the supermassive black holes (e.g., Leitherer et al., 1999; Tombesi et al., 2015).
Wilman et al. (2005) find a Ly blob at in the SSA22 overdensity (Steidel et al., 2000; Matsuda et al., 2005) whose double-peaked line profile is consistent with a simple outflow model. This model suggests that the Ly emission is absorbed by a foreground shell of neutral gas that is pushed out up to a kpc by an AGN-driven outflow. Using MAPPINGS (Dopita & Sutherland, 1996) and CLOUDY (Ferland, 1996) modeling, Villar-Martín et al. (1999, 2007) and Moy & Rocca-Volmerange (2002) suggest both shocks and AGN photoionization could power the extended Ly, He ii, and C iv observed in radio galaxies. Using hydrodynamical simulations, Cabot et al. (2016) further argue that the Ly, He ii and C iv emission in Ly blobs could be primarily due to the shocks. Integral Field Spectrometer (IFS) observations suggest that the high-velocity ( km s-1) [OIII] outflows exist in a sample of 5 radio-quiet ULIRGs at . Such [OIII] outflows are consistent with the AGN-driven wind scenario (e.g., Alexander et al., 2010; Harrison et al., 2012).
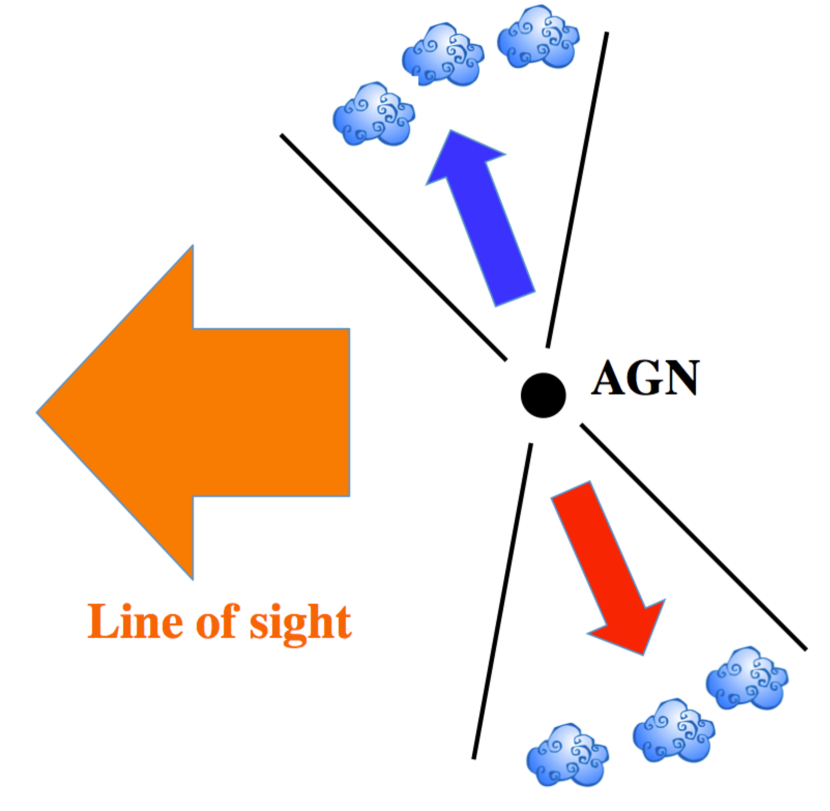
MAMMOTH-1 has C iii]/He ii and C iv/He ii line ratios consistent with both photionization and shock models (see Figure 2 and Figure 3 of Villar-Martín et al. (1999). Further, the C iv/Ly and He ii/Ly ratios of MAMMOTH-1 are consistent with the predictions using shock models (Arrigoni Battaia et al., 2015), with a gas denisty 1 cm-3 and a shock velocity of – 600 km s-1. If the extended He ii and C iv are powered by shocks due to an AGN-driven outflow, then the double velocity peaks of emission lines can be naturally interpreted. Like Harrison et al. (2014), we draw a schematic diagram to illustrate the outflow interpretation of the extended C iv and He ii (Figure 8). The velocity offsets between the two components and the spatial extent of emission lines strongly depend on the orientation of the outflow with respect to the line of sight: if the axis of the outflow is oriented along the line of sight, then a high-velocity offset and a small spatial extent should be observed; and conversely, if the axis of the outflow is in the plane of the sky, then a small velocity offset and a large spatial extent should be observed.
From §3.2, the offset between two velocity components is km s-1. These line structures are similar to ULIRG sample in Harrison et al. (2012). The AGN outflow is a natural explanation of the extended metal line emission. If we assume the extended C iv and He ii are due to the AGN outflow, then we can estimate the energy of the outflow.
To make an order of magnitude estimation of the outflow energy, we follow the model proposed by Heckman et al. (1990) (also see Nesvadba et al. 2008; Harrison et al. 2012). This model assumes a energy-conserving bubble inflated by AGN outflow expanding into a uniform circumgalacitc medium (CGM) with a constant density. Further, this model assumes that the outflow injects energy to CGM at a constant rate. Then, Heckman et al. (1990) derived the following equation to calculate the injected energy coupled to the CGM (Ekin):
| (3) |
where is the velocity offset between two components in units of 1000 km s-1. is the radius of the observed of C iv emission in units of 10 kpc. The ambient density is the gas density ahead of the expanding bubble, in the units of 0.5 cm-3. The total energy injected is , where is the coupling efficiency. The coupling efficiency represents the fraction of the outflow energy that is coupled to circumgalactic medium (CGM) gas. The value of could range from 0.05 – 0.8 (Nesvadba et al. 2008). For MAMMOTH-1, if we assume that the extended C iv and He ii are completely powered by an AGN outflow, and the axis of the outflow is oriented 45 degrees with respect to the sight line, then , . It is actually hard to find a direct way of estimating the electron density . We assume the electron density 1 – 4 which values were indirectly measured from Heckman et al. (1990) and was dopted by Heckman et al. (1990), Nesvadba et al. (2008) and Harrison et al. (2012) when they calculating the AGN feedback energy at . Taking these numbers into Equation (3), then we make an order of magnitude estimation that the outflow in MAMMOTH-1 injects energy into the CGM at a considerable rate of erg s-1. Over a typical AGN duty cycle of 30 Myr (e.g., Hopkins et al., 2005; Harrison et al., 2012), the total energy injected reaches the order of erg. According to Nesvadba et al. (2006), the typical binding energy of a massive elliptical galaxy with a halo mass of M⊙ is about erg. Thus, if MAMMOTH-1 is powered by an AGN outflow, then the outflow energy could be comparable or two orders of magnitude higher than this binding energy, making a vast AGN outflow possibly plays a major role in heating the ISM.
It has also long been suggested that jet-induced shocks can power extended metal-line emission, and extended C iv emission has been reported in a few radio-galaxies with strong radio continua (e.g., McCarthy, 1993; Villar-Martín et al., 2007). We argue that our current data disfavour the model of jet-ISM interaction. From the FIRST radio catalog (Becker et al. 1995), we do not find any source with a radio flux at 1.4 GHz Jy within a radius of 30 arcsec from MAMMOTH-1. Assuming a radio spectrum , this 3- upper limit corresponds to a luminosity density of erg s-1 Hz-1 at rest-frame 1.4 GHz (Yang et al., 2009). This limit is two orders of magnitude lower than the radio continua of other Ly nebulae powered by radio galaxies (e.g., Carilli et al., 1997; Reuland et al., 2003).
4.2.4 Gravitational Cooling Radiation
Theoretical studies have suggested that Ly nebula could result from the gravitational cooling radiation (e.g., Haiman & Rees, 2001; Dijkstra et al., 2006; Yang et al., 2006; Faucher-Giguère et al., 2010; Rosdahl & Blaizot, 2012). Several studies have predicted the He ii cooling radiation using hydrodynamical simulations. Yang et al. (2006) predict that the He ii line has the FWHM km s-1 even for the most massive halo at (). If our observed He ii line profile has two major velocity components as shown in Figure 5, then the He ii has a large FWHM of km s-1 for the blue component and km s-1 for the red component. The observed FWHMs are much wider than the predicted line width for cooling radiation. Also, using hydrodynamical simulations, Fardal et al. (2001) and Yang et al. (2006) point out that the He ii regions should be centrally-concentrated and the He ii cooling radiation may be too small to resolve using current ground-based telescopes. This size prediction of the He ii cooling radiation does not fit our observations. We have detected extended He ii emission over kpc scale. Further, if the Ly emission results from the cooling inflow of the pristine gas in the intergalactic filaments, then we should expect no extended C iv being detected (e.g., Yang et al., 2006; Arrigoni Battaia et al., 2015). Therefore, we conclude that our current observations do not fit with the cooling radiation picture.
5. Summary
In this paper, we present our discovery of an enormous Ly nebula (ELAN) MAMMOTH-1 at in the density peak of the large-scale structure BOSS1441 (Cai et al. 2016a). Above the 2 surface brightness contour, this object has the highest nebular luminosity discovered to date: erg s-1 (excluding the Ly PSF, see §3). Above the 2 surface brightness limit of SB erg s-1 cm-2 arcsec-2, we measure this nebula to have an end-to-end spatial extent of 442 kpc, comparable to the largest known Ly nebula (e.g., Cantalupo et al., 2014).
MAMMOTH-1 is associated with a relatively faint source in the broadband (source B, Figure 1). This source has an extended He ii and C iv emission in our LBT/MODS spectra (Figure 5). No radio sources are detected from the FIRST radio catalog (Becker et al. 1995) within 30′′ from the center of MAMMOTH-1 (§3). Both C iv and He ii have a spatial extent of kpc. The Ly, He ii and C iv emission all contain two major components, with velocity offsets of km s-1 (§4.2). The large spatial extent of the Ly, extended He ii and C iv emission, and double-peaked line profiles make MAMMOTH-1 to be unique compared to all the ELANe discovered up to date.
We discussed several explanations for MAMMOTH-1. We consider different scenarios including the photoionization (§4.2.1), resonant scattering (§4.2.2), shocks due to gas flows (§4.2.3), and cooling radiation (§4.2.4). We ruled out resonant scattering and cooling radiation as unlikely. Our current data support photoionization (Figure 8) or/and shocks due to the galactic outflow as the source of the extended Ly emission. The outflow model could naturally generate the double-peaked structures of the He ii and C iv emission. The future Integral Field Spectroscopy can examine if this ELAN is powered by a group of galaxies, and also can help us to better understand the nature of MAMMOTH-1.
| Centera | Aperture | ||
|---|---|---|---|
| (1043 erg s | (1043 erg s | ||
| = 14:41:24.475, +40:03:09.45 | Entire nebulab |
a: We apply source B’s position as the center of MAMMOTH-1 (see Figure 1 and Figure 2).
b:
We include all the continuous area with surface brightness (SB) erg s-1 cm-2 arcsec-2).
| Aperture | ||||
|---|---|---|---|---|
| (erg s-1 cm-2 arcsec-2) | (erg s-1 cm-2 arcsec-2) | (erg s-1 cm-2 arcsec-2) | (erg s-1 cm-2 arcsec-2) | |
| 2 (16.7 10 kpc2) |
| Name | sizea | Ionizing sources | ||||
|---|---|---|---|---|---|---|
| (1043 erg s | (1043 erg s | (kpc) | ||||
| MAMMOTH-1 | faint source | |||||
| (, , , ) | ||||||
| Slugb | 143.0 | ultraluminous QSO | (2) | (2) | ||
| Jackpotc | QSO quartet, ultraluminous QSO | |||||
| Q0042-2627d | 318 | ultraluminous QSO | ||||
| CTS G18.01 d | 239 | ultraluminous QSO |
Acknowledgements: ZC acknowlendges the valuable comments from Fabrizio Arrigoni Battaia, Joe Hennawi and Arjue Dey. ZC, XF, and IM thank the support from the US NSF grant AST 11-07682. ZC and JXP acknowledge support from NSF AST-1412981. AZ acknowledges support from NSF grant AST-0908280 and NASA grant ADP-NNX10AD47G. SC gratefully acknowledges support from Swiss National Science Foundation grant PP00P2_163824. NK acknowledges supports from the JSPS grant 15H03645. Based on observations at Kitt Peak National Observatory, National Optical Astronomy Observatory (NOAO Prop. ID: 2013A-0434; PI: Z. Cai; NOAO Prop. ID: 2014A-0395; PI: Z. Cai), which is operated by the Association of Universities for Research in Astronomy (AURA) under cooperative agreement with the National Science Foundation. The authors are honored to be permitted to conduct astronomical research on Iolkam Du’ag (Kitt Peak), a mountain with particular significance to the Tohono O’odham. The LBT is an international collaboration among institutions in the United States, Italy and Germany. The LBT Corporation partners are: The University of Arizona on behalf of the Arizona university system; Istituto Nazionale di Astrofisica, Italy; LBT Beteiligungsgesellschaft, Germany, representing the Max Planck Society, the Astrophysical Institute Potsdam, and Heidelberg University; The Ohio State University; The Research Corporation, on behalf of The University of Notre Dame, University of Minnesota and University of Virginia.
References
- Adelberger et al. (2005) Adelberger, K. L., Shapley, A. E., Steidel, C. C., et al. 2005, ApJ, 629, 636
- Allen et al. (2008) Allen, M. G., Groves, B. A., Dopita, M. A., Sutherland, R. S., & Kewley, L. J. 2008, ApJS, 178, 20-55
- Alexander et al. (2010) Alexander, D. M., Swinbank, A. M., Smail, I., McDermid, R., & Nesvadba, N. P. H. 2010, MNRAS, 402, 2211
- Arrigoni Battaia et al. (2015) Arrigoni Battaia, F., Yang, Y., Hennawi, J. F., et al. 2015, ApJ, 804, 26
- Arrigoni Battaia et al. (2015) Arrigoni Battaia, F., Hennawi, J. F., Prochaska, J. X., & Cantalupo, S. 2015, ApJ, 809, 163
- Byard & O’Brien (2000) Byard, P. L., & O’Brien, T. P. 2000, Proc. SPIE, 4008, 934
- Becker et al. (1995) Becker, R. H., White, R. L., & Helfand, D. J. 1995, ApJ, 450, 559
- Borisova et al. (2016) Borisova, E., Cantalupo, S., Lilly, S. J., et al. 2016, arXiv:1605.01422
- Bouwens et al. (2011) Bouwens, R. J., Illingworth, G. D., Oesch, P. A., et al. 2011, ApJ, 737, 90
- Bond et al. (1996) Bond, J. R., Kofman, L., & Pogosyan, D. 1996, Nature, 380, 603
- Cai et al. (2011) Cai, Z., Fan, X., Jiang, L., et al. 2011, ApJ, 736, L28
- Cai et al. (2014) Cai, Z., Fan, X., Noterdaeme, P., et al. 2014, ApJ, 793, 139
- Cai et al. (2015) Cai, Z., Fan, X., Jiang, L., et al. 2015, ApJ, 799, L19
- Cai et al. (2015) Cai, Z., Fan, X., Peirani, S., et al. 2015, arXiv:1512.06859
- Cai et al. (2016) Cai, Z., Fan, X., Bian, F., et al. 2016, arXiv:1609.02913
- Cabot et al. (2016) Cabot, S. H. C., Cen, R., & Zheng, Z. 2016, arXiv:1603.09696
- Cantalupo et al. (2005) Cantalupo, S., Porciani, C., Lilly, S. J., & Miniati, F. 2005, ApJ, 628, 61
- Cantalupo & Porciani (2011) Cantalupo, S., & Porciani, C. 2011, MNRAS, 411, 1678
- Cantalupo et al. (2014) Cantalupo, S., Arrigoni-Battaia, F., Prochaska, J. X., Hennawi, J. F., & Madau, P. 2014, Nature, 506, 63
- Carilli et al. (1997) Carilli, C. L., Röttgering, H. J. A., van Ojik, R., et al. 1997, ApJS, 109, 1
- Cen et al. (1994) Cen, R., Miralda-Escudé, J., Ostriker, J. P., & Rauch, M. 1994, ApJ, 437, L9
- Cen & Ostriker (2006) Cen, R., & Ostriker, J. P. 2006, ApJ, 650, 560
- Colberg et al. (2005) Colberg, J. M., Krughoff, K. S., & Connolly, A. J. 2005, MNRAS, 359, 272
- Dawson et al. (2013) Dawson, K. S., Schlegel, D. J., Ahn, C. P., et al. 2013, AJ, 145, 10
- Davis et al. (1985) Davis, M., Efstathiou, G., Frenk, C. S., & White, S. D. M. 1985, ApJ, 292, 371
- Dey et al. (2005) Dey, A., Bian, C., Soifer, B. T., et al. 2005, ApJ, 629, 654
- Debuhr et al. (2012) Debuhr, J., Quataert, E., & Ma, C.-P. 2012, MNRAS, 420, 222
- Dijkstra et al. (2006) Dijkstra, M., Haiman, Z., & Spaans, M. 2006, ApJ, 649, 14
- Dijkstra & Loeb (2009) Dijkstra, M., & Loeb, A. 2009, MNRAS, 400, 1109
- Dopita & Sutherland (1996) Dopita, M. A., & Sutherland, R. S. 1996, ApJS, 102, 161
- Eisenstein et al. (2011) Eisenstein, D. J., Weinberg, D. H., Agol, E., et al. 2011, AJ, 142, 72
- Erb et al. (2009) Erb, R. M., Son, H. S., Samanta, B., Rotello, V. M., & Yellen, B. B. 2009, Nature, 457, 999
- Faucher-Giguère et al. (2010) Faucher-Giguère, C.-A., Kereš, D., Dijkstra, M., Hernquist, L., & Zaldarriaga, M. 2010, ApJ, 725, 633
- Fardal et al. (2001) Fardal, M. A., Katz, N., Gardner, J. P., et al. 2001, ApJ, 562, 605
- Ferland (1996) Ferland, G. J. 1996, University of Kentucky Internal Report, 565 pages,
- Francis et al. (2001) Francis, P. J., Williger, G. M., Collins, N. R., et al. 2001, ApJ, 554, 1001
- Fukugita & Peebles (2004) Fukugita, M., & Peebles, P. J. E. 2004, ApJ, 616, 643
- Fumagalli et al. (2011) Fumagalli, M., Prochaska, J. X., Kasen, D., et al. 2011, MNRAS, 418, 1796
- Geach et al. (2009) Geach, J. E., Alexander, D. M., Lehmer, B. D., et al. 2009, ApJ, 700, 1
- Geach et al. (2014) Geach, J. E., Bower, R. G., Alexander, D. M., et al. 2014, ApJ, 793, 22
- Geach et al. (2016) Geach, J. E., Narayanan, D., Matsuda, Y., et al. 2016, ApJ, 832, 37
- Gould & Weinberg (1996) Gould, A., & Weinberg, D. H. 1996, ApJ, 468, 462
- Gurzadyan (1997) Gurzadyan, G. A. 1997, The Physics and Dynamics of Planetary Nebulae, XVI, 513 pp. 179 figs. 93 tabs.. Springer-Verlag Berlin Heidelberg New York. Also Astronomy and Astrophysics Library, 179
- Kollmeier et al. (2010) Kollmeier, J. A., Zheng, Z., Davé, R., et al. 2010, ApJ, 708, 1048
- Heckman et al. (2000) Heckman, T. M., Lehnert, M. D., Strickland, D. K., & Armus, L. 2000, ApJS, 129, 493
- Haiman & Rees (2001) Haiman, Z., & Rees, M. J. 2001, ApJ, 556, 87
- Harrison et al. (2012) Harrison, C. M., Alexander, D. M., Swinbank, A. M., et al. 2012, MNRAS, 426, 1073
- Harrison et al. (2014) Harrison, C. M., Alexander, D. M., Mullaney, J. R., & Swinbank, A. M. 2014, MNRAS, 441, 3306
- Hayes et al. (2011) Hayes, M., Scarlata, C., & Siana, B. 2011, Nature, 476, 304
- Hernquist et al. (1996) Hernquist, L., Katz, N., Weinberg, D. H., & Miralda-Escudé, J. 1996, ApJ, 457, L51
- Heckman et al. (1991) Heckman, T. M., Miley, G. K., Lehnert, M. D., & van Breugel, W. 1991, ApJ, 370, 78
- Hopkins et al. (2005) Hopkins, P. F., Hernquist, L., Cox, T. J., et al. 2005, ApJ, 630, 716
- Heckman et al. (1990) Heckman, T. M., Armus, L., & Miley, G. K. 1990, ApJS, 74, 833
- Hennawi et al. (2006) Hennawi, J. F., Prochaska, J. X., Burles, S., et al. 2006, ApJ, 651, 61
- Hennawi & Prochaska (2013) Hennawi, J. F., & Prochaska, J. X. 2013, ApJ, 766, 58
- Hennawi et al. (2015) Hennawi, J. F., Prochaska, J. X., Cantalupo, S., & Arrigoni-Battaia, F. 2015, Science, 348, 779
- Ho et al. (2014) Ho, I.-T., Kewley, L. J., Dopita, M. A., et al. 2014, MNRAS, 444, 3894
- Kereš et al. (2005) Kereš, D., Katz, N., Weinberg, D. H., & Davé, R. 2005, MNRAS, 363, 2
- Leitherer et al. (1999) Leitherer, C., Schaerer, D., Goldader, J. D., et al. 1999, ApJS, 123, 3
- Lee et al. (2014) Lee, K.-G., Hennawi, J. F., White, M., Croft, R. A. C., & Ozbek, M. 2014, ApJ, 788, 49
- Martin (2005) Martin, C. L. 2005, ApJ, 621, 227
- Mathews & Ferland (1987) Mathews, W. G., & Ferland, G. J. 1987, ApJ, 323, 456
- Martin et al. (2012) Martin, C. L., Shapley, A. E., Coil, A. L., et al. 2012, ApJ, 760, 127
- Martin et al. (2014) Martin, D. C., Chang, D., Matuszewski, M., et al. 2014, ApJ, 786, 107
- Martin et al. (2015) Martin, D. C., Matuszewski, M., Morrissey, P., et al. 2015, Nature, 524, 192
- Matsuda et al. (2005) Matsuda, Y., Yamada, T., Hayashino, T., et al. 2005, ApJ, 634, L125
- McCarthy (1993) McCarthy, P. J. 1993, ARA&A, 31, 639
- Miralda-Escudé et al. (1996) Miralda-Escudé, J., Cen, R., Ostriker, J. P., & Rauch, M. 1996, ApJ, 471, 582
- Miley & De Breuck (2008) Miley, G., & De Breuck, C. 2008, A&A Rev., 15, 67
- Moy & Rocca-Volmerange (2002) Moy, E., & Rocca-Volmerange, B. 2002, A&A, 383, 46
- Nesvadba et al. (2006) Nesvadba, N. P. H., Lehnert, M. D., Eisenhauer, F., et al. 2006, ApJ, 650, 693
- Nesvadba et al. (2008) Nesvadba, N. P. H., Lehnert, M. D., De Breuck, C., Gilbert, A. M., & van Breugel, W. 2008, A&A, 491, 407
- Prescott et al. (2009) Prescott, M. K. M., Dey, A., & Jannuzi, B. T. 2009, ApJ, 702, 554
- Palunas et al. (2004) Palunas, P., Teplitz, H. I., Francis, P. J., Williger, G. M., & Woodgate, B. E. 2004, ApJ, 602, 545
- Prochaska et al. (2011) Prochaska, J. X., Weiner, B., Chen, H.-W., Mulchaey, J., & Cooksey, K. 2011, ApJ, 740, 91
- Prochaska et al. (2014) Prochaska, J. X., Lau, M. W., & Hennawi, J. F. 2014, ApJ, 796, 140
- Rauch (1998) Rauch, M. 1998, ARA&A, 36, 267
- Reuland et al. (2003) Reuland, M., van Breugel, W., Röttgering, H., et al. 2003, ApJ, 592, 755
- Rosdahl & Blaizot (2012) Rosdahl, J., & Blaizot, J. 2012, MNRAS, 423, 344
- Schaerer (2003) Schaerer, D. 2003, A&A, 397, 527
- Spitzer (1978) Spitzer, L. 1978, Physical processes in the interstellar medium, by Lyman Spitzer. New York Wiley-Interscience, 1978. 333 p.,
- Steidel et al. (1998) Steidel, C. C., Adelberger, K. L., Dickinson, M., et al. 1998, ApJ, 492, 428
- Steidel et al. (2000) Steidel, C. C., Adelberger, K. L., Shapley, A. E., et al. 2000, ApJ, 532, 170
- Steidel et al. (2005) Steidel, C. C., Adelberger, K. L., Shapley, A. E., et al. 2005, ApJ, 626, 44
- Taniguchi & Shioya (2000) Taniguchi, Y., & Shioya, Y. 2000, ApJ, 532, L13
- Tombesi et al. (2015) Tombesi, F., Meléndez, M., Veilleux, S., et al. 2015, Nature, 519, 436
- Tumlinson et al. (2003) Tumlinson, J., Shull, J. M., & Venkatesan, A. 2003, ApJ, 584, 608
- Tumlinson et al. (2011) Tumlinson, J., Thom, C., Werk, J. K., et al. 2011, Science, 334, 948
- van Dokkum (2001) van Dokkum, P. G. 2001, PASP, 113, 1420
- Villar-Martin et al. (1997) Villar-Martin, M., Tadhunter, C., & Clark, N. 1997, A&A, 323, 21
- Villar-Martín et al. (1999) Villar-Martín, M., Tadhunter, C., Morganti, R., Axon, D., & Koekemoer, A. 1999, MNRAS, 307, 24
- Wilman et al. (2005) Wilman, R. J., Gerssen, J., Bower, R. G., et al. 2005, Nature, 436, 227
- Villar-Martín et al. (1999) Villar-Martín, M., Binette, L., & Fosbury, R. A. E. 1999, A&A, 346, 7
- Villar-Martín et al. (2007) Villar-Martín, M., Sánchez, S. F., Humphrey, A., et al. 2007, MNRAS, 378, 416
- Yang et al. (2006) Yang, Y., Zabludoff, A. I., Davé, R., et al. 2006, ApJ, 640, 539
- Yang et al. (2009) Yang, Y., Zabludoff, A., Tremonti, C., Eisenstein, D., & Davé, R. 2009, ApJ, 693, 1579
- Yang et al. (2010) Yang, Y., Zabludoff, A., Eisenstein, D., & Davé, R. 2010, ApJ, 719, 1654
- Yang et al. (2014) Yang, Y., Zabludoff, A., Jahnke, K., & Davé, R. 2014, ApJ, 793, 114