Detection of HI in Emission in the Lyman Alpha Emitting Galaxy Haro 11
Abstract
We present the first robust detection of H I 21 cm emission in the blue compact galaxy Haro 11 using the 100m Robert C. Byrd Green Bank Telescope (GBT). Haro 11 is a luminous blue compact galaxy with emission in both Lyman Alpha and the Lyman continuum. We detect (5.1 0.7 108) M⊙ of H I gas at an assumed distance of 88 Mpc, making this galaxy H I deficient compared to other local galaxies with similar optical properties. Given this small H I mass, Haro 11 has an elevated MH2/MHI ratio and a very low gas fraction compared to most local galaxies, and contains twice as much mass in ionized hydrogen as in neutral hydrogen. The H I emission has a linewidth of 71 km s-1 and is offset 60 km s-1 redward of the optical line center. It is undergoing a starburst after a recent merger which has elevated the star formation rate, and will deplete the gas supply in 0.2 Gyr. Although this starburst has elevated the SFR compared to galaxies with similar H I masses and linewidths, Haro 11 matches a trend of lower gas fractions toward higher star formation rates and is below the general trend of increasing H I mass with increasing luminosity. Taken together, our results paint Haro 11 as a standard low-mass galaxy that is undergoing an unusually efficient star formation episode.
Subject headings:
galaxies: ISM — galaxies: starburst — galaxies: kinematics and dynamics — radio lines: galaxies1. Introduction
Haro 11 is a luminous blue compact galaxy (LBCG), a class of very bright and blue galaxies with intense star formation. Rare in the local universe (Werk et al. 2004), these LBCGs are typically gas rich (Garland et al. 2004) and likely form from merger events (Östlin et al. 2001; Bekki 2008). Haro 11 is a powerful emitter across the electromagnetic spectrum. It is classified as a Luminous InfraRed Galaxy (LIRG) with an infrared luminosity of 1011L⊙, and shows signs of strong star formation likely due to a recent merger (Bergvall et al. 2000; Östlin et al. 1999, 2015). Haro 11 also shows emission in from some of its star forming regions (Hayes et al. 2007) and is one of a few currently known Lyman continuum emitting galaxies in the local universe (Bergvall et al. 2006; Leitet et al. 2013).
The detection of in emission in Haro 11 is particularly interesting. is an energetic star formation tracer that, in theory, can probe the stellar processing in the early epochs of the universe. In practice, this line suffers from strong resonance scattering, uncertain extinction properties, and the fact that it is unobservable from the ground due to atmospheric absorption.
The scattering and extinction process is further complicated by a number of confounding factors. Dust content and properties alone cannot explain the observed extinction of (e.g. Giavalisco et al. 1996; Atek et al. 2009); instead, trends are apparent between the neutral gas content and geometry (Cannon et al. 2004; Kunth et al. 1998a). Super bubbles formed after star formation episodes can clear a path for escaping photons by shifting H I atoms into a different rest frame (Kunth et al. 1998b; Tenorio-Tagle et al. 1999). photons can also scatter while avoiding dust grains and spread into large halos (Hayes et al. 2013; Hayes 2015).
Many of these hypotheses are now being tested by targeted observations using the Hubble Space Telescope (HST; Wofford et al. 2013; Östlin et al. 2014). In particular, the Lyman Alpha Reference Sample (LARS; Östlin et al. 2014; Hayes et al. 2014; Pardy et al. 2014; Guaita et al. 2015; Rivera-Thorsen et al. 2015) targeted 14 low-z potential emitters based on their ultraviolet luminosities and H equivalent widths. Initial observations of the LARS galaxies with the HST were followed up with multi-wavelength observations of the gas and dust content, including neutral hydrogen in absorption (Rivera-Thorsen et al. 2015) and emission (Pardy et al. 2014). Combining observations of and H I emissions allow for direct comparisons and testing of the scattering effects at work. When combined with a dust tracer like H/H, this technique can also probe the extinction effects at work (Hayes et al. 2014).
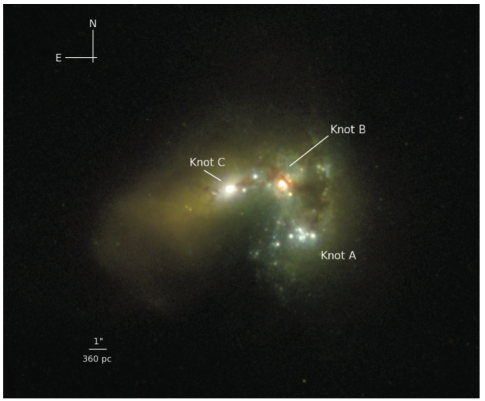
Given its proximity and star formation intensity, Haro 11 is a prime candidate for studies of radiative transfer. The galaxy has three primary star forming knots A, B, and C (see Figure 1; Vader et al. 1993; Kunth et al. 2003; Adamo et al. 2010). One of these knots, knot C, shows emission, while the other two show absorption. This is striking because knots C and B have very similar dust content and extinction values (Atek et al. 2008). Further complicating matters, knot B has a stronger outflow of interstellar gas, yet no sign of emission (Sandberg et al. 2013).
Haro 11’s ISM properties have been extensively studied. Cormier et al. (2014) studied the molecular gas content of Haro 11 using both CO gas and IR dust emission. That work found a total H2 mass of between 2.5108 and 3.6109 depending on the tracer used. James et al. (2013) used a variety of metallicity tracers to find a range of metallicities across the star forming knots from 12 + log(O/H) = 8.25 0.15 and Z/Z⊙ = 0.35 in Knot B, down to 8.09 0.23 (Z/Z⊙ = 0.24) in Knot A, and 7.80 0.13 (Z/Z⊙ = 0.12) in Knot C.
Yet, to date there has been no direct detection of 21 cm emission for Haro 11. Bergvall et al. (2000) first placed an upper limit on H I emission of 108 M⊙. H I was then seen in absorption by MacHattie et al. (2014), giving a mass range of (3-10) M⊙, with an upper limit on the emission of MM⊙. This absorption measurement assumed a spin temperature between 91 and 200 K in the optically thin regime. In this paper we present the first robust detection of the H I spectral line in emission. In Section 2 we discuss the observations and data reduction. In Section 3 and Section 4 we present the results and interpret them in the context of LARS and other emitters.
Throughout this paper we assume a value of H0 = 70.2 1.4 km s-1 Mpc-1 (Komatsu et al. 2011).
2. Observations
We observed Haro 11 with the National Radio Astronomy Observatory 100m Robert C. Byrd Green Bank Telescope (GBT111The National Radio Astronomy Observatory is a facility of the National Science Foundation operated under cooperative agreement by Associated Universities, Inc.) in four 2.5 hour sessions under project 14B-306 (P.I. Pardy) with the VEGAS (Versatile GBT Astronomical Spectrometer) backend. The native resolution of the spectrum was 0.1 km s-1. We obtained both XX and YY polarizations, which we averaged together for the final data.
All reductions were performed in the IDL environment222Exelis Visual Information Solutions, Boulder, Colorado, using the GBTIDL package designed at NRAO following the reduction strategy of Pardy et al. (2014). As in that work, we increase the Signal to Noise Ratio (SNR) by first averaging the reference spectrum by 16 channels. Then, adopting the baseline procedure of Leroy et al. (2008), we blanked all channels except for those within 400 km s-1 of either side of the emission peak. We then fit the unblanked channels with a first order baseline model and subtracted this model from all channels. Finally, we smoothed the spectrum to a resolution of 7.2km s-1.
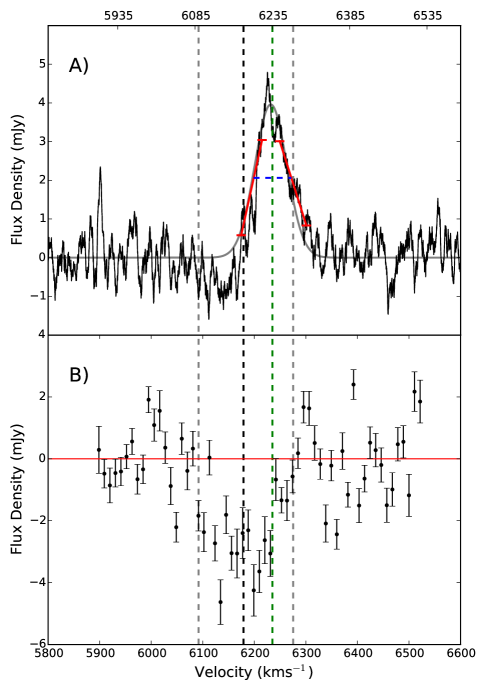
We show the single dish H I spectrum in the top panel of Figure 2 centered near the systematic velocity. This Figure also illustrates our fitting and measurement routines. We fit a single gaussian component both to guide the reader’s eye, and to define the area over which to integrate the galaxy spectrum (gray line in Figure 2). Next we fit linear components to the sides of the emission (red lines) and take the width between these at 50% of the maximum value as the linewidth (blue line). The halfway point of this line is the galaxy centeroid (green line). This procedure was originally adopted from Springob et al. (2005) and discussed in more detail in Pardy et al. (2014). Pardy et al. (2014) also details our procedure for calculating measurement uncertainties. In brief, we use a conservative 10% uncertainty for baseline and calibration results, to which we add an uncertainty based on the width and noise of the spectrum:
| (1) |
where ‘’ is the root mean squared noise of line-free channels, is the width at 50% of the peak, and is the velocity resolution.
We use the single dish H I spectrum to measure the total H I flux, and convert this to a mass using:
| (2) |
Where D is the distance and S is the flux density. In this work we take the previous optical line center of 6180 km s-1 (Bergvall et al. 2006) and derive a Hubble-flow distance of 88 Mpc using the cosmology from Komatsu et al. (2011). This conversion from flux to mass assumes that the emission is optically thin, but does not require any knowledge of the spin temperature as is required by absorption-based masses. Using the derived mass and the known stellar mass we can then measure the fraction of neutral gas in the galaxy.
To ensure that this result was not due to the presence of contamination within the GBT beam, we checked the NASA Extragalactic Database (NED) for known galaxies within 30 arcminutes of Haro 11. No companions were found.
3. Results
| Stellar Properties | ||
| Property | Value | Source |
| Vopt | 6180 km s-1 | (Bergvall et al. 2006) |
| Distance | 88 Mpc | (Bergvall et al. 2006)a |
| fescb | 0.037 | (Östlin et al. 2009) |
| EWc | 15.6 Å | (Östlin et al. 2009) |
| LumLyα. | 8.41041erg s-1 | (Östlin et al. 2009) |
| SFRd | 24 M⊙yr-1 | (Hayes et al. 2007) |
| M⋆ | 9.4 M⊙ | (Östlin et al. 2001) |
| MHII | 10 1 M⊙ | (Bergvall & Östlin 2002) |
| LB,⊙ | 1.81010L⊙ | (Bergvall & Östlin 2002)e |
| H I Properties (this work) | ||
| Property | Value | |
| Flux | 0.28 0.04 Jy km s-1 | |
| Vsysf | 6236 11 km s-1 | |
| MHI | 5.1 0.7M⊙ | |
| W50 | 77 21 km s-1 | |
| W20 | 125 33 km s-1 | |
| Wmaxg | 163 42 km s-1 | |
| fgas | 0.05 | |
-
a
Using H0 = 70 km s-1 Mpc-1.
-
b
Escape fraction of .
-
c
Equivalent width of .
-
d
H derived star formation rate.
-
e
Using distance = 88 Mpc.
-
f
Heliocentric radial velocity.
-
g
Full width of spectral line at zero-point crossing.
We measured the total flux of Haro 11 as 0.28 0.04 Jy km s-1 at a velocity center of 6237 11 km s-1 (using a heliocentric frame of rest). The un-smoothed spectrum has an rms noise of 310-3 Jy and a peak signal to noise ratio of 8. This line center corresponds to cosmological redshift distance of 89 2 Mpc. This central velocity is formally inconsistent both with the observed line center of 6179 16 km s-1 found by MacHattie et al. (2014) and with the H line center of 6146 km s-1 from James et al. (2013).
To test the validity of this detection, we split the dataset into the two separate polarizations and performed the analysis on each piece independently. We recover similar measurements from the two polarizations, all within our adopted uncertainties.
We compare the emission and absorption components in Figure 2. The absorption feature was unresolved in the observations of MacHattie et al. (2014), and comes from a region of size 3.54 kpc near the center of Haro 11.
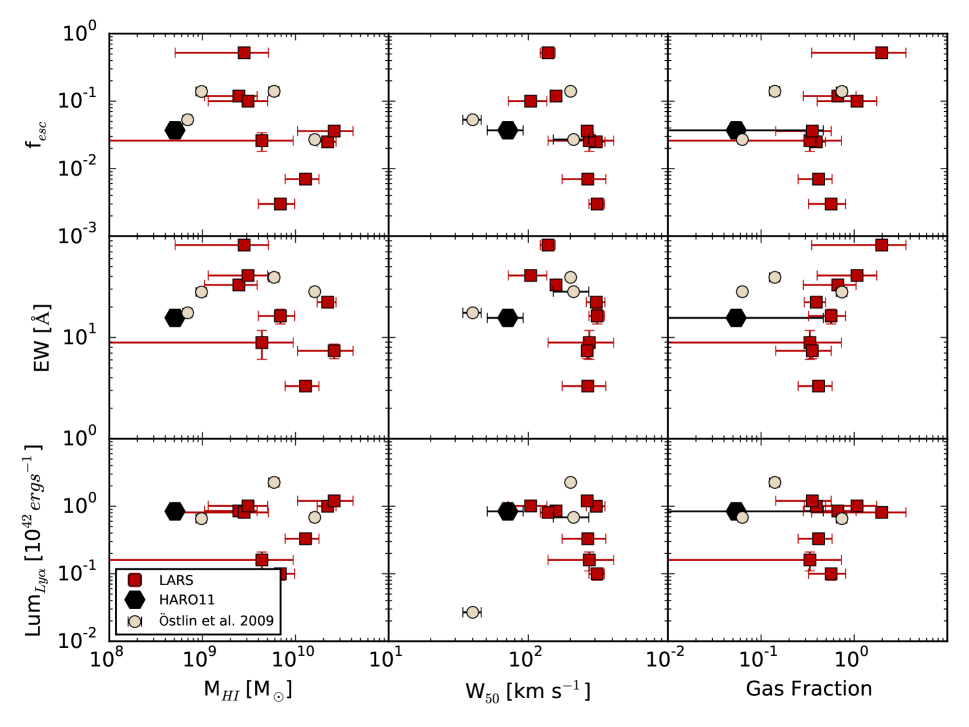
Using the total flux and a distance of 88 Mpc, we found a total of 5.1 0.7 108 M⊙ of H I gas in Haro 11, which makes it an order of magnitude deficient compared to LARS galaxies with similar properties (see the left column of Figure 3), but in line with other starburst galaxies from Östlin et al. (2009). This H I mass is less than half the upper limit provided by MacHattie et al. (2014) and is 5 times the order-of-magnitude limit provided by Bergvall et al. (2006). Due to the low H I mass, Haro 11 has a gas fraction (MHI/M⋆) of 0.05 0.4, the lowest of any of the local comparison galaxies for which H I was detected (see right column of Figure 3 and Section 4.1 for details).
We measure the velocity width at 50% of the peak emission as 77 21 km s-1 and the velocity width at 20% of the peak emission as 125 32 km s-1. Haro 11 has smaller linewidth than any LARS galaxies, as seen in the middle column of Figure 3. Our linewidth is narrower than the absorption derived H I linewidth of 112 16 km s-1 (MacHattie et al. 2014). The total velocity extent is 163 42 km s-1, formally consistent with those of MacHattie et al. (2014) and Östlin et al. (1999) (192 and 190 km s-1 respectively), and smaller than the H derived value of 283 km s-1 from James et al. (2013).
Although Haro 11 appears to have less H I and a smaller linewidth when compared to galaxies in LARS with similar UV properties, none of these relationships, with the exception of the relationship between fesc and linewidth, are significant. We quantify this by measuring Spearman’s coefficient (Spearman 1904), finding fesc and linewidth with a correlation coefficient of -0.76 (p-value of 0.005). We next measured the strength of the correlation before and after including Haro 11 and looked for instances where the two properties became less correlated after the inclusion of Haro 11. In all cases, except for the relationship between gas fraction and EW333Although still not significant after the inclusion. Before including Haro 11: = 0.40 (p-value = 0.22). After: = 0.45 (p-value = 0.15)., the two variables became less correlated after including Haro 11.
4. Discussion
4.1. Properties
We compare our observed H I mass, linewidth, and gas fraction for Haro 11 to the other starbursts from Östlin et al. (2009) and with galaxies from LARS (Hayes et al. 2014). Literature data for the H I properties of the Östlin et al. (2009) sample was compiled from a variety of sources and is presented in Table 2. We show all results in Figure 3. The rows show different properties
- •
- •
- •
Haro 11 does not follow the correlations seen in Pardy et al. (2014) for H I mass with fesc (top left panel in Figure 3) and with EW (middle left panel in Figure 3), but one other starburst galaxy (Tol 65) is also nearly as offset as Haro 11 from the general trends. Haro 11 appears to also have a smaller linewidth (W50) than LARS galaxies with similar fesc and EW values, but this difference appears less pronounced than the offset with respect to H I mass. As discussed in Section 5, interactions are thought to facilitate the escape of photons, and often produce asymmetric line profiles and increased luminosities compared with isolated systems (Zaritsky & Rix 1997). Given that most of the LARS galaxies also showed signs of interactions, this may partly explain why the correlations between UV properties and H I linewidth were generally weaker than those with H I mass, and why Haro 11 falls within the linewidth scatter even with a dearth of H I.
In addition, the gas fraction seen in Haro 11 is nearly an order of magnitude smaller than any LARS galaxies as predicted by each of these three properties. The galaxies in Östlin et al. (2009) are generally smaller, with lower H I masses than the LARS sample (5.9M⊙ for (Östlin et al. 2009) and 1.6M⊙ for LARS) . Because of this, these emitters appear as extreme as Haro 11 in these relationships. In particular, two of the galaxies IRAS 08339+6517 and NGC 6090 have lower gas fractions than the LARS galaxies (although they have masses and line-widths consistent with the larger sample; see the right column of Figure 3). Given the uncertain nature of the dependence on H I properties for the propagation of photons, a larger systematic study of H I properties in emitters is warranted. One such project is currently underway with the expanded Lyman Alpha Reference Sample (eLARS), which will increase the LARS sample by 28 galaxies (Melinder et al. in prep).
4.2. Relation to other Galaxies
Haro 11 has a stellar mass about one third that of the MW (Östlin et al. 2001; Licquia & Newman 2015), but a total mass near the upper limits of the LMC (Östlin et al. 2015; Peñarrubia et al. 2015) and an H I mass that is reminiscent of dwarfs. Because of this range of properties, we compare Haro 11 to a wide range of galaxy samples including regular star forming galaxies, dwarf galaxies, and galaxies selected for their similar blue colors or low metallicities as Haro 11.
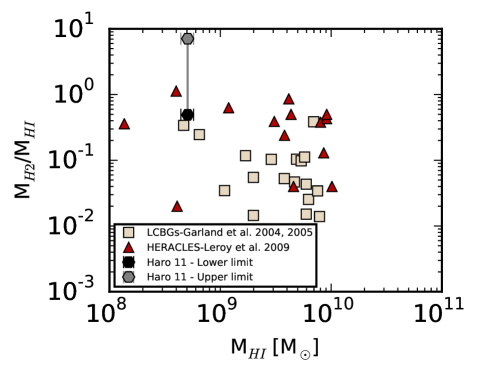
Cormier et al. (2014) measured the H2 mass of Haro 11 using both CO and dust tracers. Haro 11 appears to have a small CO flux, and using Galaxy scaled XCO conversions gives M = 2.5108 M⊙, whereas dust measurements give an estimate of M = 3.6109 M⊙. Using these dust masses, a metallicity scaled Xco provides a higher mass of M = 2.5109 M⊙. Cormier et al. (2014) finds similar discrepancies between the CO and dust-derived H2 masses for other galaxies in the Herschel Dwarf Galaxy Survey. All of the galaxies in their sample have faint CO lines and XCO factors much larger than the Galactic value and therefore have uncertain H2 masses. We can use this H2 mass to derive an H I to H2 mass ratio. Because there is such a large discrepancy between different methods, we choose to use the full range of H2 masses reported by Cormier et al. (2014) in the analysis. This gives a range of M/MHI = 0.43 - 6.2 depending on the mass of H2 used.
If Haro 11 is indeed the product of a recent merger (Östlin et al. 2015), then comparisons with non-interacting galaxies may be biased. If we take these results at face value, however, we find that at the lower limit, Haro 11 has the fifth highest molecular gas fraction in this sample. At the higher limit it has a factor of seven higher ratio than any galaxies from the Heterodyne Receiver Array CO Line Extragalactic Survey (HERACLES; Leroy et al. 2009). See Figure 4. This large M/MHI ratio is perhaps because infrared luminous galaxies are often seen with low atomic gas fractions (Mirabel & Sanders 1989).
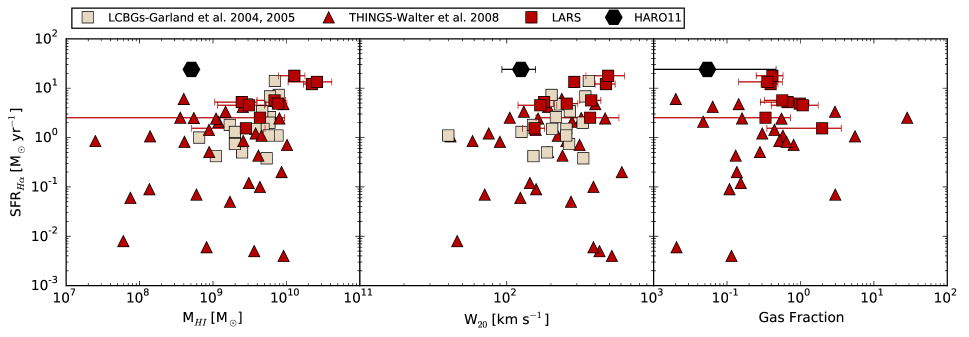
In Figure 5 we compare the star formation and H I properties of Haro 11 to Luminous Compact Blue Galaxies (LCBGs) from Garland et al. (2004, 2005), to The H I in Nearby Galaxies Survey (THINGS) galaxies (Walter et al. 2008), and to LARS galaxies. The star formation rate for Haro 11 is measured from H emission from Hayes et al. (2007). Haro 11 appears to be missing gas, both in terms of its low H I mass compared to other galaxies with similar SFR (left panel in Figure 5) and in terms of its narrow linewidth (middle panel). The gas fraction, however, paints a different picture. Haro 11 matches a trend of lower gas fractions toward higher star formation rates found in both the THINGS galaxies and the LBCGs (right panel of Figure 5). Taken together, these point to Haro 11 not as missing atomic gas, but as a standard low-mass galaxy that is undergoing an unusually efficient star formation episode. With an instantaneous H SFR of 24 M⊙yr-1 (Hayes et al. 2007), and the range of gas masses provided above (including a correction for primordial He), the gas will be depleted in 0.04-0.2 Gyrs.
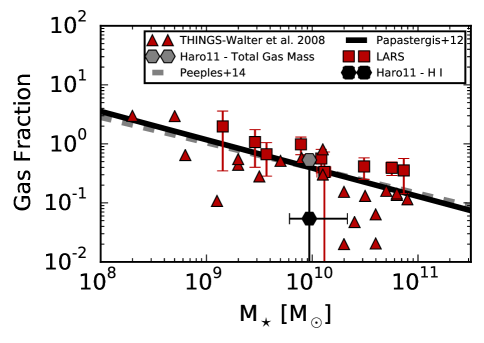
Data from ALFALFA (Giovanelli et al. 2005), and HERACLES (Leroy et al. 2008), among others, have been used to demonstrate relationships between H I gas fraction and stellar mass (Papastergis et al. 2012; log ) and between H I + H2 gas fraction and stellar mass (Peeples et al. 2014; log ) for normal star-forming disk galaxies. The general trend is that galaxies with smaller total stellar mass have a higher gas fraction. The H I mass in Haro 11 does not follow this prediction and, as seen in Figure 6, lies more than an order of magnitude below the trend. Haro 11 is interesting in this respect for two reasons. First, the H II mass is roughly twice the H I mass. Second, Haro 11 has a large H2/H I fraction. After assuming an upper limit of H2 mass of 3.6109M⊙, and 10108M⊙ of ionized hydrogen, we can place Haro 11 on the H I + H2 - stellar mass relationship found in Peeples et al. (2014).
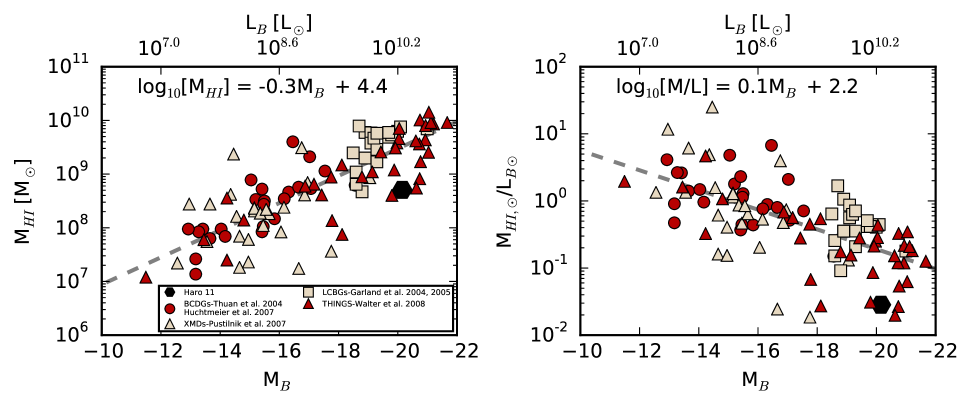
Smoker et al. (2000) finds a trend in MHI/LB, with higher luminosity galaxies having lower gas ratios. We observe this trend in samples of BCDGs from Thuan et al. (2004) and Huchtmeier et al. (2007), a sample of LCBGs from Garland et al. (2004, 2005), a sample of extreme metal deficient dwarfs (XMDs; Pustilnik & Martin 2007), and with galaxies from THINGS (Walter et al. 2008). All galaxies from these papers have been corrected for our assumed cosmology wherever possible. Figure 7 shows how these galaxies match with the observed luminosity and H I mass of Haro 11. The right panel of Figure 7 shows the classic relationship of MHI/LB with MB found in other papers, while the left panel shows a similar correlation of MHI with respect to MB. In both panels we include the transformation to luminosity in the top axis, assuming a solar B band magnitude of 5.48. The two relationships are highly correlated. The left and right panels have a Spearman’s correlation coefficient of -0.79 and 0.7 respectively and can be well described by simple power law fits (log10MHI=-0.3MB + 4.4 and log10M/L=-0.1MB + 2.2). Haro 11 is a 2 sigma outlier from the general trends (each relationship shows scatter of 0.46 dex), but is not the most extreme outlier.
4.3. Kinematics
The ISM kinematics of Haro 11 are highly irregular. The SiII line, seen in absorption by Kunth et al. (1998b), is blue shifted by 58 km s-1 from the optical line center. Sandberg et al. (2013) sees large velocity offsets between the ionized (H) and neutral gas (using a weak Na doublet line) that vary across the star forming knots. In Knot B, the neutral gas is blueshifted by 44 km s-1, while in Knot C the neutral gas is redshifted by 32 km s-1. Heckman et al. (2015) finds an outflow of 160 km s-1 using interstellar absorption lines in the warm ionized gas. Adding to this confusion, our H I emission line is redshifted nearly 60 km s-1 compared to the H I absorption (MacHattie et al. 2014) or H emission (James et al. 2013) emission.
It is possible that we are seeing evidence of outflows carving cavities for the propagation. Such a phenomenon is seen in other irregular galaxies such as NGC 2366, which features two prominent outflows (van Eymeren et al. 2009). Although H and H I kinematics are aligned across much of NGC 2366, the red-shifted H outflow is in a hole in the neutral gas and has no H I counterpart.
Alternatively, the H I line in Haro 11 might be shifted due to large scale effects such as tidal tails. Such a tidal arm was proposed by Östlin et al. (2001, 2015) to explain a redshifted H II component. Although the measured H I velocity width is 2.5 times narrower than the FWHM of the ionized gas, the ionized gas is multicomponent (Östlin et al. 2001). In particular Östlin et al. (2015) found a redshifted component with the same width (=30-25 km/s) as for the ionized hydrogen. They proposed that this component is a tidal arm. The H I that we see in emission could possibly be associated with this component, in which case it would not be associated with the main star formation site in the center (which is associated with the HI gas seen in absorption since the velocity matches and the width is consistent).
The total H I velocity extent is 160 km s-1, which suggests another possibility. The outflowing gas we see might be right on the edge of the H I distribution and the bulk of this H I material might be simply behind the H II regions.
5. Conclusions
Haro 11 is a local starburst galaxy undergoing a major merger of two dwarf galaxies (Östlin et al. 1999, 2015). It has long been known to be a local -emitter, but until now has only had upper limits placed on its cold gas content. Our main contribution is the first robust detection of H I gas in emission from this blue compact galaxy consistent with previous upper limits (Bergvall et al. 2000; MacHattie et al. 2014). We find a dearth of H I gas and a linewidth at 50% of maximum that is smaller relative to other local starburst and LARS galaxies (Östlin et al. 2014; Hayes et al. 2014; Pardy et al. 2014).
Given the small H I mass, Haro 11 has an elevated MH2/MHI ratio and a very low gas fraction compared to most local galaxies. Much of the hydrogen that remains has been heated during the merger process. Bergvall & Östlin (2002) derived a mass of 10 1 108M⊙ for the ionized hydrogen, twice as much as in neutral hydrogen. Haro 11 is undergoing an unusually efficient star formation episode, and matches a trend of lower gas fractions toward higher star formation rates and shares H I properties with galaxies of similar B-band magnitude.
Haro 11 is a known merging galaxy, which could explain the presence of tidal arms and complicated ISM kinematics. Two other merging local -emitters ESO 338IG 004 (Tol 1924416) and IRAS 08339+6517 were studied by Cannon et al. (2004) who found extended neutral gas connecting the main galaxy and companions. The processes that govern transport are complicated, but most often thought to involve the bulk motion of H I gas (Hayes 2015). Mapping the H I gas in emission across Haro 11 will be the only way to test these hypotheses, but this task remains a challenge for the current generation of radio telescopes. As we move to the high resolution H I era with the Square Kilometer Array (SKA), Haro 11 will be an excellent nearby target to probe the complicated coupling to cold neutral gas and propagation. Probing the three distinct star formation knots will reveal processes at work in enabling escape.
References
- Adamo et al. (2010) Adamo, A., Östlin, G., Zackrisson, E., et al. 2010, MNRAS, 407, 870
- Atek et al. (2008) Atek, H., Kunth, D., Hayes, M., et al. 2008, A&A, 488, 491
- Atek et al. (2009) Atek, H., Kunth, D., Schaerer, D., et al. 2009, A&A, 506, L1
- Bekki (2008) Bekki, K. 2008, MNRAS, 388, L10
- Bergvall et al. (2000) Bergvall, N., Masegosa, J., Östlin, G., et al. 2000, A&A, 359, 41
- Bergvall & Östlin (2002) Bergvall, N. and Östlin, G. 2002, A&A, 390, 891
- Bergvall et al. (2006) Bergvall, N., Zackrisson, E., Andersson, B. G., et al. 2006, A&A, 448, 513
- Cannon et al. (2004) Cannon, J. M., Skillman, E. D., Kunth, D., et al. 2004, ApJ, 608, 768
- Cormier et al. (2014) Cormier, D., Madden, S. C., Lebouteiller, V., et al. 2014, A&A, 564, 121
- Garland et al. (2004) Garland, C. A., Pisano, D. J., Williams, J. P., et al. 2004, ApJ, 615, 689
- Garland et al. (2005) Garland, C. A., Williams, J. P., Pisano, D. J., et al. 2005, ApJ, 624, 714
- Giavalisco et al. (1996) Giavalisco, M., Koratkar, A., and Calzetti, D. 1996, Astrophysical Journal v.466, 466, 831
- Giovanelli et al. (2005) Giovanelli, R., Haynes, M. P., Kent, B. R., et al. 2005, AJ, 130, 2598
- Guaita et al. (2015) Guaita, L., Melinder, J., Hayes, M., et al. 2015, A&A, 576, A51
- Hayes (2015) Hayes, M. 2015, Publ. Astron. Soc. Aust, 32, e027
- Hayes et al. (2007) Hayes, M., Östlin, G., Atek, H., et al. 2007, MNRAS, 382, 1465
- Hayes et al. (2014) Hayes, M., Östlin, G., Duval, F., et al. 2014, ApJ, 782, 6
- Hayes et al. (2005) Hayes, M., Östlin, G., Mas-Hesse, J. M., et al. 2005, A&A, 438, 71
- Hayes et al. (2013) Hayes, M., Östlin, G., Schaerer, D., et al. 2013, The Astrophysical Journal Letters, 765, L27
- Heckman et al. (2015) Heckman, T. M., Alexandroff, R. M., Borthakur, S., et al. 2015, ApJ, 809, 147
- Howell et al. (2010) Howell, J. H., Armus, L., Mazzarella, J. M., et al. 2010, ApJ, 715, 572
- Huchtmeier et al. (2007) Huchtmeier, W. K., Petrosian, A., Gopal-Krishna, et al. 2007, A&A, 462, 919
- James et al. (2013) James, B. L., Tsamis, Y. G., Walsh, J. R., et al. 2013, MNRAS, 430, 2097
- Komatsu et al. (2011) Komatsu, E., Smith, K. M., Dunkley, J., et al. 2011, The Astrophysical Journal Supplement, 192, 18
- Kunth et al. (2003) Kunth, D., Leitherer, C., Mas-Hesse, J. M., et al. 2003, ApJ, 597, 263
- Kunth et al. (1998a) Kunth, D., Mas-Hesse, J. M., Terlevich, E., et al. 1998a, A&A, 334, 11
- Kunth et al. (1998b) Kunth, D., Terlevich, E., Terlevich, R., et al. 1998b, arXiv, 9809096
- Leitet et al. (2013) Leitet, E., Bergvall, N., Hayes, M., et al. 2013, A&A, 553, 106
- Leroy et al. (2009) Leroy, A. K., Walter, F., Bigiel, F., et al. 2009, AJ, 137, 4670
- Leroy et al. (2008) Leroy, A. K., Walter, F., Brinks, E., et al. 2008, AJ, 136, 2782
- Licquia & Newman (2015) Licquia, T. C. and Newman, J. A. 2015, ApJ, 806, 96
- MacHattie et al. (2014) MacHattie, J. A., Irwin, J. A., Madden, S. C., et al. 2014, MNRAS, 438, L66
- Martin et al. (1991) Martin, J. M., Bottinelli, L., Gouguenheim, L., et al. 1991, A&A, 245, 393
- Mirabel & Sanders (1989) Mirabel, I. F. and Sanders, D. B. 1989, ApJ, 340, L53
- Östlin et al. (2001) Östlin, G., Amram, P., Bergvall, N., et al. 2001, A&A, 374, 800
- Östlin et al. (1999) Östlin, G., Amram, P., Masegosa, J., et al. 1999, Astronomy and Astrophysics Supplement Series, 137, 419
- Östlin et al. (2014) Östlin, G., Hayes, M., Duval, F., et al. 2014, ApJ, 797, 11
- Östlin et al. (2009) Östlin, G., Hayes, M., Kunth, D., et al. 2009, AJ, 138, 923
- Östlin et al. (2015) Östlin, G., Marquart, T., Cumming, R. J., et al. 2015, A&A, 583, A55
- Papastergis et al. (2012) Papastergis, E., Cattaneo, A., Huang, S., et al. 2012, ApJ, 759, 138
- Pardy et al. (2014) Pardy, S. A., Cannon, J. M., Östlin, G., et al. 2014, ApJ, 794, 101
- Peeples et al. (2014) Peeples, M. S., Werk, J. K., Tumlinson, J., et al. 2014, ApJ, 786, 54
- Peñarrubia et al. (2015) Peñarrubia, J., Gómez, F. A., Besla, G., et al. 2015
- Pustilnik & Martin (2007) Pustilnik, S. A. and Martin, J. M. 2007, A&A, 464, 859
- Rivera-Thorsen et al. (2015) Rivera-Thorsen, T. E., Hayes, M., Östlin, G., et al. 2015, ApJ, 805, 14
- Sandberg et al. (2013) Sandberg, A., Östlin, G., Hayes, M., et al. 2013, A&A, 552, A95
- Smoker et al. (2000) Smoker, J. V., Davies, R. D., Axon, D. J., et al. 2000, A&A, 361, 19
- Spearman (1904) Spearman, C. 1904, The American Journal of Psychology, 15, 72
- Springob et al. (2005) Springob, C. M., Haynes, M. P., Giovanelli, R., et al. 2005, ApJS, 160, 149
- Tenorio-Tagle et al. (1999) Tenorio-Tagle, G., Silich, S. A., Kunth, D., et al. 1999, MNRAS, 309, 332
- Thuan et al. (2004) Thuan, T. X., Hibbard, J. E., and Lévrier, F. 2004, AJ, 128, 617
- Vader et al. (1993) Vader, J. P., Frogel, J. A., Terndrup, D. M., et al. 1993, AJ, 106, 1743
- van Driel et al. (2001) van Driel, W., Gao, Y., and Monnier-Ragaigne, D. 2001, A&A, 368, 64
- van Eymeren et al. (2009) van Eymeren, J., Marcelin, M., Koribalski, B., et al. 2009, A&A, 493, 511
- Walter et al. (2008) Walter, F., Brinks, E., de Blok, W. J. G., et al. 2008, AJ, 136, 2563
- Werk et al. (2004) Werk, J. K., Jangren, A., and Salzer, J. J. 2004, ApJ, 617, 1004
- Wofford et al. (2013) Wofford, A., Leitherer, C., and Salzer, J. 2013, ApJ, 765, 118
- Zaritsky & Rix (1997) Zaritsky, D. and Rix, H.-W. 1997, ApJ, 477, 118
| Galaxy | EW (Å) | LLyα (x1041 erg s-1) | fesc | MHI(x108 M⊙) | W50 (km s-1) | M⋆(x108 M⊙) |
|---|---|---|---|---|---|---|
| IRAS 08339+6517 | 39.2 | 22.4 | 0.140 | 59 7.4 a | 201b | 398.1c |
| Tol 65 | 17.5 | 0.267 | 0.053 | 7.0 0.80d | 40 6d | – |
| NGC 6090 | 28.3 | 6.79 | 0.027 | 160 16e | 211 60e | 2240f |
| ESO 338-04 | 28.1 | 6.51 | 0.139 | 9.8 1.3 a | – | 12.6c |
| LARS (Avg.) | 21.69 | 0.91 | 0.09 | 1600 | 227 | 177 |