Chemical Diversity in the Ultra-faint Dwarf Galaxy Tucana II**affiliation: This paper includes data gathered with the 6.5 m Magellan Telescopes located at Las Campanas Observatory, Chile.
Abstract
We present the first detailed chemical abundance study of the ultra-faint dwarf galaxy Tucana II based on high-resolution Magellan/MIKE spectra of four red giant stars. The metallicity of these stars ranges from to , and all stars are low in neutron-capture abundances ([Sr/Fe] and [Ba/Fe] ). However, a number of anomalous chemical signatures are present. Three stars are carbon-enhanced, including the most metal-rich star. This star () shows [Na,,Sc/Fe] , suggesting an extended star formation history with contributions from AGB stars and Type Ia supernovae. The other carbon-enhanced stars have and may be consistent with enrichment by faint supernovae, if such supernovae can produce neutron-capture elements. A fourth star with is carbon-normal, and exhibits distinct light element abundance ratios from the carbon-enhanced stars. The carbon-normal star implies that at least two distinct nucleosynthesis sources, both possibly associated with Population III stars, contributed to the early chemical enrichment of this galaxy. Despite its very low luminosity, Tucana II shows a diversity of chemical signatures that preclude it from being a simple “one-shot” first galaxy, but still provide a window to star and galaxy formation in the early universe.
Subject headings:
galaxies: dwarf — galaxies: individual (Tuc II) — Local Group — stars: abundances1. Introduction
Ultra-faint dwarf galaxies (UFDs) are old, metal-poor galaxies with large mass-to-light ratios (Simon & Geha, 2007; Brown et al., 2014). These galaxies are kpc away, but detailed chemical abundances can be derived for the brightest stars in UFDs through high-resolution spectroscopy on 10 m class telescopes. The abundances of these metal-poor stars likely trace the nucleosynthetic output of the first Population III (Pop III) stars that enriched their host galaxy. Since UFDs have relatively simple star formation histories, they are a particularly powerful probe for dwarf galaxy archaeology, as all their stars formed from the same galactic environment (e.g., Frebel & Bromm, 2012; Karlsson et al., 2013; Ji et al., 2015). This provides valuable constraints on the nature and site of the first nucleosynthesis events that cannot be derived for field stars from the chemical signatures alone (e.g., Ji et al., 2016a).
High-resolution spectroscopy has led to elemental abundance measurements of stars in ten different UFDs. The overarching message is that, in most respects, stars in UFDs are chemically similar to ordinary metal-poor halo stars. Considering the population of ten UFDs, the lowest metallicity stars tend to be carbon-enhanced, a likely signature of the first stars (e.g., Cooke & Madau, 2014; Placco et al., 2014; Ji et al., 2015; Yoon et al., 2016). Most UFDs show evidence for somewhat sustained star formation and chemical evolution, with [/Fe] ratios that decline over the range to , with the notable exception of Segue 1 (Vargas et al., 2013; Frebel et al., 2014)111 for elements X,Y. The overall duration of star formation is expected to be very short (Brown et al., 2014; Webster et al., 2015), and these galaxies appear to completely lack stars with . However, the heavy element abundances of UFD stars differ significantly from those of halo stars. Most UFDs display the by now typical extremely low neutron-capture element abundances (e.g., Koch et al., 2013; Frebel et al., 2014; Ji et al., 2016c). But some UFDs deviate and contain distinctly different chemical signatures: Reticulum II shows the clear signature of a prolific -process event (Ji et al., 2016a, b; Roederer et al., 2016); and Canes Venatici II contains a star that may have an abnormally high [Sr/Ba] ratio (François et al., 2016). The diversity of neutron-capture element abundances in UFDs can be interpreted as resulting from highly stochastic production of neutron-capture elements at low [Fe/H] (e.g., Lee et al. 2013).
The UFD Tucana II (henceforth Tuc II) was recently discovered in the Dark Energy Survey (Koposov et al., 2015; Bechtol et al., 2015). It was confirmed to be a galaxy by Walker et al. (2016) since it displays a significant velocity dispersion ( km s-1) and its stars span a range of up to 1 dex in metallicity. The low luminosity () and overall metallicity () suggests that Tuc II stars may contain clues to early nucleosynthesis and the nature of the first stars.
2. Observations and Abundance Analysis
| TucII-006 | TucII-011 | TucII-033 | TucII-052 | |||||||||||||
|---|---|---|---|---|---|---|---|---|---|---|---|---|---|---|---|---|
| RA (hms) | 22 51 43.06 | 22 51 50.28 | 22 51 08.32 | 22 50 51.63 | ||||||||||||
| DEC (dms) | 58 32 33.7 | 58 37 40.2 | 58 33 08.1 | 58 34 32.5 | ||||||||||||
| aaConverted from and with formula in Bechtol et al. (2015). | 18.5 | 17.9 | 18.4 | 18.5 | ||||||||||||
| bbExposure times for TucII-006 and TucII-011 are listed separately for each night. The seeing was poor the first night. | 55, | , | ||||||||||||||
| S/NccS/N per pixel () at 5200Å and 6000Å. | 10, 20 | 16, 31 | 17, 31 | 15, 27 | ||||||||||||
| (km/s) | ||||||||||||||||
| (K)ddLTE (left) and NLTE (right) stellar parameters. LTE uncertainties include systematic errors. | ||||||||||||||||
| (cgs)ddLTE (left) and NLTE (right) stellar parameters. LTE uncertainties include systematic errors. | ||||||||||||||||
| (km/s)ddLTE (left) and NLTE (right) stellar parameters. LTE uncertainties include systematic errors. | ||||||||||||||||
| [Fe/H] (dex)ddLTE (left) and NLTE (right) stellar parameters. LTE uncertainties include systematic errors. | ||||||||||||||||
| [X/Fe] | [X/Fe] | [X/Fe] | [X/Fe] | |||||||||||||
| CeeCarbon abundances are already corrected for evolutionary status (Placco et al., 2014). | 2 | |||||||||||||||
| Na I | 2 | |||||||||||||||
| Mg I | 3 | |||||||||||||||
| Al I | 1 | |||||||||||||||
| Si I | 1 | |||||||||||||||
| Ca I | 4 | |||||||||||||||
| Sc II | 4 | |||||||||||||||
| Ti II | 9 | |||||||||||||||
| Cr I | 1 | |||||||||||||||
| Mn I | 2 | |||||||||||||||
| Fe I | 32 | |||||||||||||||
| Fe II | 0 | |||||||||||||||
| Co I | 1 | |||||||||||||||
| Ni I | 1 | |||||||||||||||
| Sr II | 2 | |||||||||||||||
| Sr II ffConservative abundance upper limit, see Figure 1 and text for details. | ||||||||||||||||
| Ba II | 2 | |||||||||||||||
| Ba II ffConservative abundance upper limit, see Figure 1 and text for details. | ||||||||||||||||
| Eu II | 1 | |||||||||||||||
We selected four of the brightest high-probability members of Tuc II from Walker et al. (2016): TucII-006, TucII-011, TucII-033, and TucII-052. On 2016 Aug 29-30, we used the Magellan Inamori Kyocera Echelle (MIKE) spectrograph (Bernstein et al., 2003) on the Magellan-Clay telescope with a 10 slit to obtain spectra of these stars ( and on the red and blue chip, respectively) covering Å. The seeing was poor on Aug 29 (1030) and good on Aug 30 (07). Individual exposures were 50-55 minutes, with 2-5 exposures per star. The resulting signal-to-noise ratios are modest, though comparable to previous UFD star observations (e.g., Ji et al., 2016c). Table 1 details our observations.
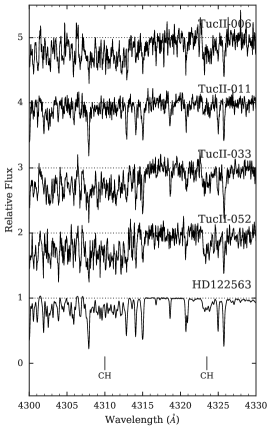
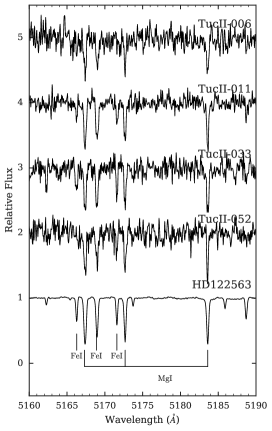
Spectra were reduced with the CarPy MIKE pipeline (Kelson, 2003)222http://code.obs.carnegiescience.edu/mike. We normalized the spectra and determined radial velocity by cross-correlation with the Mg triplet near 5200 Å using the SMH analysis software (Casey, 2014). Heliocentric velocity corrections were determined with rvcor in IRAF. Our results match the velocities reported by Walker et al. (2016) within km s-1, showing no clear evidence for binaries. Selected spectral regions are shown in Figure 1.
We perform a standard abundance analysis of these stars (details given in Frebel et al. 2013; Ji et al. 2016b). The analysis is performed exactly the same way as in Ji et al. (2016b) but we summarize key points here. We used SMH to measure equivalent widths and run the MOOG abfind and synth drivers for stellar parameters and abundances (Sneden, 1973). We use the 2011 MOOG version which accounts for scattering (Sobeck et al., 2011). Stellar parameters are determined spectroscopically through excitation, ionization, and reduced equivalent width balance (e.g., Frebel et al., 2013). Stellar parameter uncertainties are determined assuming systematic uncertainties of 150 K, 0.3 dex, and 0.2 km s-1 for , , and respectively (see Ji et al. 2016a). TucII-006 has no reliable Fe II line detections, so we use its to determine from a [Fe/H]=-3, 12 Gyr isochrone (Kim et al., 2002), and we adopt a conservative uncertainty of 0.4 dex. We use spectral synthesis to determine the abundance of C, Sc, Mn, Sr, Ba, and some lines of Al and Si. Abundances of other elements are determined from equivalent width fitting, where the typical uncertainties are ( for TucII-006, which has a noisier spectrum). Table 1 reports our stellar parameters and abundances.
One-dimensional models invoking the assumption of LTE can produce biased abundances at low [Fe/H]. As such, we also determine NLTE stellar parameters fully spectroscopically, following a new method set out in Ezzeddine et al. (2016). values are K lower than those derived in LTE, and the three stars with available Fe II line measurements have slightly higher values ( dex). All four stars have higher final Fe abundance in NLTE, with differences of [Fe/H] = [Fe/H]NLTE - [Fe/H]LTE on the order of dex. Increases of this magnitude are expected at these low metallicities and are in accordance with other NLTE-LTE Fe corrections (Lind et al., 2012). As the majority of literature studies use LTE abundances, our subsequent discussion focuses on the LTE values. However, we consider NLTE iron abundances when discussing the Tuc II metallicity spread in Section 4. Future work should make a concerted effort to address this and other topics with full NLTE-derived abundances.
Walker et al. (2016) also determined the stellar parameters and metallicities of these stars from their M2FS data, using a grid of spectra from the Segue Stellar Parameter Pipeline (SSPP, Lee et al., 2008). They cover a 50 Å region around the Mg b triplet. In this region, the MIKE and M2FS spectra have comparable signal-to-noise ratios and spectral resolution. Given the limited wavelength range, their stellar parameters are strongly influenced by a prior from photometry (Koposov et al., 2015). They determine stellar parameters independently for their repeat Jul 2015 and Sep 2015 spectra. Our results agree well with at least one of these two stellar parameter determinations.
At first, it appears that our metallicities are significantly lower than those determined by Walker et al. (2016). However, they calibrate their model against twilight spectra of the Sun. They apply a offset to and a dex offset to [Fe/H] to match the solar values. When we use their stellar parameters and increase our metallicities by dex, the [Fe/H] abundances agree to within dex for TucII-006, TucII-033, and TucII-052, well within the statistical uncertainties. However, our metallicities are systematically dex less for TucII-011, which is a cooler star. We verify with the online M2FS spectra333http://dx.doi.org/10.5281/zenodo.37476 that the differences are not due to noise in the data. This star is somewhat Mg enhanced (), which may explain the difference as the SSPP grid assumes . Otherwise, a difference between the SSPP spectral grid (which was synthesized with turbospectrum) and MOOG for cooler stars may be responsible for the discrepancy.
Given our data quality, we consider most absorption lines below 4000 Å to be unreliable, although we have used a few strong and well-detected iron lines. This restricts our ability to determine abundances of some elements. In particular, Al abundances are derived from only two lines at Å, and have very large uncertainties. The Si 3905 Å line is entirely unreliable, so we only use the 4102 Å line when available. Mn abundances should be regarded with caution as they are derived from the 4030 Å, 4033 Å, and 4034 Å lines. The Sr 4077 Å line is clearly detected but has large abundance uncertainties. We place Eu limits with the 4129 Å line.
We correct the carbon abundances for the stars’ evolutionary status (Placco et al., 2014) by assuming , although the corrections differ by dex for . In Table 1, [C/Fe] has been corrected by dex (TucII-006), dex (TucII-011), dex (TucII-033), and dex (TucII-052). Even after applying the large correction, TucII-011 is not carbon enhanced. The other three stars are just past the threshold of the Carbon-Enhanced Metal-Poor (CEMP) definition (, Aoki et al. 2007).
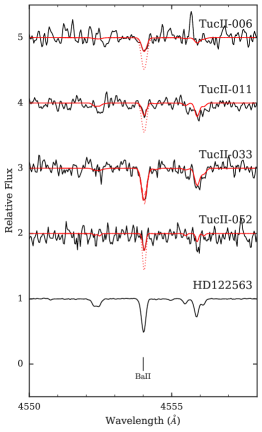
The lines of neutron-capture elements Sr and Ba are detected in all stars, although in some stars the line depths are only somewhat larger than the noise level. In Table 1, we list the abundances measured from all detected features as well as conservative upper limits (see middle panel of Figure 1 for an example). All four stars clearly have , making three of them CEMP-no stars.
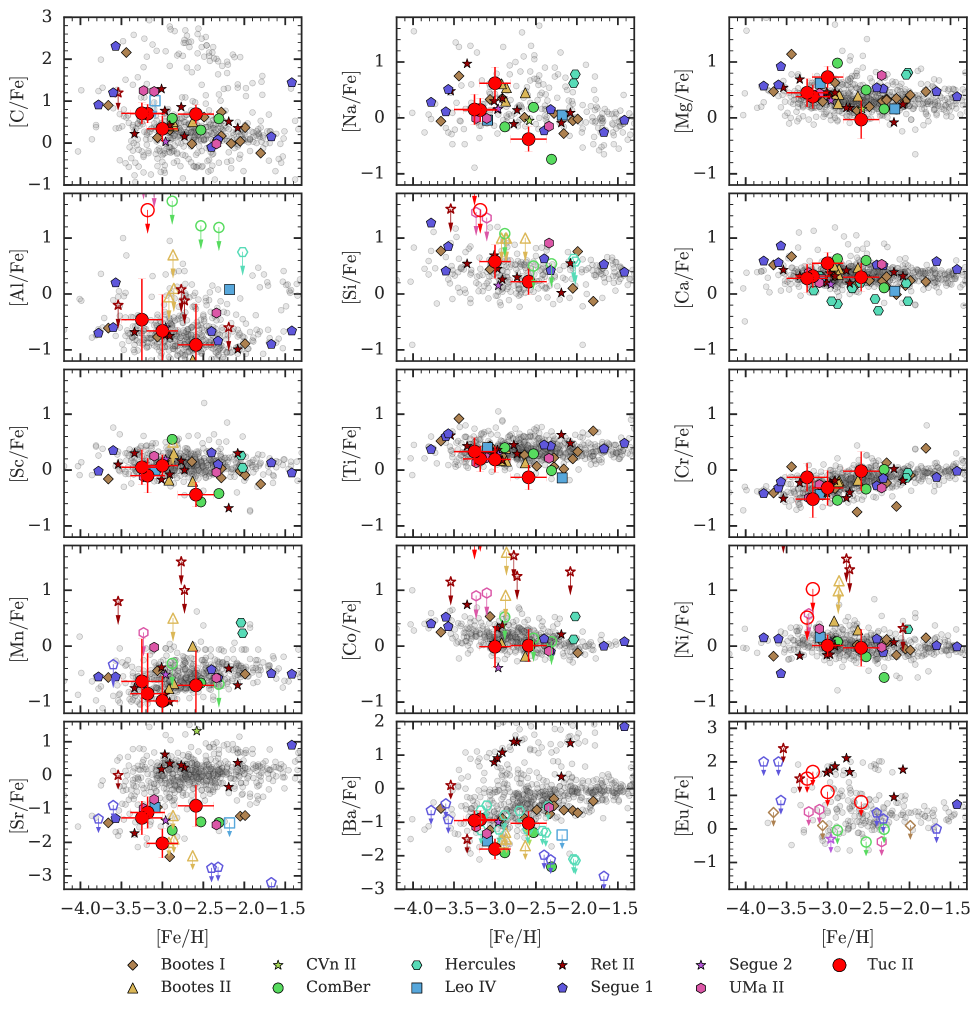
Figure 2 shows the abundances of our four Tuc II stars compared to those of equivalent halo stars and stars in other UFDs. Overall, the Tuc II stars have similar abundances as other UFD stars, with typical halo-like abundances of elements up to Ni, and low neutron-capture element abundances. Nevertheless, there are several interesting abundance differences between these four Tuc II stars that we now consider.
3. Pop III signatures in Tucana II
We first focus on the three extremely metal-poor (EMP) stars TucII-006, TucII-011, and TucII-052, with . These are the stars more likely to trace unique Pop III nucleosynthesis signatures.
TucII-006 and TucII-052 are CEMP-no stars (, ). They are only just past the CEMP threshold, but the C, Fe, Na, and Mg abundances place these stars squarely as Group II CEMP-no stars, according to the classification of Yoon et al. 2016. All elemental abundances of TucII-006 and TucII-052 are consistent with being identical given the uncertainties, as might be expected if both stars formed from the same star cluster (e.g., Bland-Hawthorn et al., 2010). The high abundance precision required to test the cluster hypothesis likely requires much higher S/N data that could be obtained with 30m class telescopes (e.g., G-CLEF on the Giant Magellan Telescope, Szentgyorgyi et al. 2014).
TucII-011 is an extremely metal-poor star () but is not carbon enhanced ( after positive correction). It is just the third EMP star known in a UFD that is not carbon enhanced (of 18 total EMP stars in 11 UFDs). The other two non-CEMP stars in UFDs are DES J033531540148 in Ret II (Roederer et al., 2016; Ji et al., 2016b) and Boo-980 in Bootes I (Frebel et al., 2016). This CEMP fraction () is somewhat higher than the halo (Placco et al., 2014) but consistent with expectations for UFDs (Salvadori et al., 2015). Besides carbon, TucII-011 differs from the Tuc II CEMP-no stars in having especially low neutron-capture element abundances () as well as somewhat enhanced , , and . The abundances of TucII-011 are thus qualitatively different from those of TucII-006 and TucII-052, likely requiring at least two different types of metal sources as explanation. As all three stars have , this could suggest that Pop III stars produce at least two distinct types of yields (e.g., Cooke & Madau 2014; Ji et al. 2015; and in contrast to, e.g., Salvadori et al. 2015). An interesting alternate scenario is if different metals created from a single source were to mix differently into the surrounding gas (Sluder et al., 2016). We note high Na and Mg are also found in DES J033531540148 (a non--process star in Reticulum II), but not in Boo-980.
[Sr/Ba] can in principle provide insight into the origin of the neutron-capture elements in Tuc II. We caution against over-interpreting this ratio for our stars, as Sr and Ba have significant abundance uncertainties. But at face value, the three EMP stars all appear to have Sr and Ba detections with . Empirically from metal-poor halo stars, the -process produces and the metal-poor -process produces (computed from -II and CEMP- stars in Frebel 2010). The [Sr/Ba] ratios of stars in Tuc II thus appear to disfavor the -process as the source of these elements. However, the lowest metallicity spinstar models (, ) can also produce (Frischknecht et al., 2016).
In a UFD, it is possible to place loose constraints on the neutron-capture element yields, as the galactic environment restricts gas dilution masses to the range (Ji et al., 2016a). For core-collapse supernova models producing Sr in neutrino-driven winds (e.g., Wanajo, 2013), the overall yield of results in , consistent with the [Sr/H] ratios observed in Tuc II444In these models, Ba is produced with if the proto-neutron star has mass . In contrast, a single spinstar produces (Frischknecht et al., 2016). This would result in , lower than what is found in our Tuc II stars.
Yoon et al. (2016) hypothesize the Group II CEMP-no stars (i.e., TucII-006, TucII-052) formed out of gas enriched only by faint, low-energy Pop III supernovae (e.g., Heger & Woosley, 2010; Nomoto et al., 2013; Cooke & Madau, 2014). However, if faint supernovae must be invoked to produce enhanced [C/Fe] seen in some Tuc II stars, it seems unlikely that any neutron-capture material produced deep in the core of the massive star will be able to escape. The neutron-capture elements found in the CEMP-no stars would then have to be synthesized in other ways, either elsewhere in the star or from a completely different source. A possible alternative is if core material escapes through jets, as some jet supernovae may also produce carbon enhanced metal yields (Tominaga et al., 2007). We note that the apparent ubiquity of neutron-capture elements in metal-poor stars (Roederer, 2013) suggests that there should be a mechanism capable of producing these elements early on, even if only in very small amounts.
4. Extended star formation in Tucana II
One of our four stars (TucII-033) is relatively metal-rich (). Because of the higher Fe content, simple homogeneous chemical evolution models would imply that this star formed later than the other three stars. Inhomogeneous metal mixing is an alternate possibility to produce this star (Frebel & Bromm, 2012; Karlsson et al., 2013; Webster et al., 2015). This star has similar [C, Sr, Ba/Fe] ratios to the CEMP-no stars, but much lower [Na, , Sc/Fe] . The abundance uncertainties are large, but if these differences are all true then one explanation is that this star has formed from gas additionally enriched both by Type Ia supernovae (decreasing [X/Fe] for most elements) and from AGB stars (increasing [C,Sr,Ba/Fe]). TucII-033 thus provides evidence for more extended chemical enrichment in Tuc II, in contrast to the smallest UFDs like Segue 1 ( and for Tuc II and Segue 1, respectively, Koposov et al. 2015; Simon et al. 2011). More detailed investigations into the galaxy formation history require either very accurate photometry (e.g., Brown et al., 2014) or a much larger sample of stellar metallicities (e.g., Kirby et al., 2011). According to the one-shot enrichment criteria in Frebel & Bromm (2012), we thus do not consider Tuc II to be a “first galaxy” candidate. Segue 1 thus remains the only known galaxy to date unambiguously satisfying the first galaxy criteria (Frebel et al., 2014).
The metallicity distribution function (MDF) of dwarf galaxies can provide additional insight into their formation history (e.g., Kirby et al., 2011; Webster et al., 2015). Unfortunately, Walker et al. (2016) have too few stars to formally resolve the metallicity dispersion of Tuc II, but the metallicity range of their probable members is dex. When interpreting MDFs, one possible concern is that metallicities derived from LTE may be systematically offset due to NLTE effects. Based on our NLTE stellar parameters, the average metallicity increases by dex. The correction is larger in more metal-poor stars, so the overall metallicity range could shrink by dex. Metallicity shifts can in principle affect the interpretations of chemical evolution models fit to MDFs (e.g., Kirby et al., 2011). However, we note that a dex increase in metallicity could also be compensated by a increase in supernova iron yields.
Walker et al. (2016) point out that the orbit of Tuc II is consistent with it being a member of the LMC system. This raises the question of whether the LMC environment might somehow affect the formation history of this galaxy. Indeed, hierarchical structure formation simulations suggest that most present-day Milky Way subhalos associated with UFDs fell into the Milky Way as members of larger systems (Wetzel et al., 2015). However, UFDs complete of their star formation by (Brown et al., 2014) and do not tend to accrete into larger systems until well after (Wetzel et al., 2015). Consequently, their star formation history is probably more influenced by reionization than by environmental effects. Furthermore, a galaxy of Tuc II’s luminosity is unlikely to have more than one star-forming progenitor halo (Griffen et al., in prep). Given their low mass and mostly isolated formation histories, high-resolution hydrodynamic zoom-in simulations of UFDs should be relatively inexpensive. We suggest that statistical samples of UFD simulations could be a fruitful path to understanding questions such as inhomogeneous metal mixing and the impact of different reionization models on the formation history of these galaxies.
References
- Aoki et al. (2007) Aoki, W., Beers, T. C., Christlieb, N., et al. 2007, ApJ, 655, 492
- Astropy Collaboration et al. (2013) Astropy Collaboration, Robitaille, T. P., Tollerud, E. J., et al. 2013, A&A, 558, A33
- Bechtol et al. (2015) Bechtol, K., Drlica-Wagner, A., Balbinot, E., et al. 2015, ApJ, 807, 50
- Bernstein et al. (2003) Bernstein, R., Shectman, S. A., Gunnels, S. M., Mochnacki, S., & Athey, A. E. 2003, Proc. SPIE, 4841, 1694
- Bland-Hawthorn et al. (2010) Bland-Hawthorn, J., Karlsson, T., Sharma, S., Krumholz, M., & Silk, J. 2010, ApJ, 721, 582
- Brown et al. (2014) Brown, T. M., Tumlinson, J., Geha, M., et al. 2014, ApJ, 796, 91
- Casey (2014) Casey, A. R. 2014, PhD thesis, Australian National University, doi:10.5281/zenodo.49493
- Cooke & Madau (2014) Cooke, R. J., & Madau, P. 2014, ApJ, 791, 116
- Ezzeddine et al. (2016) Ezzeddine, R., Plez, B., Gebran, M., & Merle, T. 2016, submitted to A&A
- François et al. (2016) François, P., Monaco, L., Bonifacio, P., et al. 2016, A&A, 588, A7
- Frebel (2010) Frebel, A. 2010, Astronomische Nachrichten, 331, 474
- Frebel & Bromm (2012) Frebel, A., & Bromm, V. 2012, ApJ, 759, 115
- Frebel et al. (2013) Frebel, A., Casey, A. R., Jacobson, H. R., & Yu, Q. 2013, ApJ, 769, 57
- Frebel et al. (2016) Frebel, A., Norris, J. E., Gilmore, G., & Wyse, R. F. G. 2016, ApJ, 826, 110
- Frebel et al. (2014) Frebel, A., Simon, J. D., & Kirby, E. N. 2014, ApJ, 786, 74
- Frischknecht et al. (2016) Frischknecht, U., Hirschi, R., Pignatari, M., et al. 2016, MNRAS, 456, 1803
- Heger & Woosley (2010) Heger, A., & Woosley, S. E. 2010, ApJ, 724, 341
- Ji et al. (2015) Ji, A. P., Frebel, A., & Bromm, V. 2015, MNRAS, 454, 659
- Ji et al. (2016a) Ji, A. P., Frebel, A., Chiti, A., & Simon, J. D. 2016a, Nature, 531, 610
- Ji et al. (2016b) Ji, A. P., Frebel, A., Simon, J. D., & Chiti, A. 2016b, ArXiv e-prints, arXiv:1607.07447
- Ji et al. (2016c) Ji, A. P., Frebel, A., Simon, J. D., & Geha, M. 2016c, ApJ, 817, 41
- Karlsson et al. (2013) Karlsson, T., Bromm, V., & Bland-Hawthorn, J. 2013, Reviews of Modern Physics, 85, 809
- Kelson (2003) Kelson, D. D. 2003, PASP, 115, 688
- Kim et al. (2002) Kim, Y.-C., Demarque, P., Yi, S. K., & Alexander, D. R. 2002, ApJS, 143, 499
- Kirby et al. (2011) Kirby, E. N., Lanfranchi, G. A., Simon, J. D., Cohen, J. G., & Guhathakurta, P. 2011, ApJ, 727, 78
- Koch et al. (2013) Koch, A., Feltzing, S., Adén, D., & Matteucci, F. 2013, A&A, 554, A5
- Koposov et al. (2015) Koposov, S. E., Belokurov, V., Torrealba, G., & Evans, N. W. 2015, ApJ, 805, 130
- Lee et al. (2013) Lee, D. M., Johnston, K. V., Tumlinson, J., Sen, B., & Simon, J. D. 2013, ApJ, 774, 103
- Lee et al. (2008) Lee, Y. S., Beers, T. C., Sivarani, T., et al. 2008, AJ, 136, 2022
- Lind et al. (2012) Lind, K., Bergemann, M., & Asplund, M. 2012, MNRAS, 427, 50
- Nomoto et al. (2013) Nomoto, K., Kobayashi, C., & Tominaga, N. 2013, ARA&A, 51, 457
- Placco et al. (2014) Placco, V. M., Frebel, A., Beers, T. C., & Stancliffe, R. J. 2014, ApJ, 797, 21
- Roederer (2013) Roederer, I. U. 2013, AJ, 145, 26
- Roederer et al. (2016) Roederer, I. U., Mateo, M., Bailey, III, J. I., et al. 2016, AJ, 151, 82
- Salvadori et al. (2015) Salvadori, S., Skuladottir, A., & Tolstoy, E. 2015, ArXiv e-prints, arXiv:1506.03451
- Simon & Geha (2007) Simon, J. D., & Geha, M. 2007, ApJ, 670, 313
- Simon et al. (2011) Simon, J. D., Geha, M., Minor, Q. E., et al. 2011, ApJ, 733, 46
- Sluder et al. (2016) Sluder, A., Ritter, J. S., Safranek-Shrader, C., Milosavljević, M., & Bromm, V. 2016, MNRAS, 456, 1410
- Sneden (1973) Sneden, C. A. 1973, PhD thesis, The University of Texas at Austin.
- Sobeck et al. (2011) Sobeck, J. S., Kraft, R. P., Sneden, C., et al. 2011, AJ, 141, 175
- Szentgyorgyi et al. (2014) Szentgyorgyi, A., Barnes, S., Bean, J., et al. 2014, in Proc. SPIE, Vol. 9147, Ground-based and Airborne Instrumentation for Astronomy V, 914726
- Tominaga et al. (2007) Tominaga, N., Maeda, K., Umeda, H., et al. 2007, ApJ, 657, L77
- Vargas et al. (2013) Vargas, L. C., Geha, M., Kirby, E. N., & Simon, J. D. 2013, ApJ, 767, 134
- Walker et al. (2016) Walker, M. G., Mateo, M., Olszewski, E. W., et al. 2016, ApJ, 819, 53
- Wanajo (2013) Wanajo, S. 2013, ApJ, 770, L22
- Webster et al. (2015) Webster, D., Bland-Hawthorn, J., & Sutherland, R. 2015, ApJ, 799, L21
- Wetzel et al. (2015) Wetzel, A. R., Deason, A. J., & Garrison-Kimmel, S. 2015, ApJ, 807, 49
- Yoon et al. (2016) Yoon, J., Beers, T. C., Placco, V. M., et al. 2016, ArXiv e-prints, arXiv:1607.06336