Monolayer Adsorption of Noble Gases on Graphene
Abstract
We report our results on the adsorption of noble gases such as argon, krypton and xenon on a graphene sheet, using Grand Canonical Monte Carlo (GCMC) simulations. We calculated the two-dimensional gas-liquid critical temperature for each adsorbate, resulting in fair agreement with theoretical predictions and experimental values of gases on graphite. We determined the different phases of the monolayers and constructed the phase diagrams. We found two-dimensional incommensurate solid phases for krypton, argon and xenon, and a two-dimensional commensurate solid phase for krypton.
pacs:
Valid PACS appear hereI Introduction
The properties of adsorbed monolayers (one-atom thick layer) have been investigated for many years, motivated by the realization of 2D matter and the implications on the new technologies based on new substrates. For example, adsorption of noble gases have been studied on many substrates like graphite D’Amico et al. (1990); Larher (1974); Migone et al. (1984); Larher and Gilquin (1979); Thomy et al. (1981) and metals Unguris et al. (1981); Taub et al. (1991); Ramseyer et al. (1994); Jaubert et al. (1981).
Bruch et.al. constructed the phase diagrams of noble gases adsorbed on graphite, by collecting data from several experiments. Bruch et al. (2007) For monolayer Kr, two solid phases are observed in the diagram: an incommensurate solid (IS) and a commensurate solid (CS) with a fractional density of 1/6 (one Kr atom per every 6 carbons). Monolayer Ar and Xe, on the other hand, do not exhibit a 2D- CS phase.
More recently in Ref. Bruch et al. (2010) , Bruch. et.al. studied the case of films formed on both sides of a suspended graphene sheet. Superfluid helium on graphene got particular attention as well. Happacher et al. (2013); Gordillo and Boronat (2009); Kwon and Ceperley (2012)
We have studied the behavior of Kr and Ar on suspended single-walled carbon nanotubes Kim et al. (2011); Mbaye et al. (2016), and found that Kr forms a cylindrical shell that has a unique CS structure with fractional density 1/4. The 1/4-CS appears exclusively on medium-sized zigzag nanotubes. On larger NTs, Kr forms a shell of coverage 1/6 that is, however, not solid. For Ar on the other hand we have not observed commensuration in any of the nanotubes tested.
In this paper we report numerical results of the monolayer adsorption of Ar, Kr and Xe on a graphene sheet, placed at the bottom of the simulation cell. We use the method of Grand Canonical Monte Carlo (GCMC) simulation. GCMC allows us to calculate the average number of atoms adsorbed on graphene as a function of the pressure of the vapor and temperature of the system. In the simulations we collect sample configurations that we use to test the structure of the monolayers. From calculations of the radial distribution function and structure factor we evaluate the phase of the monolayer (liquid, IS or CS).
This paper is organized as follows. In the next section, we present the methodology, the model for the interaction potentials, and the GCMC simulation method. In section III we describe the results of the adsorption of Ar, Kr, and Xe and discuss the structure of the monolayers. Finally in section IV we summarize and present our conclusions.
II Methodology
We used the method of GCMC, Frenkel and Smit (2001) in which the average number of particles and energy of the system is computed. The method has been extensively used for simulations of adsorption. Calbi et al. (2008, 2001); Gatica et al. (2001)
The simulation cell is a rectangular box of size Å, Å, and Å. The graphene sheet was positioned at the base of the simulation cell () so that the adsorption occurs only on one side of it.
The boundary conditions were set periodic in the and directions and reflective in .
For each gas, simulations were run at several values of the temperature and pressure of the vapor. For Ar, the simulation temperature ranged from 41 K to 79 K at 2 K increments; from 70 K to 140 K with an increment of 5 K for Kr and from 90 K to 160 K at 5 K increments for Xe. Each GCMC simulation was done at fixed temperature () and chemical potential (); is related to the pressure of the vapor in equilibrium with the adsorbate by the equation of state. In our simulations we considered the vapor an ideal gas.
The graphene layer was assumed to be rigid and infinitely wide on the plane, which we realized by setting periodic boundary conditions on the directions. The input data of the simulation are the pressure of the vapor (), and the temperature (); the output data are the average number of adsorbed atoms (), the averages of the total energy (), the energy gas-surface () and the energy gas-gas (). We also collected samples of the coordinates of the adsorbed atoms. The number of MC moves for each single data point in the isotherms was typically , to reach equilibrium. Additionally, moves were performed for data collection. For each temperature, the simulation was run 90 times; each time, the pressure was increased by 10 %. The ratio of creation/deletion/translation steps was set to 0.40/0.40/0.20.
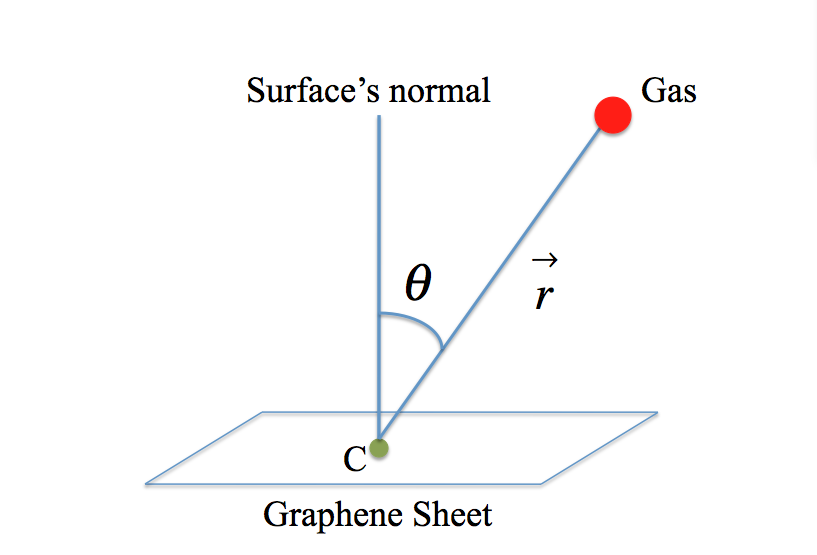
The potential interaction energy between the adsorbate and the graphene was calculated with the Lennard Jones (LJ) anisotropic potential.Carlos and Cole (1980) In the anisotropic potential, the pairwise interaction depends not only on the distance between the carbon atoms and the gas molecules, but also on the angle between the vector (relative position of the gas atom and the carbon atom) and the surface’s normal (see \Figrefmol). The potential is given by,
| (1) | ||||
where and are the LJ parameters and is the distance between the gas atom and the carbon atom. and determine the anisotropy of the dispersion potential and is the angle between and the surfacefls normal as shown in \Figrefmol. This angular dependence originates in the anisotropy of the bonds of the C atoms in the graphene sheet; as a result the potential becomes more corrugated.
The LJ parameters for the adatom-C potential are obtained by fitting physical properties of the gasesStan et al. (2000) and using the semi-empirical Lorentz-Berthelot combining rules: Scoles (1990)
| (2) | ||||
| (3) |
| Adsorbate | (K) | (Å) |
|---|---|---|
| Ar | 120.0 | 3.4 |
| Kr | 171.0 | 3.6 |
| Xe | 221.0 | 4.1 |
| C (graphene) | 28.0 | 3.4 |
For our study, we have adopted and based on a previous study of He on graphite by Cole et al. Carlos and Cole (1980).
The interaction energy among adsorbate’s atoms was calculated with the regular LJ potential.
To determine the phase behavior of the adsorbed monolayers, we inspected the discontinuities or steps in the energy gas-surface function and the adsorption isotherms . We carefully analyzed sample configurations around steps in the isotherms. Based on the radial distribution function, we determined the phase (solid or liquid). Similarly, we evaluated the commensuration i.e. CS or IS based on the structure factor.
The two-dimensional radial distribution function (2D-RDF) of a system of particles describes how the density varies as a function of the distance from a reference particle. For a distribution of atoms or molecules on a surface, it is given by the following equation:
| (4) |
where is the number of pairs of atoms at a distance between and and is the number of atoms per unit area.
The structure factor characterizes the amplitude and phase of a wave diffracted from crystal lattice planes. It is simply the squared modulus of the Fourier transform of the pair correlation function given by,
| (5) |
where is the 2D wave vector and is the position vector of the particle in the monolayer. can be written in terms of the reciprocal lattice vectors and ,
| (6) |
with and arbitrary real numbers. For a perfect lattice, is equal to 1 for all integer and , and identically zero for non-integer values. On the other hand, for an array of atoms in a non-matching lattice or a non-solid phase.
III Results
III.1 Argon
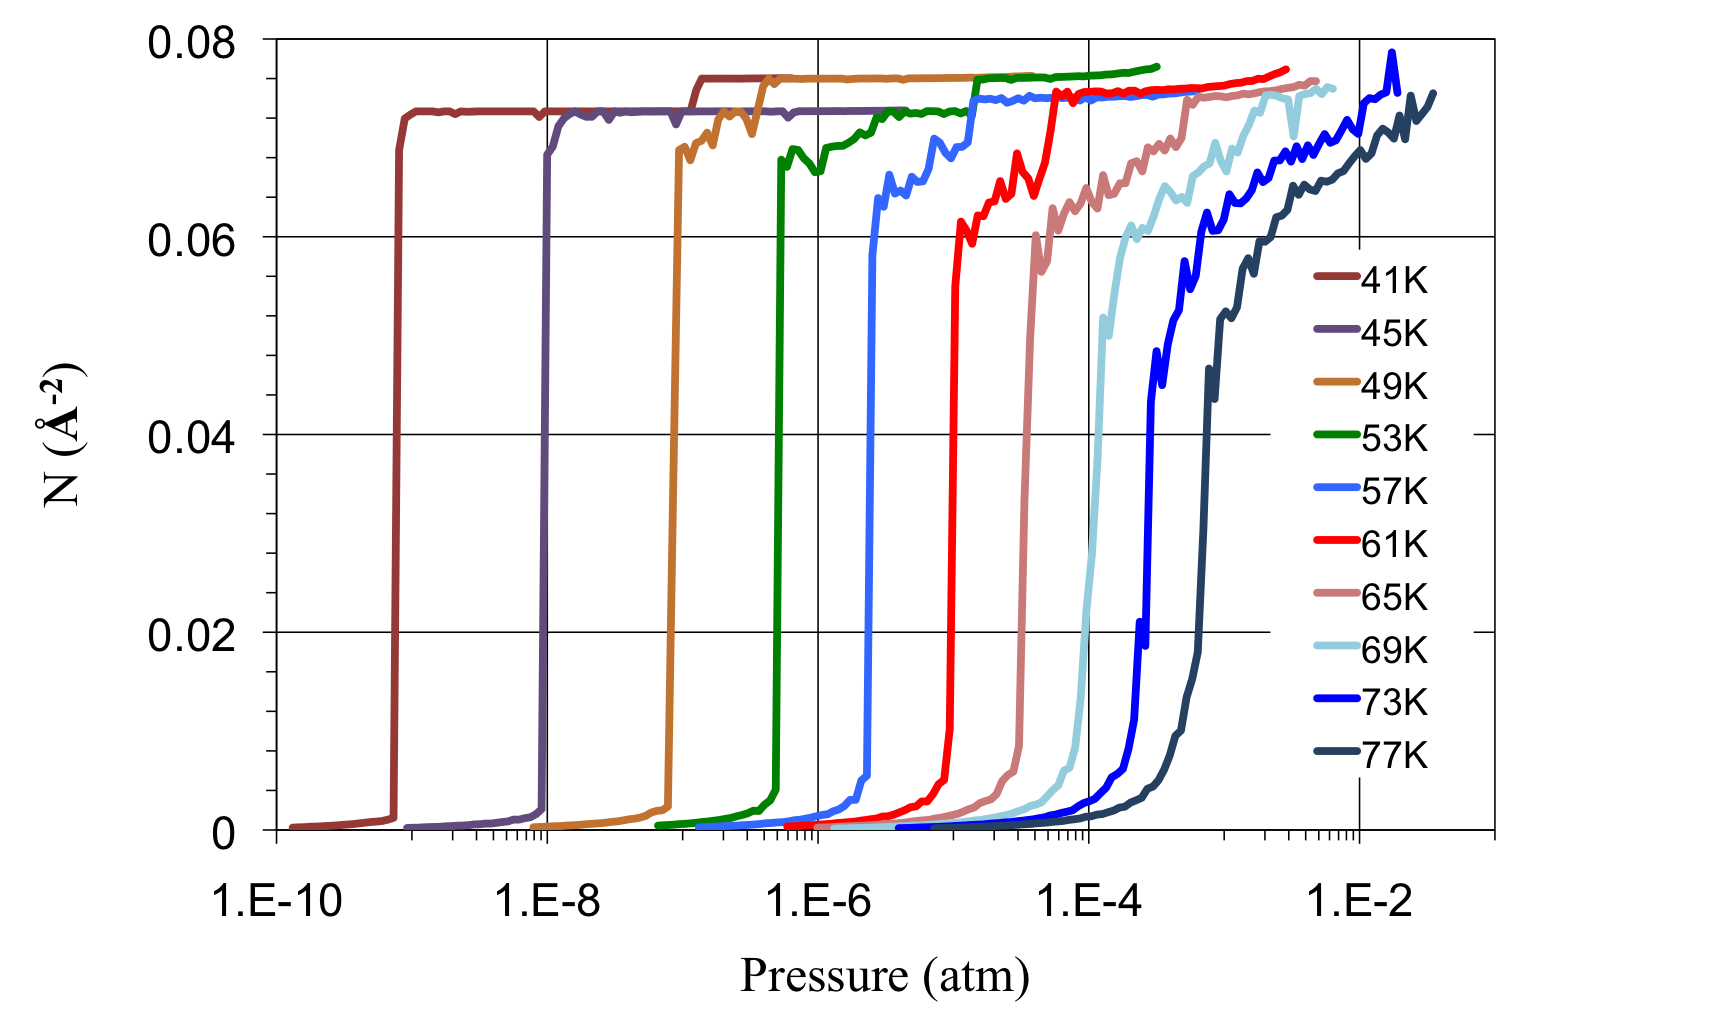
Ar represents the adsorption isotherms for argon adsorbed on graphene. For each temperature, we observe that at low vapor pressure the amount of adsorbed atoms is very low ( Å-2), which corresponds to a 2D gas. At a higher pressure, the density of the film rapidly raise. The lower the temperature the faster the film’s density grows. For example, at the lowest temperature seen in \FigrefAr (41 K), the isotherm steps straight up to form a film of density 0.0726 Å-2. Vertical steps in the isotherms appear for higher temperatures as well, up to the critical temperature at which the isotherms qualitatively change to smooth continuously growing curves. For temperatures lower than , there is a coexistence of a 2D gas and a dense monolayer, which can be solid or liquid. As the temperature increases, the gap between the gas and monolayer densities decreases approaching zero at . The critical temperature is computed as the temperature at which the inverse slope of the isotherms becomes zero. The result of our calculation is K K.
The critical temperature of a two-dimensional Lennard-Jones lattice has been theoretically predicted to be . Smit and Frenkel (1991) In the case of Ar it results 62.4 K, in excellent agreement with our calculation. The critical density is also predicted theoretically to be , which for Ar is 0.03 Å-2, consistent with our simulations. Experimental measurements of the critical point of monolayer Ar on graphite are K Larher and Gilquin (1979) and 55 K Migone et al. (1984), which are 11% lower than the theoretical or simulation predictions.
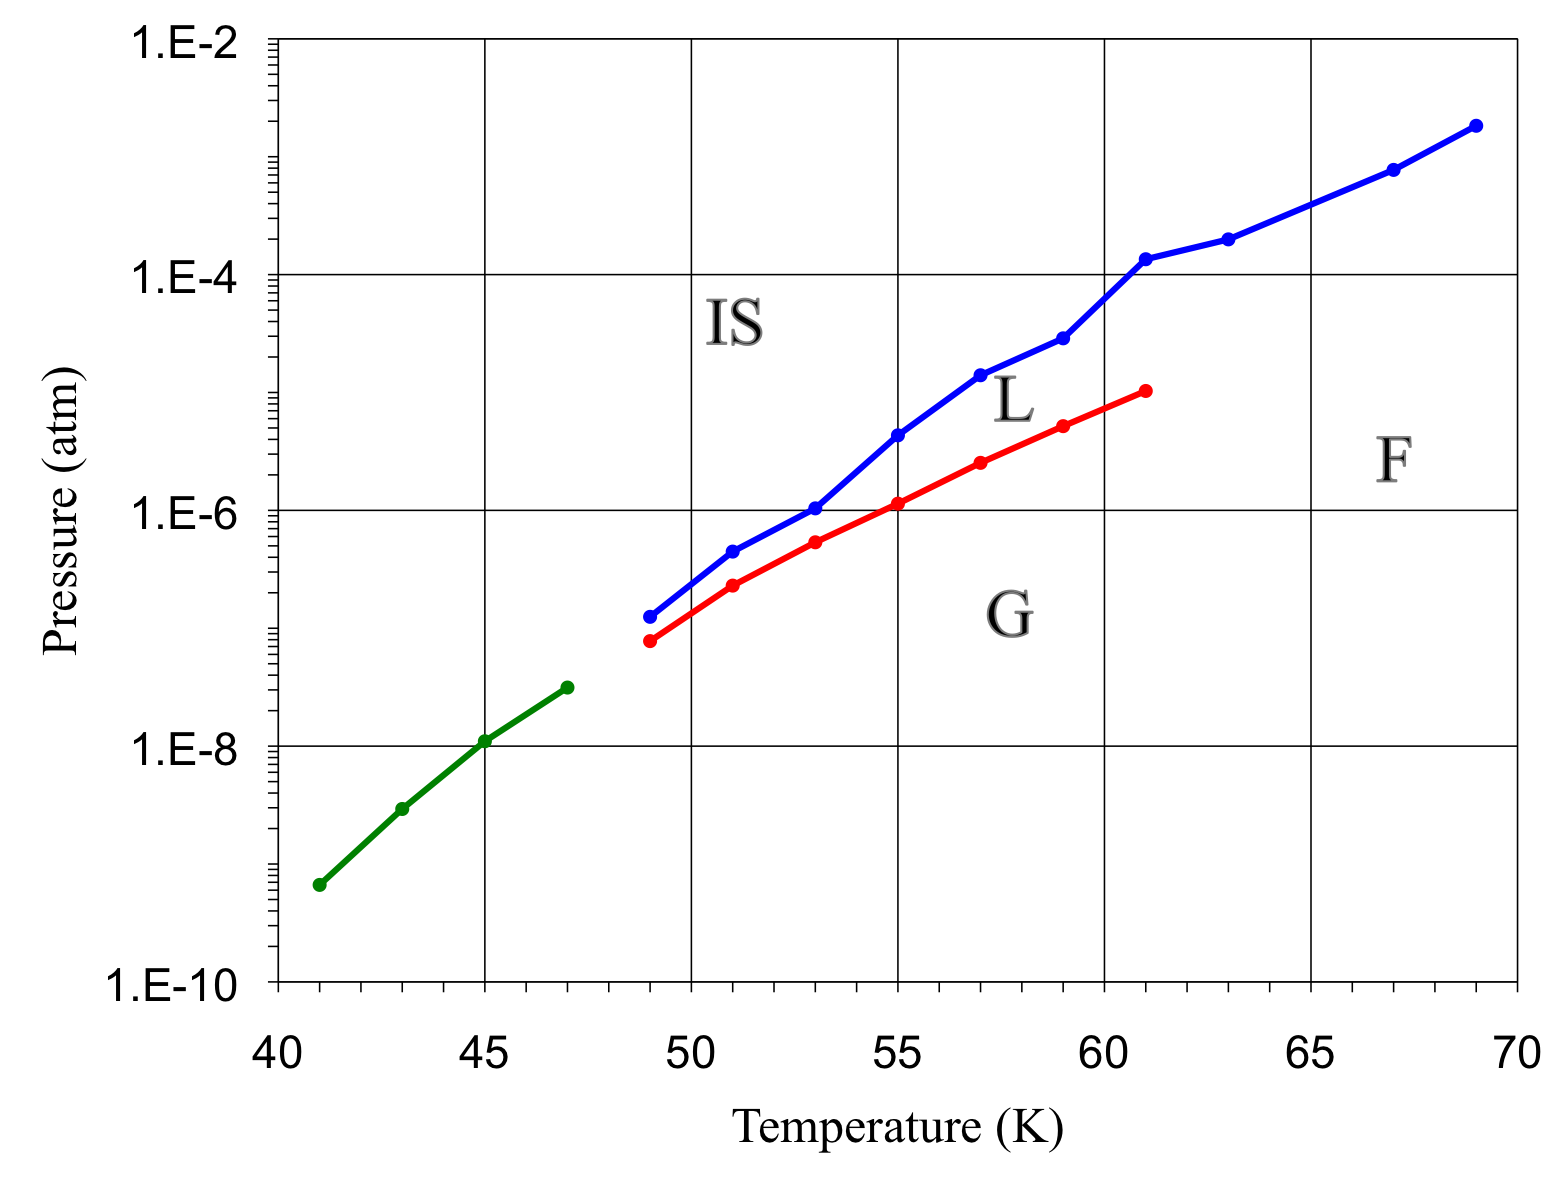
By inspecting the 2D-RDF and the structure factor of several samples in the monolayer regime we determined the phases (G, L, IS or CS)
At the lowest temperatures, the density remains constant for a wide range of pressures, seen as the flat portion of the isotherm. At higher vapor pressure, the monolayer slightly compresses from 0.0726 to 0.076 Å-2. In this regime, the argon monolayer is an incommensurate solid. At higher temperature, on the other hand, the monolayer is a 2D liquid transitioning to a 2D IS. Hence, for Ar we found three phase transitions: 2D-G to 2D-L, 2D-G to 2D-IS and 2D-L to 2D-IS.
For comparison, the 2D-density of the commensurate solid phase on graphene or graphite, which has a ratio 1/6 adsorbate/carbon atoms is 0.063 Å-2 while the 2D-LJ solid lattice has a density 0.079 Å-2. In our simulation, we obtained a monolayer of density 0.0726 - 0.076 Å-2, consistent with an incommensurate solid phase.
Our results are summarized in a phase diagram, shown in \Figrefphase-Ar where we see three coexistence lines: G-IS and G-L and L-IS. We estimated the triple point temperature at K K. This value is in excellent agreement with the experimental report for Ar on graphite from Migone et al. Migone et al. (1984) ( K) and in fair agreement with D’Amico et al. D’Amico et al. (1990) ( K).
III.2 Krypton
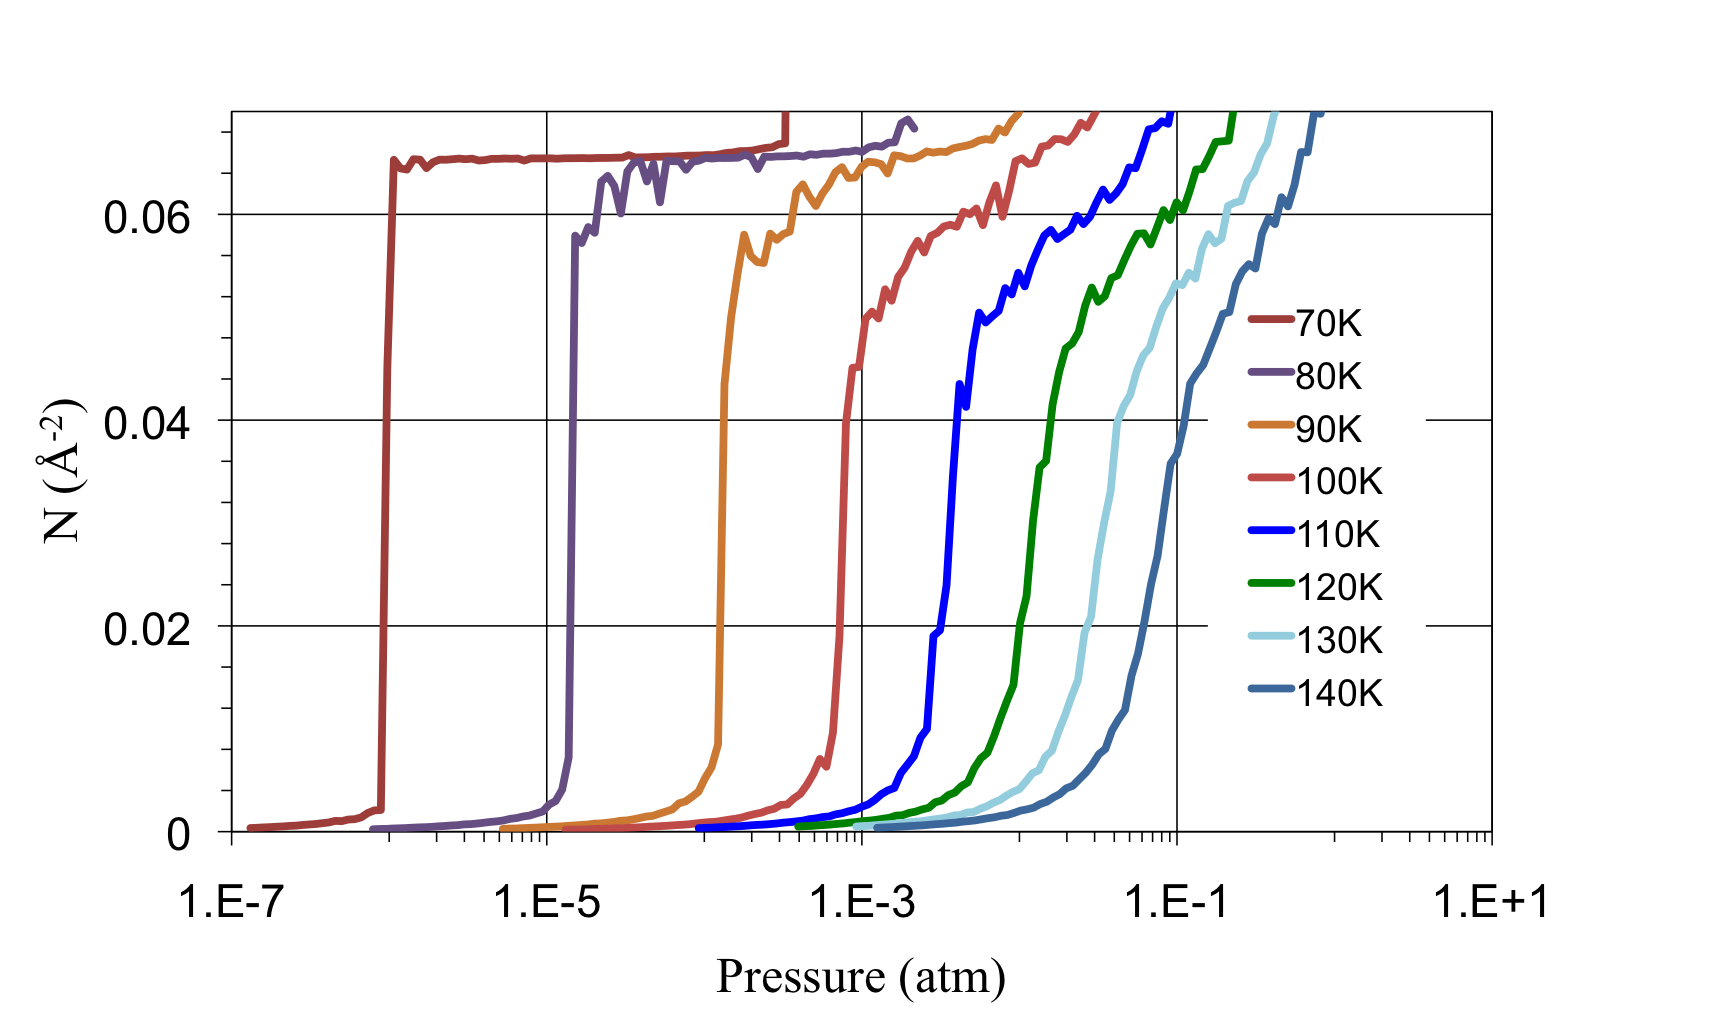
We studied the monolayer adsorption of Kr on graphene with the same methodology. The adsorption isotherms for few temperatures are shown in \FigrefKr. Using the same analysis as in the argon case, we estimated a 2D G-L critical temperature K K, which agrees with the theoretical value K and is 6% higher than the experimental result reported in ref. Larher and Gilquin (1979) (85.3 K). The theoretical prediction of the 2D-LJ critical density is Å-2, consistent with our simulations.
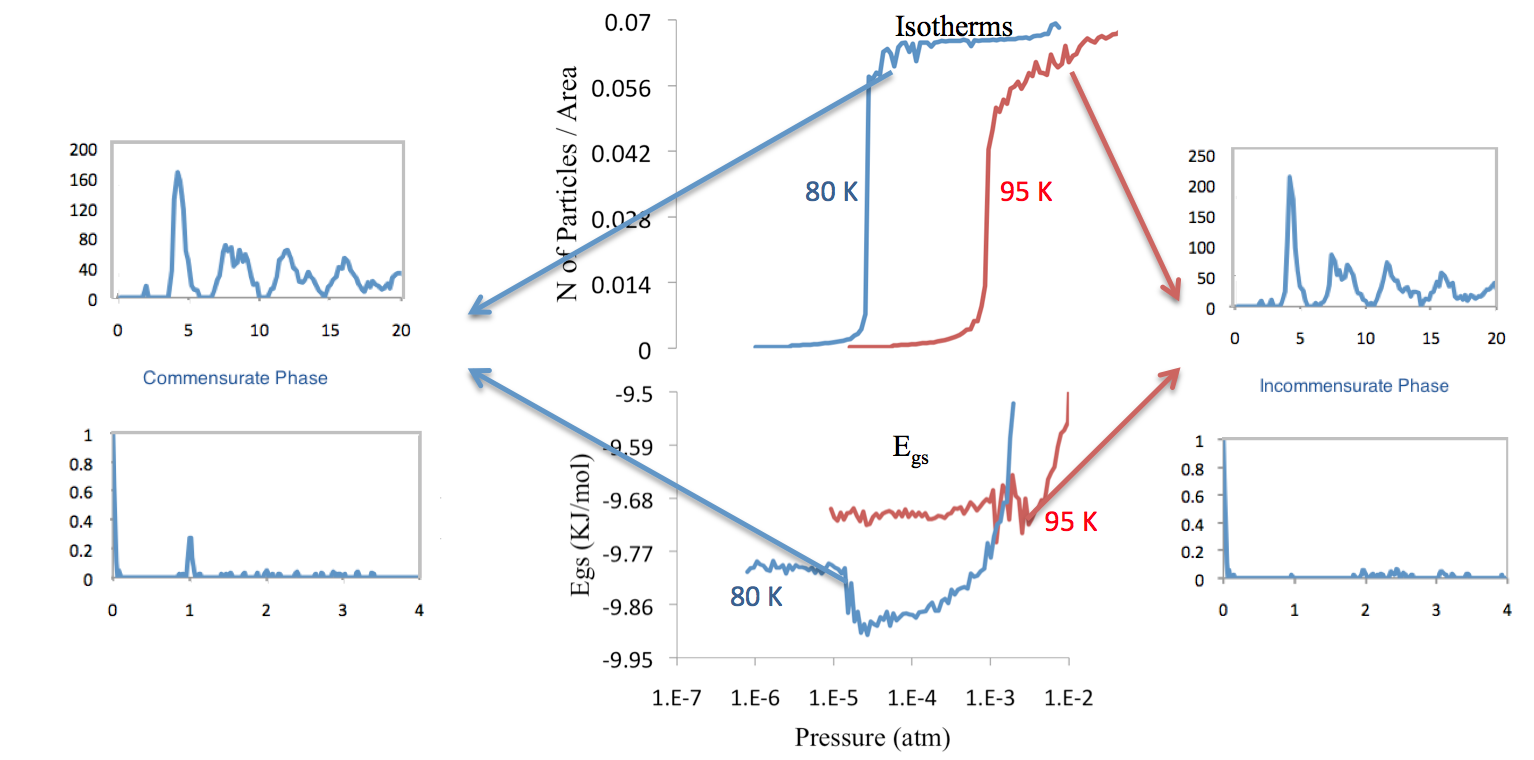
The monolayer density of Kr in the simulation is 0.065 Å-2, which is lower than the density of the 2D-LJ lattice (0.071 Å-2) and similar to the 1/6 CS (0.063 Å-2). Hence, contrary to the case of Ar, Kr forms both commensurate and incommensurate solid phases. The CS phase is observed at low temperature and low pressure, while the IS appears at higher and .
To illustrate our analysis, in \FigrefRDR-SF we show the adsorption isotherms, gas-surface energy, 2D-RDF and SF at 80 K and 95 K. Significant fluctuations in the monolayer density suggest a change of phase. The 2D-RDF in both cases is consistent with a solid phase. The SF ) is shown as a function of (with ). At K the SF is mostly flat, meaning that the phase is IS. At K, on the other hand, the SF shows a pick at , indicating a structure consistent with a CS phase.
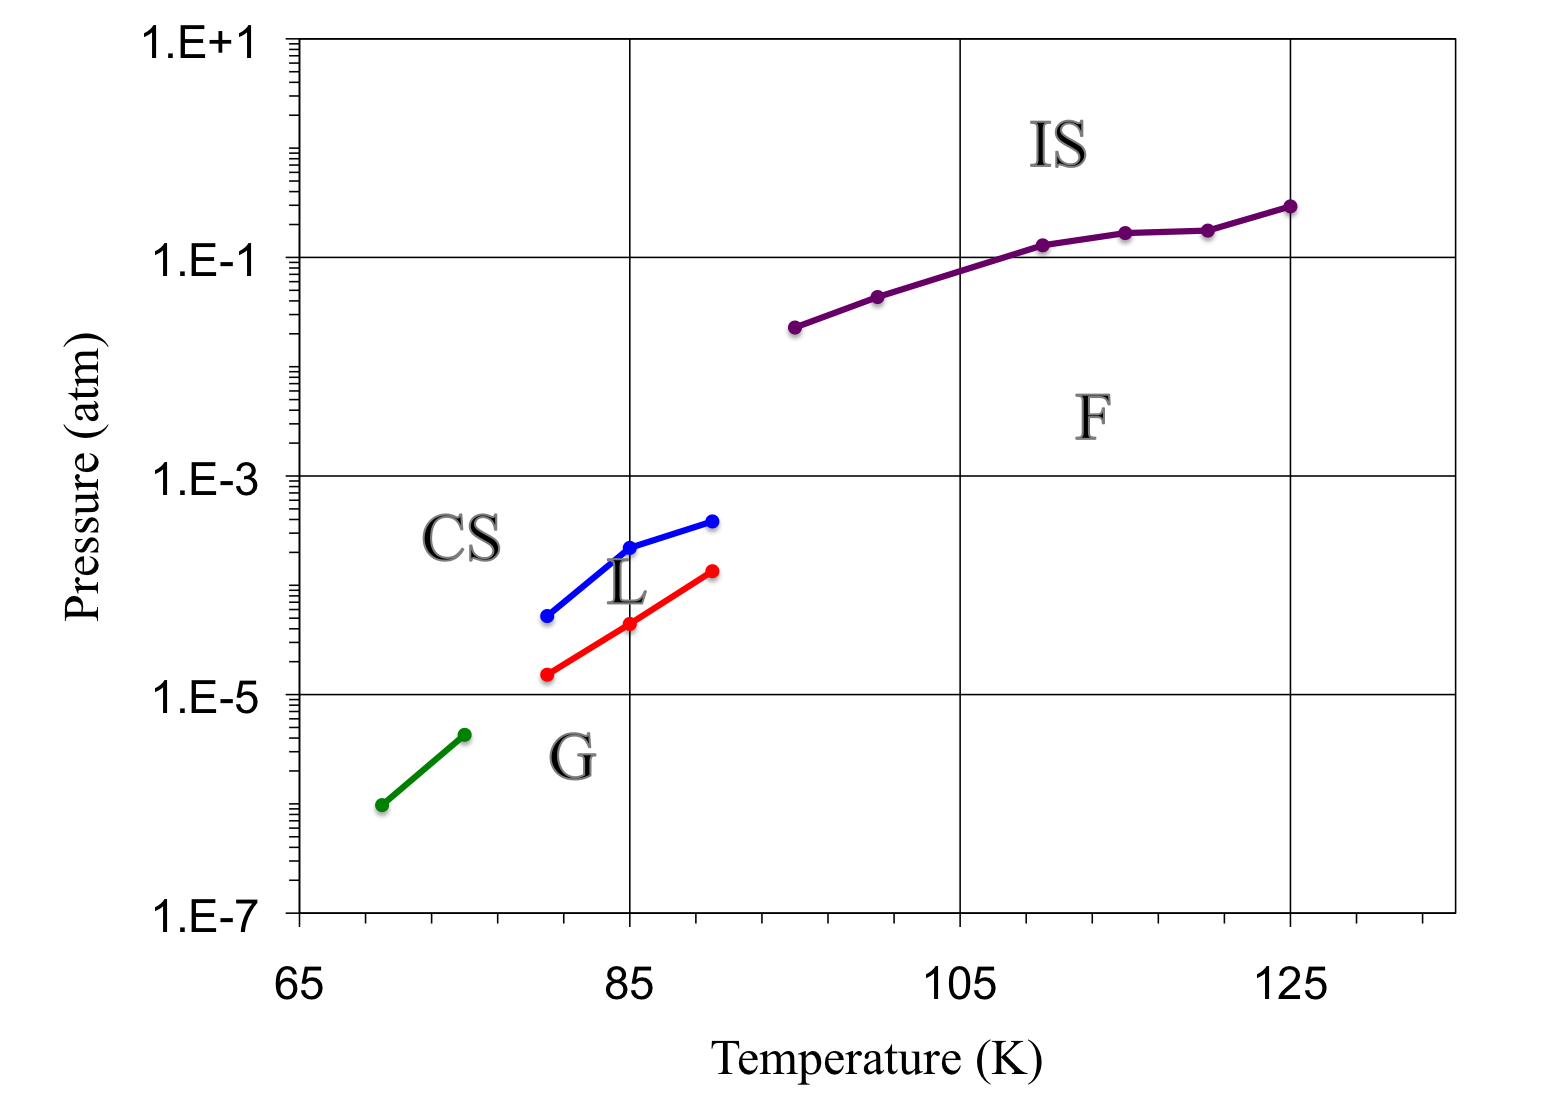
From these analysis we identified transitions 2D-G to 2D-L, 2D-G to 2D-CS and 2D-L to 2D-CS, represented in \Figrefphase-Kr. According to our results there is a triple point at temperature K K.
III.3 Xenon
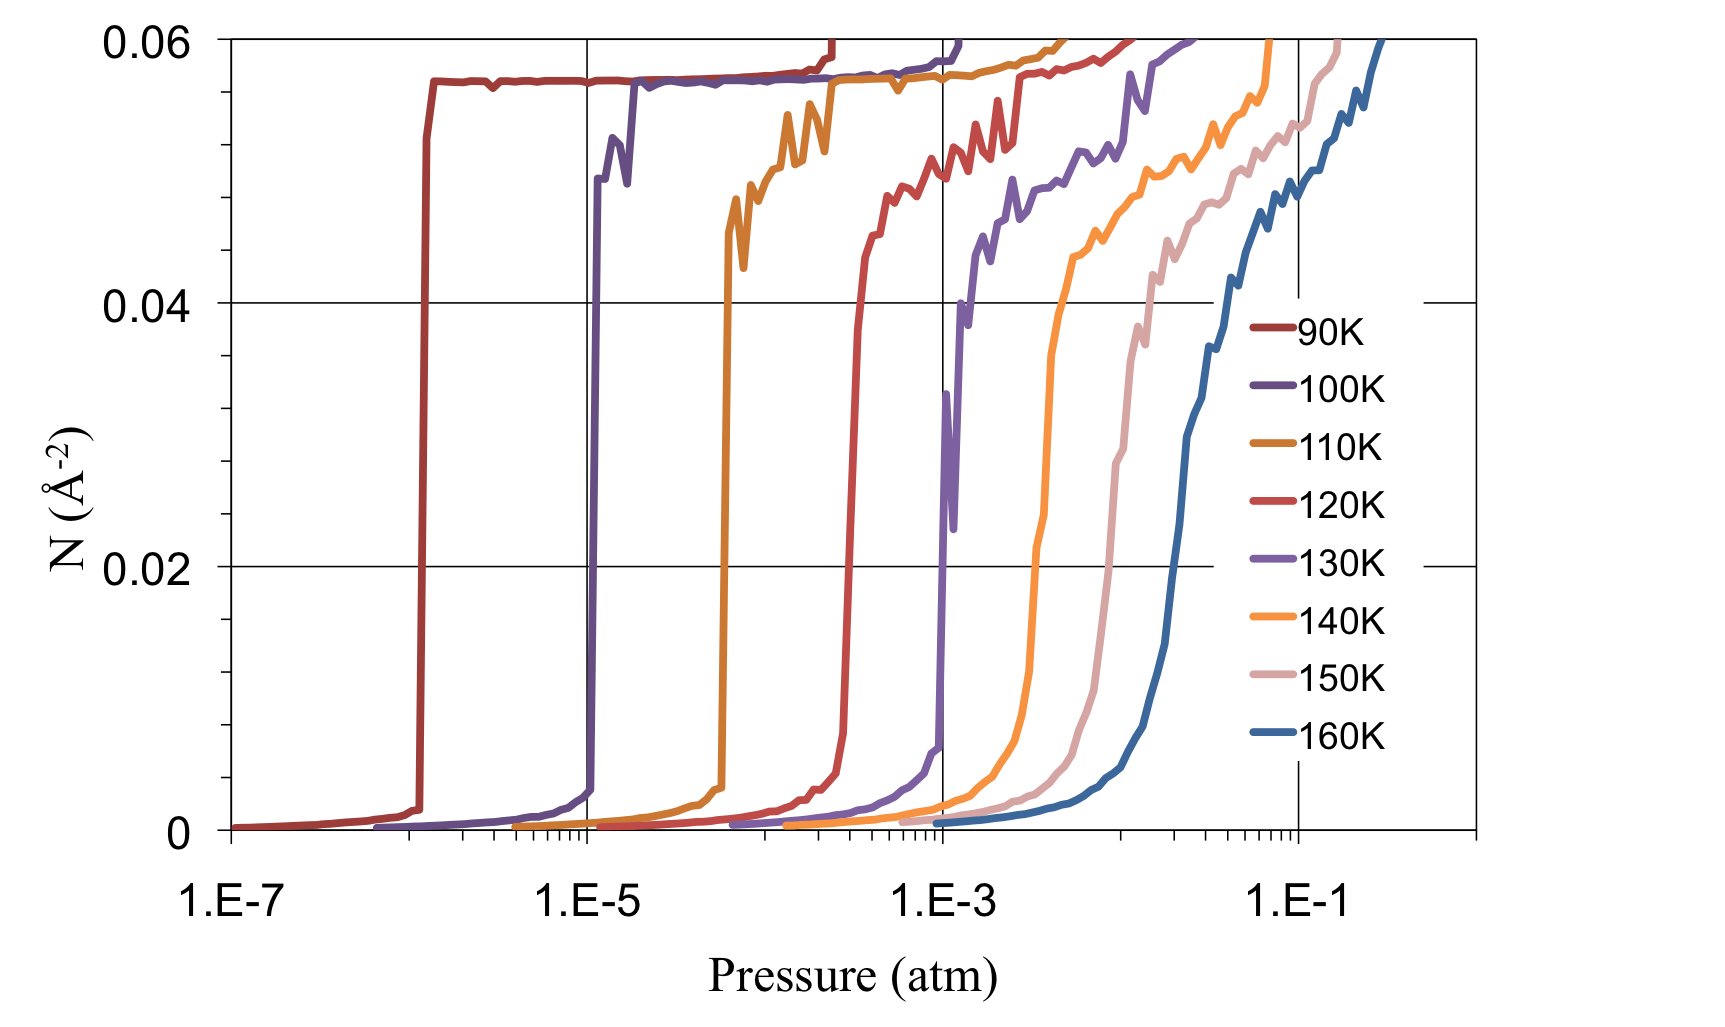
Finally, we simulated the monolayer adsorption of xenon on graphene. We run simulations from T=90K to T=160K. A few adsorptions isotherms are represented in \FigrefXe. Our calculation of the 2D G-L critical temperature is K K, which coincide with the theoretical value, K and the experimental value for Xe on graphite, 117 K. Thomy et al. (1981).
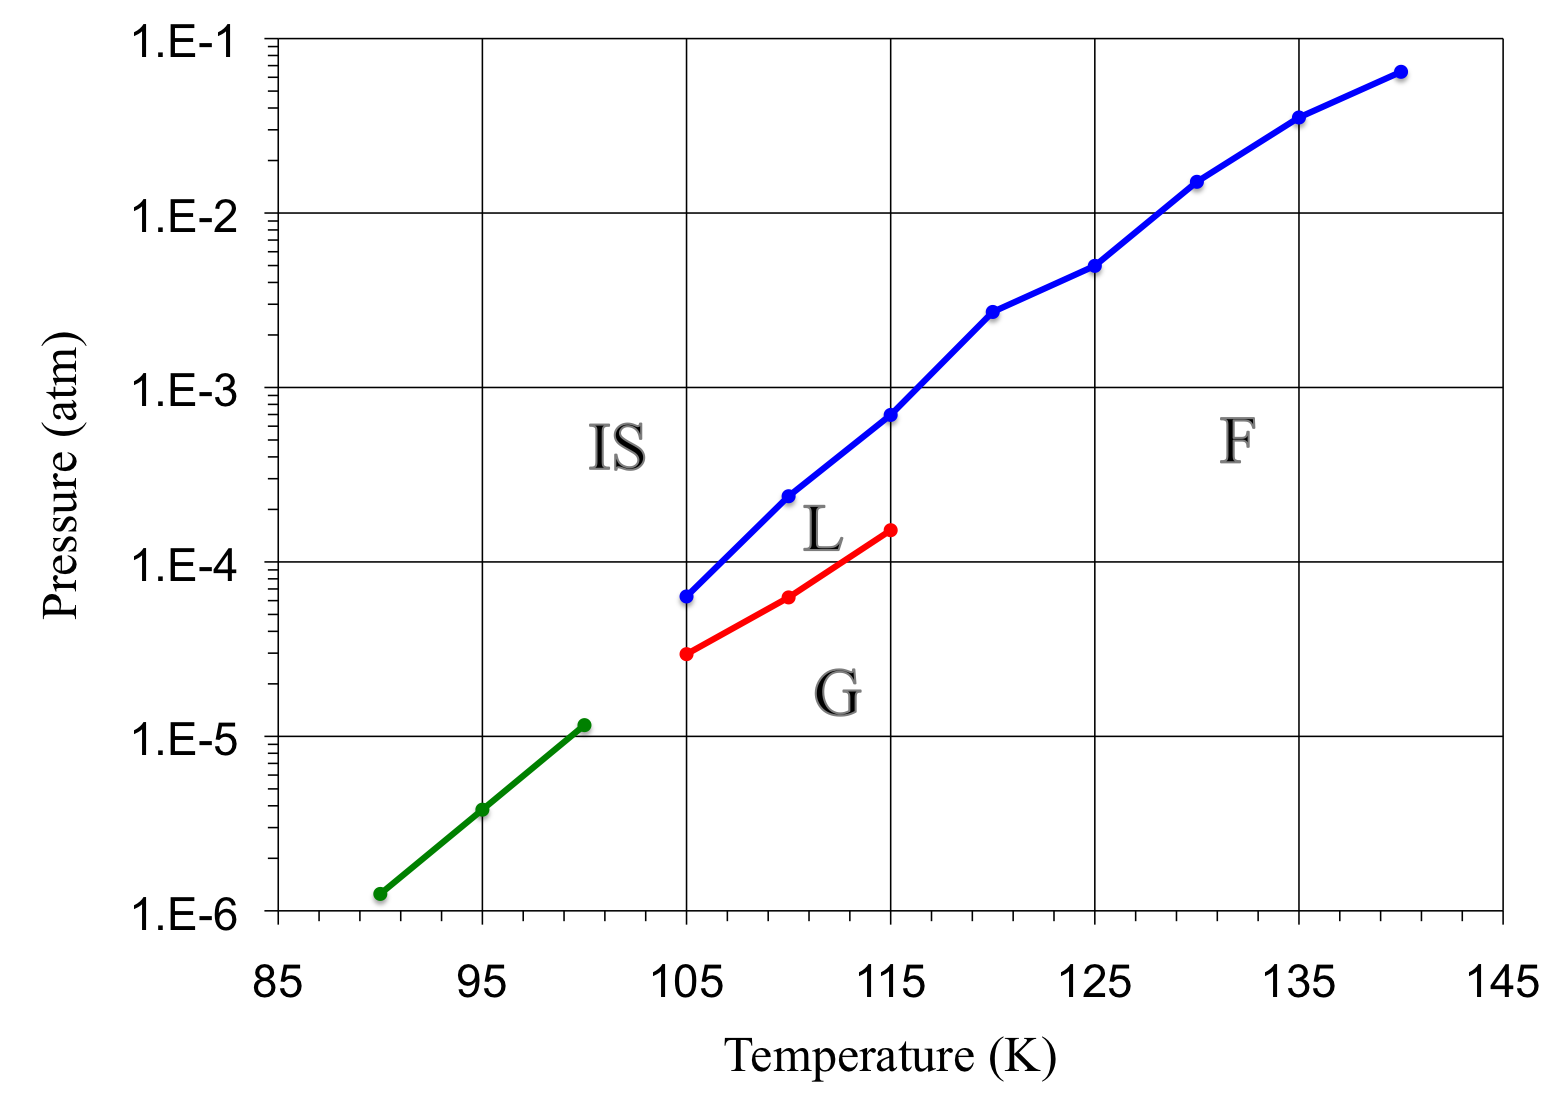
The monolayer density in the simulation is 0.057 Å-2, which is lower than the value of the commensurate solid phase (0.063Å-2) and similar to the LJ solid lattice (0.055 Å-2). From the inspection of the 2D-RDF and SF we observed transitions form gas and liquid phases to an incommensurate solid phase.
We exhibit the resulting phase diagram in \Figrefphase-Xe. We find a triple point at k K, in agreement with the experimental value for Xe on graphite (99 K Thomy et al. (1981)).
IV Summary and Conclusions
Using Grand Canonical Monte Carlo simulations, we studied the adsorption of noble gases (Argon, Krypton, Xenon) on a graphene sheet.
The main approximations used in the simulations are that the graphene layer is rigid, and that the effect of the substrate supporting the graphene is ignored.
Using the adsorption isotherms, we calculated the 2D gas-liquid critical temperature for each gas, resulting in fair agreement with theoretical predictions and experimental values of gases on graphite.
We determined the different phases of the gases on graphene by inspecting the radial distribution function and the structure factors.
We found 2D incommensurate solid phases for krypton, argon and xenon on graphene, and a 2D commensurate solid phase for krypton at low temperature.
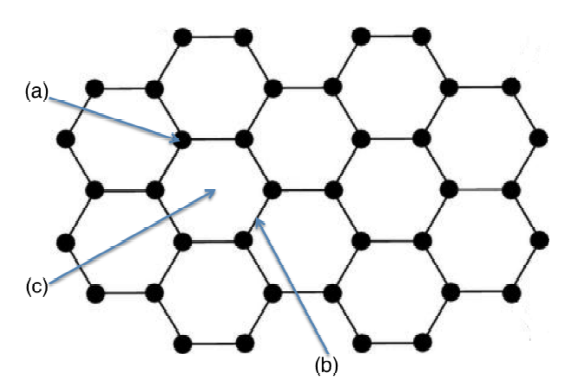
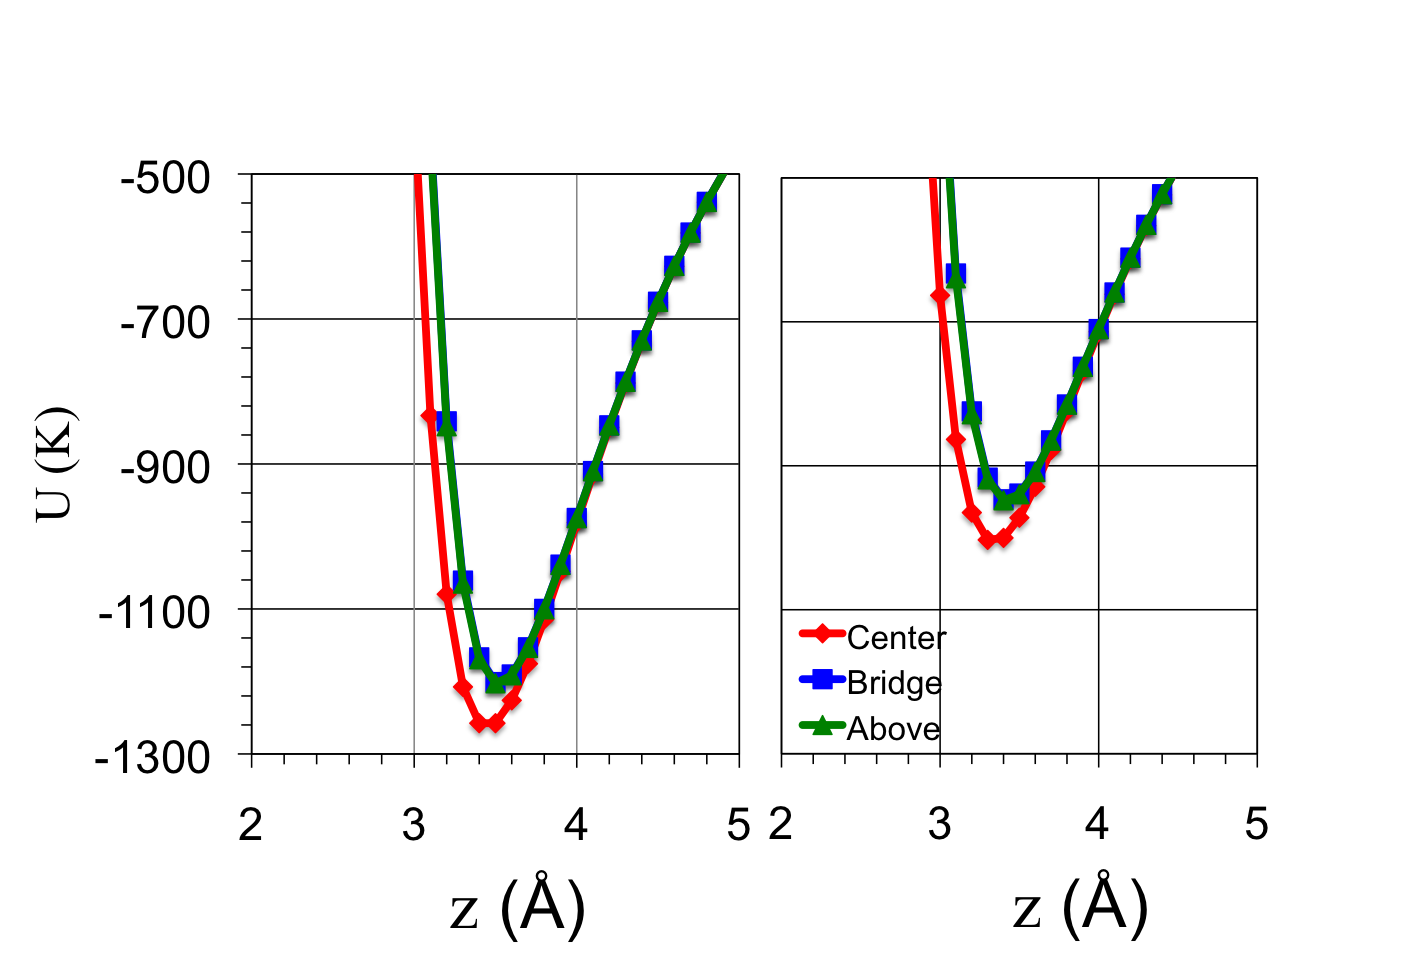
The absence of a commensurate solid phase in the case of Xe is simply caused by its size: Xe does not ”fit” in the 1/6 lattice. On the other hand, the qualitative difference between the behavior of Kr and Ar is due to a combination of size and energy effects. We may have expected a higher corrugation of the substrate potential for Kr than for Ar. The corrugation of the potential is defined as the energy difference between the least attractive and the most attractive sites on the surface. Those sites are shown in \Figrefsite. The most attractive site is on top of the center of a hexagon, and the least attractive sites are both on top of a carbon atom or on top of a bridge. The corrugation is 56.7 K for Kr and 54.9 K for Ar (see \FigrefPot1). These values differ in only 2 K (3%)! The size of the atoms is also quite similar: Kr is only 6 % larger than Ar. However, Kr seems to have the right size to form a commensurate solid on graphene while almost matching the density of the 2D LJ incommensurate solid, hence doubling the energy rewards.
In conclusion, in spite of the approximations done in our simulations, the comparison with other available studies is fairly good. The theoretical predictions of the 2D-LJ critical temperature coincide with our values. The experimental measurements of the critical temperatures agree with our values for Xe, and are 6 % and 11 % lower for Kr and Ar respectively. This trend suggests that the behavior of the 2D monolayer is affected by the presence of the substrate, which is relatively stronger for Ar than for Kr, and less important for Xe.
We look forward to see reports of new measurements for noble gases on graphene and to be able to compare with our results.
Acknowledgment
We thank the financial support provided by the National Science Foundation, Center for Integrated Quantum Materials (CIQM), Grant No. DMR-1231319. We thank the financial support provided by the National Science Foundation, Partnership for Reduced Dimension Materials (PRDM), NSF Grant No. DMR1205608. We thank Milton Cole for his valuable comments on the manuscript.
References
- D’Amico et al. (1990) K. L. D’Amico, J. Bohr, D. E. Moncton, and D. Gibbs, Phys. Rev. B 41, 4368 (1990).
- Larher (1974) Y. Larher, J. Chem. Soc., Faraday Trans. 1 70, 320 (1974).
- Migone et al. (1984) A. D. Migone, Z. R. Li, and M. H. W. Chan, Phys. Rev. Lett. 53, 810 (1984).
- Larher and Gilquin (1979) Y. Larher and B. Gilquin, Phys. Rev. A 20, 1599 (1979).
- Thomy et al. (1981) A. Thomy, X. Duval, and J. Regnier, Surface Science Reports 1, 1 (1981).
- Unguris et al. (1981) J. Unguris, L. Bruch, E. Moog, and M. Webb, Surface Science 109, 522 (1981).
- Taub et al. (1991) H. Taub, G. Torzo, H. Lauter, and S. F. Jr., Phase transitions in surface films 2 (Plenum Press, New York, 1991).
- Ramseyer et al. (1994) C. Ramseyer, C. Girardet, P. Zeppenfeld, J. Goerge, M. Büchel, and G. Comsa, Surface Science 313, 251 (1994).
- Jaubert et al. (1981) M. Jaubert, A. Glachant, M. Bienfait, and G. Boato, Phys. Rev. Lett. 46, 1679 (1981).
- Bruch et al. (2007) L. Bruch, M. Cole, and E. Zaremba, Physical adsorption: forces and phenomena (Dover Publications, Mineola, 2007) Chap. 6.
- Bruch et al. (2010) L. W. Bruch, M. W. Cole, and H.-Y. Kim, Journal of Physics: Condensed Matter 22, 304001 (2010).
- Happacher et al. (2013) J. Happacher, P. Corboz, M. Boninsegni, and L. Pollet, Phys. Rev. B 87, 094514 (2013).
- Gordillo and Boronat (2009) M. C. Gordillo and J. Boronat, Phys. Rev. Lett. 102, 085303 (2009).
- Kwon and Ceperley (2012) Y. Kwon and D. M. Ceperley, Phys. Rev. B 85, 224501 (2012).
- Kim et al. (2011) H.-Y. Kim, M. W. Cole, M. Mbaye, and S. M. Gatica, The Journal of Physical Chemistry A 115, 7249 (2011), pMID: 21434679, http://dx.doi.org/10.1021/jp200410y .
- Mbaye et al. (2016) M. T. Mbaye, S. M. Maiga, and S. M. Gatica, Journal of Low Temperature Physics , 1 (2016).
- Frenkel and Smit (2001) D. Frenkel and B. Smit, Understanding molecular simulation: from algorithms to applications, Vol. 1 (Academic press, 2001).
- Calbi et al. (2008) M. Calbi, M. Cole, S. Gatica, M. Bojan, and J. K. Johnson, Adsorption by Carbons, edited by E. Bottani and J. Tascon (Elsevier Science, Amsterdam, 2008) Chap. 9.
- Calbi et al. (2001) M. Calbi, M. Cole, S. Gatica, M. Bojan, and G. Stan, Rev. Mod. Phys. 73, 857 (2001).
- Gatica et al. (2001) S. Gatica, M. Bojan, G. Stan, and M. Cole, The Journal of Chemical Physics 114, 3765 (2001).
- Carlos and Cole (1980) W. E. Carlos and M. W. Cole, Surface Science 91, 339 (1980).
- Stan et al. (2000) G. Stan, M. Bojan, S. Curtarolo, S. Gatica, and M. Cole, Phys. Rev. B 62, 2173 (2000).
- Scoles (1990) G. Scoles, International Journal of Quantum Chemistry 38, 475 (1990).
- Smit and Frenkel (1991) B. Smit and D. Frenkel, The Journal of Chemical Physics 94, 5663 (1991).