Double vibronic process in the quantum spin ice candidate Tb2Ti2O7 revealed by terahertz spectroscopy
Abstract
The origin of quantum fluctuations responsible for the spin liquid state in Tb2Ti2O7 has remained a long standing problem. By synchrotron-based terahertz measurements, we show evidence of strong coupling between the magnetic and lattice degrees of freedom that provides a path to the quantum melting process. As revealed by hybrid crystal electric field-phonon excitations that appear at 0.67 THz below 200 K, and around 0.42 THz below 50 K, the double vibronic process is unique for Tb3+ in the titanate family due to adequate energy matching and strong quadrupolar moments. The results suggest that lattice motion can indeed be the driving force behind spin flips within the hybridized ground and first excited states, promoting quantum terms in the effective Hamiltonian that describes Tb2Ti2O7.
.
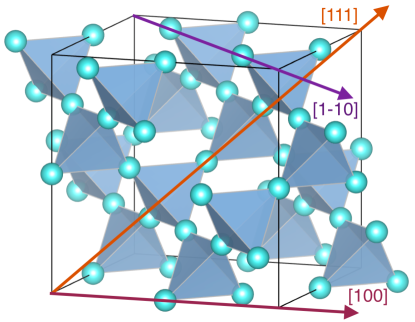
Over the last decade, spin-ice physics has aroused significant attention Lhuillier11 ; Gingras10 . It emerges in pyrochlore magnets, such as Ho2Ti2O7 or Dy2Ti2O7, as a result of effective ferromagnetic interactions coupling the Ising-like rare-earth magnetic moments constrained along the local directions by the crystal field Harris97 ; Ramirez99 ; Denhertog00 (Fig. 1 (a,b)). This combination impedes long-range order, favoring a disordered and macroscopically degenerate magnetic state governed by an organizing principle, the so-called “ice rule," where two spins point into and two out of each elementary tetrahedron in the structure Harris97 .
The possibility that quantum fluctuations can melt the spin ice state is a topical issue. It is expected to lead to a wealth of exotic phenomena such as a quantum superposition of “two-in two-out” configurations and emergent electrodynamics with new deconfined particles Balents04 ; Onoda11 ; Savary12 ; Shannon12 ; Sungbin12 ; Gingras14 .
In this context, the puzzling behavior of the spin liquid Tb2Ti2O7 has attracted much attention. Despite effective antiferromagnetic interactions, Tb2Ti2O7 features no long-range order Gardner99 ; Gingras00 , however short-range correlations are present over a broad temperature range Fritsch14 ; Kermarrec15 ; Guitteny15 . Remarkably, the ground state supports elastic power law spin correlations Fennell12 ; Petit12 , bearing some resemblance to the pinch point pattern observed in spin ices Fennell09 . Below 300 mK, a dispersing low-energy collective mode is found to emerge from these pinch points, reaching its maximum energy at 0.25 meV Guitteny13 . This signal likely corresponds to fluctuations between the two electronic states of the crystal electric field (CEF) ground state doublet. It was interpreted as a signature of interactions between quadrupoles, highlighting the importance of those degrees of freedom Petit12 ; Curnoe2008 ; Guitteny13 ; Takatsu-prl-16 . This is because the non-Kramers nature of Tb3+ ions prevents magnetic exchange alone from inducing such fluctuations within the Ising-like ground state Mueller1968 ; Curnoe2008 ; Bonville11 .
A property that distinguishes Tb2Ti2O7 from the other rare-earth titanates is the CEF energy spectrum of Tb3+. It features a first excited doublet at a low energy of meV above the ground state Cao09 ; Zhang14 ; Princep15 ; Ruminy2016_2 ; Lummen08 , compared to 25 meV for Ho3+ in the prototype spin ice compound. Furthermore, below 20 K, this excited doublet has been shown to couple to a transverse acoustic phonon, forming a hybrid magneto-elastic excitation Fennell14 . It was proposed that a magneto-elastic coupling, linear in the phonon displacement and in the quadrupolar electronic moments, could explain the peculiar ground state of Tb2Ti2O7. To confirm this hypothesis, it is important to show that this magneto-elastic coupling not only occurs for the excited CEF doublet, but also with the ground doublet.
In this article, we provide evidence for such a coupling using terahertz (THz) spectroscopy, which probes the Brillouin zone center in the energy range close to . Our synchrotron-based experiments, performed with an unprecedented accuracy, show a splitting of both the ground and first excited doublets that occurs by coupling with the acoustic phonon at temperatures as high as 50 K. This confirms that the actual ground state of Tb2Ti2O7 has a mixed magnetic and phononic nature. Moreover, we show that this low temperature vibronic process is not alone. A second process is observed as high as 200 K and couples the first excited CEF state and associated transition at with a silent optical phonon mode. This double vibronic process provides a natural path for spin-lattice quadrupolar coupling that amplifies transverse contributions on top of the Ising anisotropy.
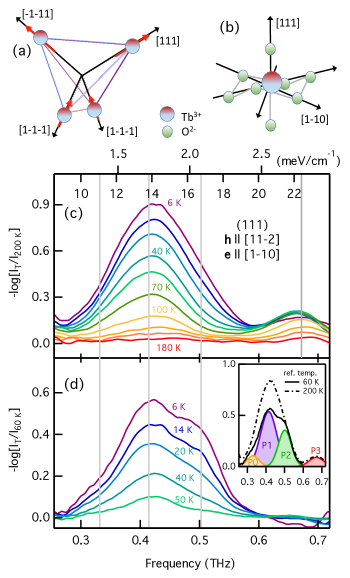
The measurements were performed using a Tb2Ti2O7 single crystal grown by the floating zone technique previously described in Petit12 ; Guitteny13 . We have measured the polarization dependent THz spectrum in the 0.2–1.0 THz (0.82–4.14 meV) energy range using both standard (SSR) Chaix13 and coherent synchrotron radiation (CSR) Barros13 ; Barros15 techniques. Focus is given to the “high temperature” regime, from 300 K to 6 K. Four plaquettes, 2 mm in diameter, were chosen to test the magnetoelectric activity of the excited modes according to the main cubic symmetry axes. Specifically, the (100) wafer (1 mm thick) is perpendicular to the four-fold axis while the (111) wafer (300 m thick) is perpendicular to the three-fold axis. To probe the local rare earth symmetry with an Ising direction along , two additional wafers (10), and (11) (300 m thick) are used allowing three mutually orthogonal planes: (111), (10), and (11). Note then, that the projection of the polarized THz field in the local frame is mixed between the 4 Tb3+ sites of each tetrahedron (See Supplemental Material supmat ).
Typical spectra are given in Fig. 1(c) with a 200 K reference. As the temperature is lowered down to 6 K, an absorption peak develops around 0.42 THz (1.7 meV). This feature is consistent with the first excited CEF level previously reported by neutron and optical spectroscopic studies Cao09 ; Zhang14 ; Princep15 ; Ruminy2016_2 ; Lummen08 . A much weaker and so far unreported peak is visible at 0.67 THz (2.78 meV). Previous experimental studies suggest that the low-temperature magnetic correlations first begin to develop below 100 K with short-range correlations strengthening below 20 K Gardner99 ; Gardner01 . We therefore analyze this temperature regime using the spectrum at 60 K (Fig. 1(d)) as a reference. Noticeably, in Fig. 1(d) the peak at 0.67 THz (2.78 meV) is not present indicating that its strength and energy position do not change significantly over this temperature range and its contribution is divided out along with the background. At the same time, close inspection reveals a three peak structure within the CEF excitation. The four observed peaks, with 200 K and 60 K references, are fit by Gaussian profiles shown in the inset of Fig. 1(d) designated P0, P1, P2 and P3. Their energy position and normalized total area are shown in Fig. 2. No significant temperature shifts are observed for their energy position except for a slight hardening below 20 K for P3 and above 100 K for P1. The precise fitted peak energies at 6 K are E0 = 0.332(4) THz (1.37(2) meV), E1 = 0.415(6) THz (1.71(2) meV), E2 = 0.502(9) THz (2.08(3) meV), and E3 = 0.672(6) THz (2.78(3) meV). P0, P1 and P2 mainly appear below 50 K, while P3 appears at the much higher temperature of 200 K, indicating a different origin.
It is tempting to assign the three peak structure (P0-P2) to a splitting of the ground and first excited CEF levels, that share the symmetry. The resulting four level scheme will give rise to the 3 observed excitations if the central peak (P1) corresponds to two different transitions of the same energy (see Fig. 3 (a)) within our experimental precision. The splitting is then similar for both the ground state doublet and the first excited doublet at a value of 0.085 THz (0.35 meV). Such a splitting corresponds very nicely in energy with the collective mode measured by neutron scattering at a much lower temperature (50 mK) Guitteny13 . It should be emphasized that it is experimentally impossible to assign the entire four peak spectrum to transitions between the two doublets with different splittings supmat .
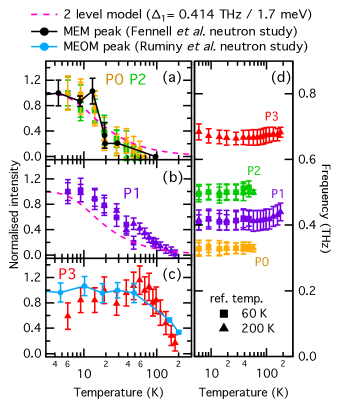
The temperature profile for the outer peaks (P0 and P2) is modeled by a two-level system with an energy barrier of 0.42 THz ( 1.7 meV). It bears similarity to the temperature dependence of the magneto-elastic mode (MEM) measured by Fennell et al. using inelastic neutron scattering Fennell14 ; Guitteny13 . This MEM has been shown to arise from hybridization between the acoustic phonon and first excited CEF level taking on a magneto-elastic component. A zone center extrapolation of the scattering vector dependent neutron data is in good agreement with the energy of P2 at 0.50 THz (2.08 meV). Since the acoustic phonon branch must also cross the CEF ground state at the zone center, hybridization with the ground state is also expected due to its identical symmetry. This is exactly what we observe, with similar splitting for both the ground and first excited states. This suggests that the collective mode built on the basis of the states in the ground doublet already incorporates lattice degrees of freedom as does the first excited CEF state. Similar vibronic phonon-CEF interactions have also been shown for CeAl2 and facilitate mixing between the ground and first excited CEF states Thalmeier84 .
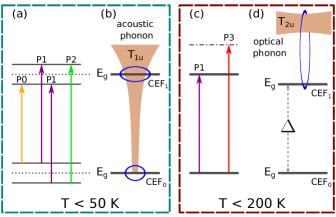
In Tb2Ti2O7, the hybridization process between the two CEF levels and the acoustic phonon depicted in Fig. 3 (b) is not alone. A recent report by Ruminy et al. Ruminy2016_2 suggests that other hybridized magneto-elastic optical mode (MEOM) excitations occur at much higher energies around 3.9 THz (16 meV) due to the proximity of optical phonons. Their work is corroborated by a complementary study focused on the phonon spectrum in these compounds Ruminy2016_3 . Noticeably, their ab inito calculations show that the lowest-energy phonon is at 1.1 THz (4.6 mev) and has symmetry. This phonon is optically silent (both in Raman and infrared (IR) spectroscopy), and it is not observed by inelastic neutron scattering because of a negligible scattering cross section. Since it is quite close in energy to the additional P3 excitation that occurs below 200 K at 0.67 THz (2.78 meV), we assign P3 to a coupling mechanism between this phonon and the first excited CEF level. It is worth noting that this optical phonon branch does not cross the ground state, and therefore is not coupled to it.
Using infrared reflection measurements, we have checked that the 7 expected IR active phonon modes are present in the range 80–800 cm-1 (2.4–24 THz) supmat . The observed phonon energies reveal a discrepancy in comparison to the calculated values which suggests that the lowest-energy phonon may indeed be even closer to the first excited CEF level.
Therefore, two different vibronic processes must occur in Tb2Ti2O7 at two different temperature scales. A diagram of the two coupling mechanisms and corresponding level scheme is depicted in Fig. 3. The high-temperature vibronic process involves the first excited CEF and the lowest energy optical phonon. The resulting hybridization develops below 200 K as seen with the appearance of peak P3 at an intermediate energy between the CEF level and the phonon energy. This coupling mechanism transfers magnetic THz activity to an otherwise silent phonon. The low temperature vibronic process occurs when magnetic fluctuations set in below 50 K. It involves the ground and first excited CEF levels, which both have symmetry, and the acoustic phonon. It results in the splitting of both the ground and first excited doublets which acquire a mixed electronic-phononic character.
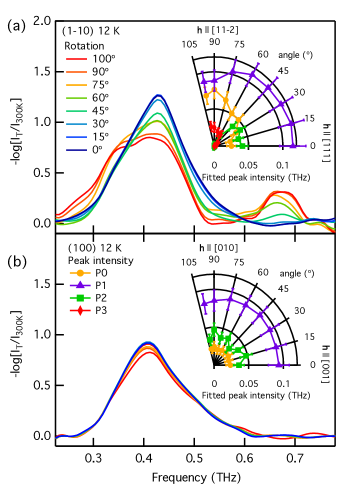
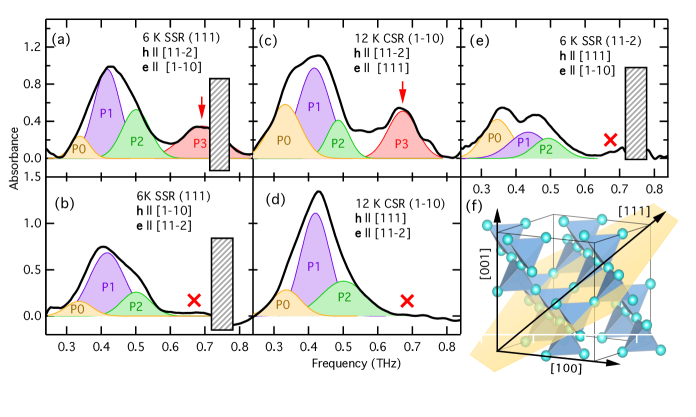
Additional valuable information about these CEF-phonon processes is obtained by the selection rules observed for each excitation and their angular dependence when the polarization of the THz electric () and magnetic () fields is rotated. We first confirm that the hybridized features (P2 and P3) are mainly of magnetic origin. When measuring two configurations with the same direction for but 90 degrees rotation for , the same features are present supmat . Using a rotative sample mount, we were then able to precisely measure the angular dependence of the spectrum for a rotation about the [100] fourfold and two fold axes of the cubic structure (Fig. 4). Note that the [100] axis has no particular meaning in the rare earth site symmetry while the direction corresponds to a two fold axis for two sites out of four on each tetrahedron supmat . Around [100], the spectrum remains unchanged as expected. In contrast, around , a strong anisotropy appears for all peaks except P1. P2 has a maximum intensity for , while both P0 and P3 behave inversely with maximum intensities when . There is also a transfer of spectral weight between P2 and P3 showing that the two vibronic processes are not independent.
This double vibronic mechanism accounts for a mixing between electronic states and propagating phonon modes, which occur in crystals when the excitations are of the same symmetry and are close enough in energy supmat . The transverse components of the acoustic T1u phonon fulfill the symmetry requirements for both the ground and first excited CEF states and their coupling may induce a splitting of these doublet levels. As for the silent optical T2u phonon, its longitudinal component is also allowed to couple to the CEF states inducing no splitting but a shift in the CEF level. This optical phonon is close in energy to the first excited CEF doublet and will dominantly form vibrons with it at high temperature. Its dispersion can be reasonably assumed to be flatter than that of the acoustic phonon leading to a larger density of states. At lower temperatures, this vibronic process should weaken owing to thermal depopulation. The remaining acoustic-phonon vibronic process will then gradually take hold. While P3 is still present at 6 K, this process appears evident in Fig. 2 (c) with a slight reduction in the intensity of P3 at the lowest temperatures.
Importantly, the double vibronic process involves quadrupolar operators which behave as spin flip operators in the ground state doublet basis. As a result, phonons (and lattice zero point motions) are now the source of spin fluctuations and by their virtual exchange may give rise to new quantum terms in the effective Hamiltonian of Tb2Ti2O7. Depending on their strength, a long-range quadrupolar order or Coulomb-phase–like state might be stabilized, provided the Ising term dominates Takatsu-prl-16 ; Onoda11 ; Sungbin12 . Furthermore, an interesting feature of the vibronic process is that the acoustic phonon crosses the two doublets, which themselves being close in energy, will also partially mix. We anticipate that the magnetic dipolar operators will then behave as spin flip operators in the basis of the dressed electronic states. This mechanism, already proposed in Ref Molavian07 , could be the source of additional fluctuations. It may also be present in Tb2Sn2O7 but is not allowed in Ho2Ti2O7 and Dy2Ti2O7: Although the symmetries of both phonons and CEF states are identical, the energy of the first CEF state is one order of magnitude larger, reducing the vibronic process solely to the ground state. More importantly, the quadrupolar matrix elements in the basis of the ground electronic states are essentially zero for Ho3+ and Dy3+.
In summary, using synchrotron-based THz spectroscopy, we show that two temperature regimes are present in the spin ice candidate Tb2Ti2O7 revealing two different vibronic processes. The first one, below 50 K, concerns the ground and first excited CEF levels which couple to the acoustic phonon. This is the temperature scale of magnetic fluctuations Gardner99 as well as elastic softening Nakanishi11 . The second regime, below 200 K, is associated with the coupling between the first CEF level and the lowest energy optical phonon of symmetry and is in agreement with the high temperature plateau observed in the muon spin relaxation rate Gardner99 for this compound. This double vibronic process, of quadrupolar origin, affects the electronic state that can no longer be described solely by electronic wave functions. Rather, a collective vibronic state prevails, built on the ground and first excited CEF states mixed with two different phonons. It is activated with dramatic effects in Tb2Ti2O7 by virtue of adequate energy matching and strong quadrupolar moments that occur in this compound. This unique combination of vibronic processes revealed by our THz study supports the formation of the Tb2Ti2O7 quantum spin liquid state; it may also provide a broadly applicable model in the formation of other exotic quantum ground states.
I Acknowledgements
This work was supported by the French ANR Project No. ANR-13-BS04-0013-01. We thank J. Debray for sample preparation and F. Lévy-Bertrand for assistance with infrared measurements.
References
- (1) C. Lhuillier and G. Misguich, in Introduction to frustrated magnetism, Eds. C. Lacroix, Ph. Mendels and F. Mila (Springer 2011).
- (2) J. S. Gardner, M. J. P. Gingras and J. E. Greedan, Rev. Mod. Phys. 82, 53 (2010).
- (3) M. J. Harris, S. T. Bramwell, D. F. McMorrow, T. Zeiske and K. W. Godfrey, Phys. Rev. Lett. 79, 2554 (1997).
- (4) A. P. Ramirez, A. Hayashi, R. J. Cava, R. Siddharthan and B. S. Shastry, Nature 399, 333 (1999).
- (5) B. C. den Hertog and M. J. P. Gingras, Phys. Rev. Lett. 84, 3430 (2000).
- (6) M. Hermele, M. P. A. Fisher and L. Balents, Phys. Rev. B 69, 064404 (2004).
- (7) S. Onoda and Y. Tanaka, Phys. Rev. Lett. 105, 047201, (2010); S. Onoda and Y. Tanaka, Phys. Rev. B 83, 094411 (2011).
- (8) L. Savary and L. Balents, Phys. Rev. Lett. 108, 037202 (2012).
- (9) O. Benton, O. Sikora and N. Shannon, Phys. Rev. B 86, 075154 (2012).
- (10) S.B. Lee, S. Onoda, and L. Balents, Phys. Rev. B 86, 104412 (2012).
- (11) M. J. P. Gingras and P. A. McClarty, Rep. Prog. Phys. 77, 056501 (2014).
- (12) J. S. Gardner, S. R. Dunsiger, B. D. Gaulin, M. J. P. Gingras, J. E. Greedan, R. F. Kiefl, M. D. Lumsden, W. A. MacFarlane, N. P. Raju, J. E. Sonier, I. Swainson and Z. Tun, Phys. Rev. Lett. 82, 1012 (1999).
- (13) M. J. P. Gingras, B. C. den Hertog, M. Faucher, J. S. Gardner, S. R. Dunsiger, L. J. Chang, B. D. Gaulin, N. P. Raju and J. E. Greedan, Phys. Rev. B 62, 6496 (2000).
- (14) K. Fritsch, E. Kermarrec, K. A. Ross, Y. Qiu, J. R. D. Copley, D. Pomaranski, J. B. Kycia, H. A. Dabkowska, and B. D. Gaulin, Phys. Rev. B 90, 014429 (2014).
- (15) E. Kermarrec, D. D. Maharaj, J. Gaudet, K. Fritsch, D. Pomaranski, J. B. Kycia, Y. Qiu, J. R. D. Copley, M. M. P. Couchman, A. O. R. Morningstar, H. A. Dabkowska, and B. D. Gaulin, Phys. Rev. B 92, 245114 (2015).
- (16) S. Guitteny, I. Mirebeau, P. Dalmas de Réotier, C. V. Colin, P. Bonville, F. Porcher, B. Grenier, C. Decorse, and S. Petit, Phys. Rev. B 92, 144412 (2015).
- (17) T. Fennell, M. Kenzelmann, B. Roessli, M. K. Haas, and R. J. Cava, Phys. Rev. Lett. 109, 017201 (2012).
- (18) S. Petit, P. Bonville, J. Robert, C. Decorse and I. Mirebeau, Phys. Rev. B 86, 174403 (2012).
- (19) T. Fennell, P. P. Deen, A. R. Wildes, K. Schmalzl, D. Prabhakaran, A. T. Boothroyd, R. J. Aldus, D. F. McMorrow, S. T. Bramwell, Science 326, 415 (2009).
- (20) S. Guitteny, J. Robert, P. Bonville, J. Ollivier, C. Decorse, P. Steffens, M. Boehm, H. Mutka, I. Mirebeau, and S. Petit, Phys. Rev. Lett. 111, 087201 (2013).
- (21) H. Takatsu, S. Onoda, S. Kittaka, A. Kasahara, Y. Kono, T. Sakakibara, Y. Kato, B. Fak, J. Ollivier, J.W. Lynn, T. Taniguchi, M. Wakita and H. Kadowaki, Phys. Rev. Lett. 116, 217201 (2016).
- (22) S. H. Curnoe, Phys. Rev. B 78, 094418 (2008).
- (23) K. A. Mueller, Phys. Rev. 171 350 (1968).
- (24) P. Bonville, I. Mirebeau, A. Gukasov, S. Petit, J. Robert, Phys. Rev. B 84, 184409 (2011).
- (25) T. T. A. Lummen, I. P. Handayani, M. C. Donker, D. Fausti, G. Dhalenne, P. Berthet, A. Revcolevschi, and P. H. M. van Loosdrecht, Phys. Rev. B 77, 214310 (2008).
- (26) H. Cao, A. Gukasov, I. Mirebeau, P. Bonville, C. Decorse and G. Dhalenne, Phys. Rev. Lett. 103, 056402 (2009).
- (27) J. Zhang, K. Fritsch, Z. Hao, B. V. Bagheri, M. J. P. Gingras, G. E. Granroth, P. Jiramongkolchai, R. J. Cava, and B. D. Gaulin, Phys. Rev. B 89, 134410 (2014).
- (28) A. J. Princep, H. C. Walker, D. T. Adroja, D. Prabhakaran and A. T. Boothroyd, Phys. Rev. B 91, 224430 (2015).
- (29) M. Ruminy, E. Pomjakushina, K. Iida, K. Kamazawa, D. T. Adroja, U. Stuhr and T. Fennell, Phys. Rev. B 94, 024430 (2016).
- (30) T. Fennell, M. Kenzelmann, B. Roessli, H. Mutka, J. Ollivier, M. Ruminy, U. Stuhr, O. Zaharko, L. Bovo, A. Cervellino, M. K. Haas and R. J. Cava, Phys. Rev. Lett. 112, 017203 (2014).
- (31) L. Chaix, S. de Brion, F. Lévy-Bertrand, V. Simonet, R. Ballou, B. Canals, P. Lejay, J. B. Brubach, G. Creff, F. Willaert, P. Roy and A. Cano, Phys. Rev. Lett. 110, 157208 (2013).
- (32) J. Barros, C. Evain, E. Roussel, L. Manceron, J. B. Brubach, M. A. Tordeux, M. E. Couprie, S. Bielawski, C. Szwaj, M. Labat and P. Roy, J. Mol. Spectrosc. 315 3–9 (2015).
- (33) J. Barros, C. Evain, L. Manceron, J. B. Brubach, M. A. Tordeux, P. Brunelle, L. S. Nadolski, A. Loulergue, M. E. Couprie, S. Bielawski, C. Szwaj, and P. Roy, Rev. Sci. Instrum. 84, 3 (2013).
- (34) See Supplemental Material for additional information on: Geometry of Tb2Ti2O7 crystal, CEF-phonon coupling symmetry, CEF doublet transitions, detailed experimental methods and far-infrared phonon spectra.
- (35) J. S. Gardner, B. D. Gaulin, A. J. Berlinsky, P. Waldron, S. R. Dunsiger, N. P. Raju and J. E. Greedan, Phys. Rev. B 64, 224416 (2001).
- (36) M. Ruminy, M. N. Valdez, B. Wehinger, A. Bosak, D. T. Adroja, U. Stuhr, K. Iida, K. Kamazawa, E. Pomjakushina, D. Prabakharan, M. K. Haas, L. Bovo, D. Sheptyakov, A. Cervellino, R. J. Cava, M. Kenzelmann, N. A. Spaldin, and T Fennell, Phys. Rev. B 93, 214308 (2016).
- (37) P. Thalmeier, J. Phys. C: Solid State Phys. 17, 4153–4177 (1984).
- (38) H. R. Molavian, M. J. P. Gingras, and B. Canals, Phys. Rev Lett 98, 157204 (2007).
- (39) Y. Nakanishi, T. Kumagai, M. Yoshizawa, K. Matsuhira, S. Takagi and Z. Hiroi, Phys. Rev. B. 83, 184434 (2011).
II Supplementary Material
II.1 Geometry of the rare earth stacking
Tb2Ti2O7 crystallizes in the pyrhochlore structure with space group . The Tb3+ ions are the only ones carrying a magnetic moment and occupy the 16d site with local symmetry described by the point group , symbolised in the notation of Schoenflies. The network of apex-connected tetrahedra they form is generated from the Tb3+ ions of a single tetrahedron by applying translations of the face centered cubic lattice (Fig. S5). In each of the four lattices the local 3-fold axis coincides with one of the four diagonals of the cubic cell. There are three local 2-fold axes perpendicular to each 3-fold axis that coincide with three face diagonals of the cubic lattice. Each 2-fold axis is perpendicular to two 3-fold axes. Calling the z-axis the appropriate cube diagonal and the x-axis one of the 2-fold axes perpendicular to it, we define a local frame on which the THz electric and magnetic field components can be projected. The interrelation between the four local frames and the global cubic frame are provided in table T1.
| Local axes | Tb 1 | Tb 2 | Tb 3 | Tb 4 |
|---|---|---|---|---|
| [100] | ||||
| [001] | ||||
II.2 Crystal electric field - phonon coupling
The CEF spectrum of each Tb3+ ion is protected from splitting and mixing by the symmetry of its charge environment. When the crystal vibrations are taken into account, the positions of the surrounding ions change in time and the cage they form about the Tb3+ ion is dynamically deformed. This results in symmetry breaking of their electrostatic interactions. The latter can be expanded over the spherical harmonics () on the electrons angular variables most generally in the form , where is the th electron radial variable and stands for the contribution associated with the surrounding ion . The expansion complies with the symmetry if and only if it involves invariants belonging to the trivial representation of the point group , in which case it leads to the CEF Hamiltonian:
| (1) |
where accounts for the contribution of all the surrounding charges, is the expectation value of over the radial part of the f-electron wave function and are the Wybourne operators. The oscillations of the ions modify the coefficients . This can be accounted for by the expansion provided that the displacement of the surrounding ion from its equilibrium positions relatively to the Tb3+ ion is small enough. A single ion magnetoelastic interaction Hamiltonian then emerges to first order. Non linear displacement effects and cooperative multi-ion magnetoelastic interactions occurring at the higher orders will be ignored. will involve Wybourne operators that are not present in whenever is symmetry breaking. In order to find these operators it proves convenient to describe the linear displacements by normal modes that transform according to the parity odd irreducible representations of the point group and take advantage of the orthogonality properties of the irreducible representations to write the single ion magnetoelastic interaction Hamiltonian in the form:
| (2) |
where is the magnetoelastic coefficient associated with the normal mode and () the creation (annihilation) operator of a phonon in this mode. distinguishes the different modes within a multidimensional . is a linear combination of the Wybourne operators that are allowed to couple to lattice vibrations. To determine them, we look at symmetry consideration including spatial parity conservation. is a linear combination of the components of . It is therefore parity odd since the quantity is parity even as a scalar quantity. Accordingly, the invariants must belong to the parity even irreducible representations of the point group whose character is the same as the one of on the group elements that are not combined with the space inversion and opposite otherwise. With the magnetoelastic coupling energy for displacements in the range is numerically estimated in the order of meV for , in the order of meV for and in the order of meV for . It follows that all the Wybourne operators other than the quadrupolar ones () can be ignored in a first approximation. These quadrupolar operators transform according to the irreducible representation of the rotation group associated with the angular momentum . The subduction to the group of is reduced into . An inspection of the invariants reported in table T2 then informs us that the phonon modes belonging to the irreducible representation can couple to the CEF states through the quadrupolar Wybourne operators . Within the ground multiplet this transposes itself to possible coupling of the phonon modes with CEF states through the quadrupolar Stevens operators:
The only other possible coupling is with the phonon mode belonging to the irreducible representation through the quadrupolar Weybourne operator which transposes to the Stevens operator in the ground multiplet :
The acoustic phonons at the Brillouin zone centre in Tb2Ti2O7 belong to the irreducible representation of the factor group . Its subduction to the point group is reduced into , meaning that the triply degenerate acoustic modes separate themselves into a non degenerate longitudinal mode () and doubly degenerate transverse modes () with respect to the local 3-fold axis. These transverse acoustic phonon modes are those that might induce the splitting and the mixing of the ground and first excited CEF doublets that are separated only by about meV. In the subspace of these two doublets the single ion magnetoelastic interaction Hamiltonian takes the form
| (3) |
where (resp. ) are two orthogonal states of the ground (resp. excited) doublet. The 3-fold symmetry implies that they must expand on the basis of the multiplet states in the form whereas the 2-fold symmetry transforms this into . The two states are parallel if (modulo 3), thus forming a singlet, and orthogonal otherwise, forming a doublet. It follows that:
with to achieve orthogonality of the various states. The oscillator strengths in eq.3 are then evaluated to:
Accordingly, the coupling of the transverse phonons to the CEF doublets can occur through both the quadrupolar operators and with oscillator strengths depending on the actual structure of the doublet states, that is, on the parameters . Using numerical values published in the literature for the coefficients Mirebeau07 , one observes that the strongest coupling comes from the quadrupoles. Interestingly, the same numerical calculations performed for Ho2Ti2O7 show that those quadrupolar matrix elements are essentially zero. This is also the case for Dy2Ti2O7 when generalizing the above analysis to Kramers ions.
In Tb2Ti2O7, an optical phonon is also suspected to exist at energy close to the first CEF excited doublet, which would belong to the irreducible representation of the factor group (silent in both IR and Raman spectroscopy). Its subduction to the point group is reduced into , meaning again that the associated triply degenerate phonon modes give rise to a singlet (), the longitudinal mode, and a doublet (), the transverse modes. These transverse modes can couple to the first CEF excited doublet with similar oscillator strengths as calculated above resulting in the splitting of the CEF excited state. The longitudinal mode can also couple to the first CEF state through the quadrupolar operator . No splitting will result but a shift in energy will occur. This is most likely the process that it activated below 200 K in Tb2Ti2O7.
| 1 | 1 | 1 | 1 | 1 | 1 | |||
| 1 | -1 | 1 | 1 | -1 | 1 | |||
| 2 | 0 | -1 | 2 | 0 | -1 | |||
| 1 | 1 | 1 | -1 | -1 | -1 | |||
| 1 | -1 | 1 | -1 | 1 | -1 | |||
| 2 | 0 | -1 | -2 | 0 | 1 |
II.3 Crystal electric field transitions
Considering a splitting of the ground and first excited CEF doublets, we can expect four possible transitions as seen in Fig. S6. In the main article, we assign three of the observed peaks (P0, P1 and P2) within this transition scheme. P0 corresponds to transition (1), P1 to transitions (2) and (3), and P2 is (4). P3 does not fit into the scheme and is therefore described by the coupling mechanism. However, this proposed scheme requires that the difference in energy splitting of each doublet is equivalent (). In such a case, transitions (2) and (3) will have the same energy difference and therefore appear as one peak. If we assume different energy splittings (), then it should be possible to observe the four distinct transitions. We may then expect that the four peaks observed in the main article correspond to the four transitions here. While the different temperature profiles of peaks P0, P1 and P2 compared to P3 is a strong indication that P3 does not fit into this scheme, here we show arithmetically that such a four peak scheme is unlikely given their observed energies.
First we define . Then the largest transition (4) is . If we take the highest energy peak P3 = 0.675 THz as this transition, then = 0.675 THz. Now, depending on whether or , the next largest transition will be either (3) or (2) . Assuming the first case, P2 = 0.50 THz corresponds to setting = 0.50 THz. So = 0.175 THz. Now, (2) is the next largest transition and must correspond to P1 = 0.414 THz. So = 0.414 THz. Since we have shown = 0.675 THz, then = (0.675 - 0.414) THz = 0.261 THz. Therefore, transition (1) which is must be (0.50 - 0.261) THz = 0.239 THz which is not consistent with our measurement of P0 = 0.33 THz. The same outcome occurs when considering the case . Therefore, a scheme that attempts to conform the four observed peaks into the four transitions in Fig. S6 cannot reconcile with the energies in our spectra. Furthermore, such a scheme is also inconsistent with previous inelastic neutron scattering studies.

II.4 Detailed experimental methods
II.4.1 Sample details
The single crystal samples used in the experiments were cut from a larger crystal used in a previous neutron study Guitteny2013 . They were then prepared into thin wafers. Each sample was selected with a specific crystallographic face confirmed and orientated by Laue reflected X rays. Three mutually orthogonal planes (111), (10) and (11) were chosen to test the electro/magneto activity of the excited modes. With polarized radiation incident on the (111) plane, the magnetic (h) and electric (e) field components can probe either the (10) or (11) planes. Investigating the (10) cut sample allows h and e field probing of the (111) and (11) planes. In principle, the h field can therefore be aligned with the (11) plane in both cases while the e field probes different planes. In this way, it is possible to isolate the effects of h or e fields on specific planes in the crystal. An example of this is shown in Fig S7 where h is isolated along the [11] direction by comparing polarized spectra of the three orthogonally cut samples. Here, it is clear that the absorption from the P3 mode is strongest when lies in the (11) plane. A final sample cut normal to the low index (100) plane was also selected to compare with any observed spectroscopic anisotropies. The (111), (10) and (11) cut samples had a thickness of 0.2 mm, 0.3 mm and 0.3 mm respectively. The (100) sample had a thickness of 1 mm.
II.4.2 Terahertz synchrotron setup
The THz spectroscopy experiments were performed at the SOLEIL synchrotron in France on the AILES Far-Infrared beamline. Spectra were obtained in the 0.15–1.0 THz (0.62–3.8 meV) energy range with a Brüker IFS125 spectrometer and 1.6 K bolometer using both standard (SSR) and coherent synchrotron radiation (CSR) techniques. In the studied energy range, the THz wave is linearly polarized at more than 95%. For the SSR measurements, a 125 m mylar beam splitter was used to access the low energies required for the experiment. Multiple reflections in the beam splitter produce a spectral minimum at0.75 THz, therefore, for SSR measurements, we omit data at this frequency due to a high noise level. In this configuration, samples were mounted at fixed orientations with respect to the THz polarization on the cold head of an adapted Cryomech PT 405 pulse tube cryostat. The temperature range accessible was 6–300 K. In the CSR configuration, the SOLEIL accelerator was operating in the low- coherent mode, with a parameter of 1/25 CSR_1 ; CSR_2 . Under this operation, a much higher flux of low-energy photons is produced. This facilitated the use of a 50 m mylar beam splitter that removes the spectral minima at 0.75 THz while maintaining strong signal at low energies. In this configuration, samples were mounted on an Attocube ANR240 rotary stage attached to the cold head of the cryostat. The thermalization of the rotary stage limited the base temperature to 12 K. Using the rotary stage, the sample could be rotated through 100∘ with respect to the THz polarization with a precision of 0.1∘. During analysis the data were filtered using a Fourier filtering procedure that removes the 2 cm-1 fringe noise due to multiple reflections in the setup FTIR_filtr .
II.4.3 Far-infrared setup
Far-infrared measurements of the optical phonon spectra were performed in reflection geometry at near normal incidence. The measurements were performed on a Brüker Vertex 70v spectrometer with a mercury discharge-lamp source and 4.2 K bolometer detector. A far-infrared silicon beam-splitter was used, with the measurements covering the 50–900 cm-1 (1.5–27 THz, 6–112 meV) spectral range. The sample was mounted on the cold head of an in-house–adapted Janis flow cryostat reaching temperatures from 6 to 300 K
II.5 Far-infrared phonon spectra
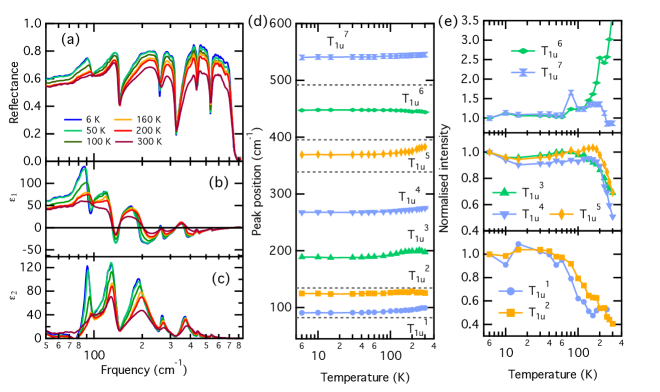
To complement the terahertz spectroscopy provided in the article, we have also performed far-infrared reflectance spectra of the (100) cut sample. Here we aim to analyse the infrared active optical phonon spectra and their temperature dependence to gain insight into the lattice dynamics. The reflectance spectra at selected temperatures from 6–300 K are shown in Fig. S8 (a). Here, a number of Reststrahlen bands are present due to phonon absorption. The stoichiometry of Tb2Ti2O7 tells us that the and ions occupy the 16d and 16c Wyckoff positions while the and ions are at the 48 and 8 positions respectively. Factor group analysis of the point group table revels the allowed normal modes at the zone center, which are given by the following representations BilbaoSAM ,
Of these modes, only the 8 modes are infrared active with one being an acoustic mode. We therefore expect 7 phonon modes to appear in our reflectivity data. Because of the numerous crystal field levels known to be mixed within the phonon spectrum and our symmetry analysis allowing coupling between them, the precise form of the dielectric response is non-trivial. Rather than applying the dispersive method of fitting the reflectivity to a simplified dielectric model (as in the analysis of Bi et al. for Dy2Ti2O7 Bi ), here we analyze the dielectric response by Kramers-Kronig analysis. The real and imaginary components of the dielectric response, determined by a Kramers-Kronig transform of the reflectivity, are shown in Figs. S8 (b) and (c). Peaks in the imaginary response represent absorptions due to phonon excitations. Seven distinct peaks are observed corresponding to the 7 predicted optical modes. No soft modes are present which may have indicated a structural instability or phase transition. Notably, the lowest energy phonons (, and ) in close proximity to the 2nd and 3rd crystal field levels, feature abnormal peak profiles and temperature dependence. Nevertheless, approximate phonon energies and intensities can be extracted by Lorentzian profile fits to the curves. The temperature dependence of the peak positions are shown in Fig. S8 (d), with dashed gray lines representing the neighboring crystal field levels. The normalized phonon intensities, determined by the area of the fitted peaks, are shown in Fig. S8 (e). While the 5 higher energy phonons follow a similar temperature dependence in their intensity profile, strengthening or weakening as the lattice contracts between room temperature and 200 K, the two lower energy modes are distinct. These two modes, which are suspected of interacting with the crystal field levels, feature rapid strengthening between 200 K and 80 K. Notably this is similar to the temperature dependence of P3 from Fig. 4 (c). A summary of the results at base temperature is presented in Table T3.
| Symmetry | This work | Ruminy et al. Ruminy1 | Bi et al. (Dy2Ti2O7) Bi |
|---|---|---|---|
| Phonon | cm-1 | cm-1 | cm-1 |
| 90.9 | 62.1 | 85 | |
| 124.9 | 117.9 | 126 | |
| 189.1 | 176.2 | 197 | |
| 267.8 | 230.2 | 260 | |
| 368.9 | 383.1 | 370 | |
| 447.4 | 452.7 | 454 | |
| 540.3 | 536.8 | 545 |
References
- (1) :
- (2) K. Momma and F. Izumi, J. Appl. Crystallogr. 41, 653–658 (2008).
- (3) I. Mirebeau, P. Bonville, and M. Hennion, Phys. Rev. B 76, 184436 (2007).
- (4) R.S. Mulliken, J. Chem. Phys. 23 1997 (1955)
- (5) S. Guitteny, J. Robert, P. Bonville, J. Ollivier, C. Decorse, P. Steffens, M. Boehm, H. Mutka, I. Mirebeau and S. Petit, Phys. Rev. Lett. 111, 087201 (2013).
- (6) J. Barros, C. Evain, E. Roussel, L. Manceron, J. B. Brubach, M. A. Tordeux, M. E. Couprie, S. Bielawski, C. Szwaj, M. Labat and P. Roy, J. Mol. Spectrosc. 315 3–9 (2015).
- (7) J. Barros, C. Evain, L. Manceron, J. B. Brubach, M. A. Tordeux, P. Brunelle, L. S. Nadolski, A. Loulergue, M. E. Couprie, S. Bielawski, C. Szwaj, and P. Roy, Rev. Sci. Instrum. 84, 3 (2013).
- (8) M. F. Faggin and M. A. Hines, Rev. Sci. Instrum. 75 4547 (2004).
- (9) E. Kroumova, M.I.Aroyo, J.M. Perez-Mato, A. Kirov, C. Capillas, S. Ivantchev and H. Wondratschek, Phase transit. A76, 155 (2003).
- (10) C. Z. Bi, J. Y. Ma, B. R. Zhao, Z. Tang, D. Yin, C. Z. Li, D. Z. Yao, J. Shi, and X. G. Qiu, J. Phys. Condens. Matter 17, 5225 (2005).
- (11) M. Ruminy, M. N. Valdez, B. Wehinger, A. Bosak, D. T. Adroja, U. Stuhr, K. Iida, K. Kamazawa, E. Pomjakushina, D. Prabakharan, M. K. Haas, L. Bovo, D. Sheptyakov, A. Cervellino, R. J. Cava, M. Kenzelmann, N. A. Spaldin, and T Fennell, Phys. Rev. B 93, 214308 (2016).