The Mid-Infrared Evolution of the FU Orionis Disk
Abstract
We present new SOFIA-FORCAST observations obtained in Feburary 2016 of the archetypal outbursting low mass young stellar object FU Orionis, and compare the continuum, solid state, and gas properties with mid-IR data obtained at the same wavelengths in 2004 with Spitzer-IRS. In this study, we conduct the first mid-IR spectroscopic comparison of an FUor over a long time period. Over a 12 year period, UBVR monitoring indicates that FU Orionis has continued its steady decrease in overall brightness by 14%. We find that this decrease in luminosity occurs only at wavelengths 20 m. In particular, the continuum short ward of the silicate emission complex at 10 m exhibits a 12% ( 3) drop in flux density, but no apparent change in slope; both the Spitzer and SOFIA spectra are consistent with a 7200 K blackbody. Additionally, the detection of water absorption is consistent with the Spitzer spectrum. The silicate emission feature at 10 m continues to be consistent with unprocessed grains, unchanged over 12 years. We conclude that either the accretion rate in FU Orionis has decreased by 12-14% over this time baseline, or that the inner disk has cooled, but the accretion disk remains in a superheated state outside of the innermost region.
1 Introduction
The low mass pre-main sequence star FU Orionis (hereafter, FU Ori) brightened by mag in 1936 (Herbig, 1977), and subsequently has declined slowly ( 0.013 mag/yr; Kenyon et al. 2000) to the present day (further examined in this work). This burst in brightness established a class of variable star (FU Orionis objects, or “FUors”; Hartmann & Kenyon 1996; Hartmann 1998) that 10 other stars have since mimicked. Paczynski (1976) first proposed that FUors are the result of a sudden cataclysmic accretion of material from a reservoir that had built up in the circumstellar disk surrounding a young stellar object. In this model, the accretion rate rises from the typical rate for a T Tauri star ( yr-1) up to yr-1, and then decays over an e-fold time of 10-100 yr (Lin & Papaloizou, 1985; Hartmann & Kenyon, 1985; Bell & Lin, 1994). Over the entire outburst the star could accrete 0.01 M⊙ of material, roughly the entire mass of the Minimum Mass Solar Nebula or a typical T Tauri disk (Andrews & Williams, 2005). On average, FUor outbursts should occur (or recur) 5 times per star formed in the local region of the Milky Way (Hartmann & Kenyon, 1996); there have been 10 FUors observed within a distance of 1.5 kpc in the last 80 yr, compared with the star formation rate in the same volume ( 3 per 50 yr). These bursts also modify the protoplanetary disk chemistry and require a very different model than simple magnetospheric accretion (e.g. Green et al., 2006; Quanz et al., 2007; Zhu et al., 2007; Romanova et al., 2009; Cieza et al., 2016), usually invoked for accreting young stars. If FUors represent a short-duration stage that all young stars undergo, then understanding their properties is vital to models of planet formation and the evolution of protoplanetary gas-rich disks.
The luminosity outburst is due to a sudden increase in the rate at which material accretes from the disk onto the star. Models explain the rise in accretion rate with the development of instabilities in the disk, but they differ as to where the instabilities originate. “Inside-out” models are those in which the instability develops at several AU, where the lower temperatures, and therefore lower ionization fraction, render the magneto rotational instability (MRI) as an inefficient accretion mechanism (e.g. Zhu et al., 2009b; Martin et al., 2012). “Outside-in” models are those in which gravitationally bound fragments develop at large radii (tens of AU or more) due to infall from a protostellar envelope, then migrate inward through the disk, ultimately generating an outburst when they accrete onto the star (e.g. Vorobyov & Basu, 2015). A third option that has been posited is an external perturber – the interaction of the disk with an exterior massive object that alters the balance of accretion and triggers the cascading flow (Bonnell & Bastien, 1992), although recent studies suggest the refill rate is too slow to occur on few co-orbit timescales (Green et al., 2016). The wavelength dependence of any post-outburst variability can distinguish among these classes of models.
Dust grain growth, processing, and sedimentation are tracked by mid-infrared (MIR) dust features. Processing and grain growth in the disk can begin as early as the protostellar stage, when the disk is heavily extinguished. Most silicate features around low mass young stars are consistent with both grain growth and high crystallinity fractions (e.g. Watson et al., 2009; Olofsson et al., 2009). Because grains from the ISM enter the disk as amorphous, high crystalline fractions in young stars indicate that dust processing occurs early on. EX Lup, the archetype of a smaller magnitude burst from a T Tauri disk, exhibited crystalline grain production during outburst (Ábrahám et al., 2009), due to enhanced heating. However, these crystalline grains disappeared during quiescence, likely due to X-ray amorphitization of the grains, or dust transport either radially or vertically. In contrast, FUors show no evidence for processed grains during outburst, only grain growth (Quanz et al., 2007). No pre-outburst mid-IR spectra of FUors exist to constrain their historical grain properties, and it may be that the silicate grains are modified during the outburst. For protoplanetary disks, the 10 and 20 m silicate features probe optically thin dust at specific temperatures on the disk surface; as the disk heats and then cools, the radii probed by these features changes accordingly, and may evolve during the burst (e.g. Hubbard & Ebel, 2014). As the disk cools, we might expect additional changes to occur, as grains are recirculated, modified, merged, or destroyed. During an FUor, the temperature at 1 AU may approach 1000 K or even higher; this becomes comparable to the temperature to form crystalline silicates or remove volatiles, which can affect habitable zone planet formation (Hubbard & Ebel, 2014). Further out in the envelope, episodic increases in temperature can cause irreversible chemical processes, such as the observed conversion of mixed CO-CO2 ice into pure CO2 (Kim et al., 2012; Poteet et al., 2013).
Mid-IR spectroscopic variability has been only sparsely examined, although mid-IR evolution during bursts has been modeled (e.g. Bell & Lin, 1994; Zhu et al., 2007; Johnstone et al., 2013). The biggest difference between the mid-IR SED of FU Ori and that of more typical young stellar objects is contribution of the superheated inner disk. The innermost regions of disk are expected to reach temperatures of 6000-8000 K, comparable to the stellar surface but over vastly greater emitting area (the inner radius of the disk; Hartmann & Kenyon 1996; Hartmann 1998). Therefore the innermost disk radii are no longer coupled to any dust, which would be destroyed or ejected out to a significant fraction of an AU, and would not be an opacity source. Thus FU Ori’s SED is dominated at all wavelengths by disk emission, even in the optical/near-IR, and changes at optical/near-IR wavelengths would reflect changes in the superheated disk rather than the central protostar.
FU Ori (D 450-500 pc; Hartmann & Kenyon 1996) is a wide (05) binary system consisting of a outbursting young stellar object modeled as a 0.3 with a 0.04 circumstellar disk (Zhu et al., 2007) at an AV of 1.8 (Zhu et al., 2010), and a more massive young companion (M 0.5 ; Wang et al. 2004; Reipurth & Aspin 2004; Hales et al. 2015). The companion (FU Ori S) is at 227 AU projected separation (Pueyo et al., 2012), at an AV of 10 2 (Pueyo et al., 2012).
In this work, we present new mid-IR photometry and spectroscopy of FU Ori obtained with the Stratospheric Observatory for Infrared Astronomy (SOFIA) in 2016, and compare with previous observations with the Spitzer Space Telescope in 2004. We find that the continuum flux density in at wavelengths shorter than 8 m (arising from the hot inner disk) has decreased by 12-14%, dominating the change in bolometric luminosity. The continuum at wavelengths greater than 10 m has decreased only 7% within uncertainties. Additionally, we find that the H2O vapor absorption resulting from the superheated disk photosphere remains present. Finally, we note no significant changes in the 10 m silicate emission feature, which shows no evidence of crystallinity. Taken together, these observations suggest that the decrease in viscous dissipation energy over this period has occurred predominantly in the innermost section of the disk, which is changing rapidly.
2 Observations
| Obs Mode | AORIDs | Filter | Int(s) | Num | Total(s) |
|---|---|---|---|---|---|
| Im. | 0401461, 040146165 | F056/F253 | 60 | 1 | 184 |
| Im. | 0401462, 041046166 | F077/F315 | 60 | 1 | 184 |
| Im. | 0401463, 040146163 | F111/F348 | 1471 | 1 | 4001 |
| Grism | 04014616 | G063 | 200 | 2 | 5502 |
| Grism | 04014617 | G111 | 3600 | 5 | 92253 |
| Grism | 04014618 | G227 | 1000 | 1 | 2577 |
| IRS Stare | 3569920 | SL/SH/LH | 18 | 1 | – |
Note. — Observations were performed over two different flights, 272 (04 Feb 2016) and 279 (18 Feb 2016).
1 The F111 band was observed in 7 separate integrations; six were 13s on source and one was 69s on source. We report the combined exposure time and approximate overhead.
2 The exposure on Flight 272 exhibited 50% worse S/N than the exposure on Flight 279 and was not used in the final spectrum presented in this work.
3 The two exposures on Flight 272 exhibited 10% higher continuum than the three exposures on Flight 279, further misaligned with photometric measurement, and were not used in the final spectrum presented in this work.
2.1 SOFIA-FORCAST Spectroscopy
We observed FU Ori with the Faint Object infraRed CAmera for the SOFIA Telescope (FORCAST; Herter et al. 2012) onboard the Stratospheric Observatory For Infrared Astronomy (SOFIA; Young et al. 2012) on two separate flights (on 2016 Feb 4 and Feb 18, flights 272 and 279 respectively); see Table 1 for the Observing Log. The observations were performed in “C2N” (2-position chop with nod) mode, using the 47 slit, and the NMC (nod-match-chop) pattern in which the chops and nod are in the same direction and have the same amplitude. In each case, an off-source calibrator was selected from an ensemble of observations from Cycles 2-4, using the observation closest in zenith angle and altitude to the science target (A. Helton, priv. comm.). We did not use dithering. The FORCAST grism was used in three spectral bands G063 ( 5-8 m) G111 ( 9-13 m) and G227 ( 18-25 m) from 5-25 m to achieve a spectral resolving power R 200. The achieved signal-to-noise ratios for the individual grism segments were 30 (G063, measured from 5.7 to 6.3 m), 46 (G111; measured from 11-12 m), and 22 (G227, measured from 21-26 m). The total observation time was 12904 seconds (3.58 hr), including imaging, which totaled approximately 0.33 hr (see below).
The extracted SOFIA-FORCAST spectra are the best calibrated version of the Level 3 pipeline products, as identified in the SOFIA Data Cycle System. The G227 observation appears in only one exposure/AOR, but the G063 was observed on two separate occasions (one on each of two flights), and G111 was observed in five separate exposures to obtain sufficient signal to noise ratio (three exposures on Flight 279 and two exposures on Flight 272). Notes on each individual grism observations follow.
G063. The Flight 279 G063 spectrum shows 50% higher noise than the Flight 272 spectrum, and we decided to exclude the low S/N data; this did not significantly affect the absolute flux density in the G063 band.
G111. However, the two Flight 272 G111 spectra are both 10% higher in flux density than the three Flight 279 spectra, and we excluded the higher flux density G111 spectra from the analysis. Additionally, the G111 spectrum includes several bands dominated by atmospheric ozone. Although the SOFIA pipeline attempts to correct for this using off-positions, the telluric correction cannot reliably remove the ozone feature because the ozone layer is inhomogeneous and the SOFIA beam tracks in and out of higher density regions on timescales shorter than the background removal process. Thus we masked this section of spectrum ( 9.3-10.05 m) and did not consider it in this work.
G227. The G227 spectrum showed the highest overall uncertainty. The spectrum was re-reduced using a custom pipeline (W. Vacca, priv. comm.). A preliminary version of a new asteroid response curve along with a different background region than that used for the original pipeline extraction was applied. The result shifted the G227 spectrum down 7% from the default, in between the three longest wavelength SOFIA photometric bands.
2.2 Spitzer-IRS Spectroscopy
FU Ori was observed by the InfraRed Spectrograph (Houck et al., 2004) onboard the Spitzer Space Telescope (Werner et al., 2004) as part of the IRS_Disks guaranteed time observing program (Houck et al., 2004) on 4 Mar 2004 (Table 1). The observations (AORID 3569920) were performed in Staring Mode, with two nods spaced by one third of the slit width, and off-positions acquired only for the Short-Low (SL; 5.3-14 m, R 60-120) modules. The Short-High (SH; 10-20 m, R 600) and Long-High (LH; 20-38 m; R 600) modules did not include off-positions, and were extracted as full aperture products (Green et al., 2006). To confirm that the IRS spectral reduction was consistent with the most recent calibration, we retrieved the data from the Cornell Atlas of Spitzer IRS Sources (CASSIS LRv7 and HRv1; Lebouteiller et al. 2011, 2015). The spectrum was then scaled to SL, adjusting SH fluxes upward by 2% and LH fluxes downward by 3%. Details on the original data reduction are published in Green et al. (2006) using the SMART package (Higdon et al., 2004).
The absolute calibration uncertainty of Spitzer-IRS is typically as large as 10%. However, the point-to-point (relative) uncertainty is 3%. After cross-calibrating SL with SH and LH as noted above, the absolute flux uncertainty is only the uncertainty in SL, which is 10%; however, the IRAC photometry, which covers the same bands, has an uncertainty floor of only 3% (Carey et al., 2012). Thus we take the final uncertainty in absolute flux calibration for Spitzer to be 3%.
2.3 Photometry
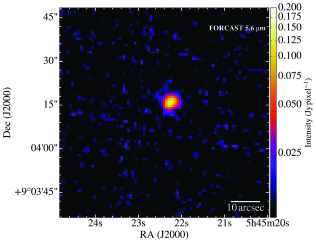
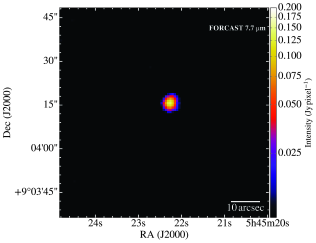
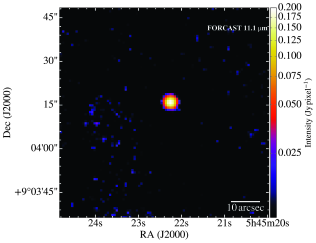
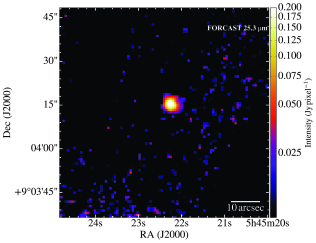
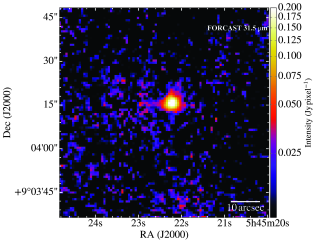
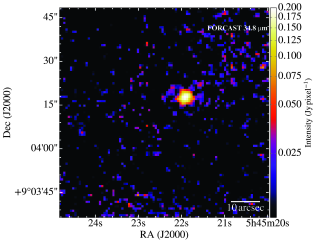
We acquired contemporaneous FORCAST imaging in F056/F253, F077/F315, and F111/F348 in order to calibrate the spectral flux densities, characterize extended emission, and provide 2016 continuum levels from 25-35 m. All imaging observations were acquired during Flight 272. A signal-to-noise ratio of 10 on-source was achieved in exposures of 60 seconds or less in all six bands on each source. The SOFIA-FORCAST photometry was obtained from the Level 3 pipeline data products. The measured image quality of the SOFIA imaging ranges between 27 and 3 for F056, F077, and F111, and ranges between 34 and 36 for F253, F315, and F348; FORCAST only achieves the diffraction limit 34 m due to telescope jitter (SOFIA Observer’s Handbook, Figure 7-2). For consistency, the photometry were extracted uniformly using aperture photometry, in a 10 source annulus with a sky annulus 20-40 away from the source. The F111 photometry is a weighted average of seven observations (one longer exposure was 69s on-source, and the other six short exposures were 13s on-source). The average flux density of the six short exposures is within 1% of the flux density measured from the long exposure. Images for each band are shown in Figure 1.
There also appears to be some structure in the background emission, making the extraction less certain. However, the source appears pointlike in all bands. The absolute flux uncertainty of the level 3 G063 and G227 grism products is 5%, and the G111 product is 10% (Herter et al., 2013). However, all of the photometric flux densities are within 3% of the level 3 spectroscopy. Thus we take the combined uncertainty of the absolute flux calibration between Spitzer and SOFIA (in quadrature) to be 4.2%. The background “structure” in some of the imaging appears significant at first glance; however, the WISE band 4 image (next section) shows no sign of structure. A more detailed extraction of F253 using a flatfield model (J. DeBuizer, priv. comm.) indicated that the background “structure” was due to flatfielding.
2.4 Photometry from Earlier Epochs
In this work we compare photometry close in time to the 2004 IRS observations with those close to the 2016 FORCAST observations (American Association of Variable Star Observers/AAVSO BVR from 2016, and FORCAST imaging from this work). Additional photometry is presented, including UBVR photometry previously presented in Green et al. (2006) (ca. 2004); 2MASS JHK (ca. 1998; Skrutskie et al. 2006); WISE (all four bands; ca. 2010; Cutri & et al. 2013); and Spitzer-IRAC bands 2 and 3 (ca. 2006). The WISE W2 band appears anomalously high (perhaps due to uncertainties related to emission from H2 S(9) at 4.6 m). Due to these uncertainties, we find no convincing detection of background dust emission.
The Spitzer-IRAC photometry was observed but saturated beyond recovery in Band 1 and 4. Band 2 (4.5 m) and 3 (5.8 m) were extracted as Spitzer Enhanced Imaging Products (SEIP111http://irsa.ipac.caltech.edu/data/SPITZER/Enhanced/SEIP/overview.html). We note that the FWHM is 172 (4.5 m) and 188 (5.8 m), as indicated by the IRAC Instrument Handbook (Table 2.1). The SEIP provides two extracted aperture sizes, of diameters 38 and 58. The 58 diameter extraction window is a much better match with the IRS data, although in contrast to the similar wavelength WISE Band 2, the IRAC Band 2 point is low by 20% compared to models (possibly due to partial saturation). We note that if this difference between IRAC (2006) and WISE (2010) were due to intrinsic luminosity changes in the FU Ori disk, we would expect the WISE band to be the lower of the two, but we find the reverse. For these reasons, we exclude both points from the analysis.
| JD | Calendar Date | Mag | Mag | Filter | Observer |
|---|---|---|---|---|---|
| 2453278.46 | 2004 Sep. 29 | 11.697 | 0.04 | U | Ibrahimov |
| 2453280.45 | 2004 Oct. 1 | 11.706 | 0.04 | U | Ibrahimov |
| 2453281.472 | 2004 Oct. 2 | 11.787 | 0.04 | U | Ibrahimov |
| 2453283.481 | 2004 Oct. 4 | 11.788 | 0.04 | U | Ibrahimov |
| 2453284.483 | 2004 Oct. 5 | 11.772 | 0.04 | U | Ibrahimov |
| 2453299.491 | 2004 Oct. 20 | 11.809 | 0.04 | U | Ibrahimov |
| 2453278.46 | 2004 Sep. 29 | 11.015 | 0.02 | B | Ibrahimov |
| 2453280.45 | 2004 Oct. 1 | 10.971 | 0.02 | B | Ibrahimov |
| 2453281.472 | 2004 Oct. 2 | 10.988 | 0.02 | B | Ibrahimov |
| 2453283.481 | 2004 Oct. 4 | 11.031 | 0.02 | B | Ibrahimov |
| 2453284.483 | 2004 Oct. 5 | 11.024 | 0.02 | B | Ibrahimov |
| 2453299.491 | 2004 Oct. 20 | 11.022 | 0.02 | B | Ibrahimov |
| 2453309.476 | 2004 Oct. 30 | 11.009 | 0.02 | B | Ibrahimov |
| 2453310.46 | 2004 Oct. 31 | 10.999 | 0.02 | B | Ibrahimov |
| 2453311.499 | 2004 Nov. 1 | 11.025 | 0.02 | B | Ibrahimov |
| 2457447.283 | 2016 Feb. 28 | 11.122 | 0.087 | B | DUBF |
| 2457447.283 | 2016 Feb. 28 | 11.2 | 0.08 | B | DUBF |
| 2457447.283 | 2016 Feb. 28 | 11.095 | 0.086 | B | DUBF |
| 2457447.284 | 2016 Feb. 28 | 11.134 | 0.081 | B | DUBF |
| 2457447.284 | 2016 Feb. 28 | 11.078 | 0.094 | B | DUBF |
| 2457458.345 | 2016 Mar. 10 | 11.191 | 0.067 | B | DUBF |
| 2457458.345 | 2016 Mar. 10 | 11.209 | 0.066 | B | DUBF |
| 2457458.346 | 2016 Mar. 10 | 11.143 | 0.069 | B | DUBF |
| 2457458.346 | 2016 Mar. 10 | 11.148 | 0.067 | B | DUBF |
| 2457461.302 | 2016 Mar. 13 | 11.187 | 0.05 | B | DUBF |
| 2457461.302 | 2016 Mar. 13 | 11.272 | 0.045 | B | DUBF |
| 2457461.302 | 2016 Mar. 13 | 11.186 | 0.051 | B | DUBF |
| 2457461.303 | 2016 Mar. 13 | 11.162 | 0.053 | B | DUBF |
| 2457461.303 | 2016 Mar. 13 | 11.179 | 0.048 | B | DUBF |
| 2457465.292 | 2016 Mar. 17 | 11.249 | 0.114 | B | DUBF |
| 2457465.293 | 2016 Mar. 17 | 11.188 | 0.119 | B | DUBF |
| 2457465.293 | 2016 Mar. 17 | 11.173 | 0.119 | B | DUBF |
| 2457465.293 | 2016 Mar. 17 | 11.32 | 0.101 | B | DUBF |
| 2457470.349 | 2016 Mar. 22 | 11.092 | 0.069 | B | DUBF |
| 2457470.349 | 2016 Mar. 22 | 11.28 | 0.056 | B | DUBF |
| 2457470.35 | 2016 Mar. 22 | 11.148 | 0.063 | B | DUBF |
| 2457470.35 | 2016 Mar. 22 | 11.169 | 0.063 | B | DUBF |
| 2457470.35 | 2016 Mar. 22 | 11.35 | 0.054 | B | DUBF |
| 2457479.36 | 2016 Mar. 31 | 11.177 | 0.072 | B | DUBF |
| 2457479.36 | 2016 Mar. 31 | 11.308 | 0.074 | B | DUBF |
| 2457479.36 | 2016 Mar. 31 | 11.24 | 0.069 | B | DUBF |
| 2457479.36 | 2016 Mar. 31 | 11.197 | 0.07 | B | DUBF |
| 2457479.361 | 2016 Mar. 31 | 11.026 | 0.085 | B | DUBF |
| 2457480.321 | 2016 Apr. 01 | 11.171 | 0.078 | B | DUBF |
| 2457480.321 | 2016 Apr. 01 | 11.005 | 0.096 | B | DUBF |
| 2457480.321 | 2016 Apr. 01 | 11.206 | 0.077 | B | DUBF |
| 2457480.321 | 2016 Apr. 01 | 11.092 | 0.087 | B | DUBF |
| 2457480.322 | 2016 Apr. 01 | 11.191 | 0.074 | B | DUBF |
| 2453278.46 | 2004 Sep. 29 | 8.485 | 0.015 | R | Ibrahimov |
| 2453280.45 | 2004 Oct. 1 | 8.47 | 0.015 | R | Ibrahimov |
| 2453281.472 | 2004 Oct. 2 | 8.466 | 0.015 | R | Ibrahimov |
| 2453283.481 | 2004 Oct. 4 | 8.488 | 0.015 | R | Ibrahimov |
| 2453284.483 | 2004 Oct. 5 | 8.504 | 0.015 | R | Ibrahimov |
| 2453299.491 | 2004 Oct. 20 | 8.493 | 0.015 | R | Ibrahimov |
| 2453309.476 | 2004 Oct. 30 | 8.483 | 0.015 | R | Ibrahimov |
| 2453310.46 | 2004 Oct. 31 | 8.486 | 0.015 | R | Ibrahimov |
| 2453311.499 | 2004 Nov. 1 | 8.477 | 0.015 | R | Ibrahimov |
| 2457448.274 | 2016 Feb. 29 | 8.447 | 0.012 | R | DUBF |
| 2457448.274 | 2016 Feb. 29 | 8.434 | 0.012 | R | DUBF |
| 2457448.274 | 2016 Feb. 29 | 8.429 | 0.012 | R | DUBF |
| 2457448.274 | 2016 Feb. 29 | 8.451 | 0.012 | R | DUBF |
| 2457448.274 | 2016 Feb. 29 | 8.428 | 0.012 | R | DUBF |
| 2457451.324 | 2016 Mar. 03 | 8.445 | 0.038 | R | DUBF |
| 2457451.324 | 2016 Mar. 03 | 8.413 | 0.038 | R | DUBF |
| 2457451.325 | 2016 Mar. 03 | 8.469 | 0.029 | R | DUBF |
| 2457451.325 | 2016 Mar. 03 | 8.498 | 0.023 | R | DUBF |
| 2457451.325 | 2016 Mar. 03 | 8.473 | 0.024 | R | DUBF |
| 2457458.346 | 2016 Mar. 10 | 8.542 | 0.012 | R | DUBF |
| 2457458.346 | 2016 Mar. 10 | 8.546 | 0.012 | R | DUBF |
| 2457458.347 | 2016 Mar. 10 | 8.558 | 0.012 | R | DUBF |
| 2457458.347 | 2016 Mar. 10 | 8.548 | 0.012 | R | DUBF |
| 2457458.347 | 2016 Mar. 10 | 8.557 | 0.012 | R | DUBF |
| 2457461.303 | 2016 Mar. 13 | 8.525 | 0.01 | R | DUBF |
| 2457461.303 | 2016 Mar. 13 | 8.54 | 0.01 | R | DUBF |
| 2457461.304 | 2016 Mar. 13 | 8.516 | 0.011 | R | DUBF |
| 2457461.304 | 2016 Mar. 13 | 8.543 | 0.01 | R | DUBF |
| 2457461.304 | 2016 Mar. 13 | 8.53 | 0.01 | R | DUBF |
| 2457464.315 | 2016 Mar. 16 | 8.588 | 0.017 | R | DUBF |
| 2457464.315 | 2016 Mar. 16 | 8.601 | 0.018 | R | DUBF |
| 2457464.316 | 2016 Mar. 16 | 8.557 | 0.018 | R | DUBF |
| 2457464.316 | 2016 Mar. 16 | 8.587 | 0.017 | R | DUBF |
| 2457464.316 | 2016 Mar. 16 | 8.593 | 0.017 | R | DUBF |
| 2457465.294 | 2016 Mar. 17 | 8.528 | 0.015 | R | DUBF |
| 2457465.294 | 2016 Mar. 17 | 8.579 | 0.016 | R | DUBF |
| 2457465.294 | 2016 Mar. 17 | 8.599 | 0.016 | R | DUBF |
| 2457465.294 | 2016 Mar. 17 | 8.578 | 0.015 | R | DUBF |
| 2457465.294 | 2016 Mar. 17 | 8.563 | 0.015 | R | DUBF |
| 2457470.35 | 2016 Mar. 22 | 8.554 | 0.012 | R | DUBF |
| 2457470.351 | 2016 Mar. 22 | 8.534 | 0.013 | R | DUBF |
| 2457470.351 | 2016 Mar. 22 | 8.543 | 0.012 | R | DUBF |
| 2457470.351 | 2016 Mar. 22 | 8.556 | 0.013 | R | DUBF |
| 2457470.351 | 2016 Mar. 22 | 8.543 | 0.012 | R | DUBF |
| 2457479.361 | 2016 Mar. 31 | 8.514 | 0.011 | R | DUBF |
| 2457479.361 | 2016 Mar. 31 | 8.501 | 0.01 | R | DUBF |
| 2457479.361 | 2016 Mar. 31 | 8.512 | 0.011 | R | DUBF |
| 2457479.362 | 2016 Mar. 31 | 8.477 | 0.011 | R | DUBF |
| 2457479.362 | 2016 Mar. 31 | 8.46 | 0.011 | R | DUBF |
| 2457480.322 | 2016 Apr. 01 | 8.487 | 0.01 | R | DUBF |
| 2457480.322 | 2016 Apr. 01 | 8.502 | 0.009 | R | DUBF |
| 2457480.322 | 2016 Apr. 01 | 8.493 | 0.009 | R | DUBF |
| 2457480.322 | 2016 Apr. 01 | 8.505 | 0.01 | R | DUBF |
| 2457480.322 | 2016 Apr. 01 | 8.483 | 0.01 | R | DUBF |
| 2457484.309 | 2016 Apr. 05 | 8.448 | 0.012 | R | DUBF |
| 2457484.309 | 2016 Apr. 05 | 8.456 | 0.011 | R | DUBF |
| 2457484.309 | 2016 Apr. 05 | 8.43 | 0.012 | R | DUBF |
| 2457484.309 | 2016 Apr. 05 | 8.482 | 0.012 | R | DUBF |
| 2457484.309 | 2016 Apr. 05 | 8.466 | 0.011 | R | DUBF |
| 2453278.46 | 2004 Sep. 29 | 9.654 | 0.02 | V | Ibrahimov |
| 2453280.45 | 2004 Oct. 1 | 9.629 | 0.02 | V | Ibrahimov |
| 2453281.472 | 2004 Oct. 2 | 9.639 | 0.02 | V | Ibrahimov |
| 2453283.481 | 2004 Oct. 4 | 9.682 | 0.02 | V | Ibrahimov |
| 2453284.483 | 2004 Oct. 5 | 9.677 | 0.02 | V | Ibrahimov |
| 2453299.491 | 2004 Oct. 20 | 9.676 | 0.02 | V | Ibrahimov |
| 2453309.476 | 2004 Oct. 30 | 9.659 | 0.02 | V | Ibrahimov |
| 2453310.46 | 2004 Oct. 31 | 9.661 | 0.02 | V | Ibrahimov |
| 2453311.499 | 2004 Nov. 1 | 9.652 | 0.02 | V | Ibrahimov |
| 2457447.282 | 2016 Feb. 28 | 9.746 | 0.016 | V | DUBF |
| 2457447.282 | 2016 Feb. 28 | 9.79 | 0.015 | V | DUBF |
| 2457447.283 | 2016 Feb. 28 | 9.781 | 0.015 | V | DUBF |
| 2457447.283 | 2016 Feb. 28 | 9.771 | 0.015 | V | DUBF |
| 2457447.283 | 2016 Feb. 28 | 9.775 | 0.016 | V | DUBF |
| 2457448.272 | 2016 Feb. 29 | 9.796 | 0.018 | V | DUBF |
| 2457448.273 | 2016 Feb. 29 | 9.819 | 0.017 | V | DUBF |
| 2457448.273 | 2016 Feb. 29 | 9.783 | 0.018 | V | DUBF |
| 2457448.273 | 2016 Feb. 29 | 9.811 | 0.018 | V | DUBF |
| 2457448.273 | 2016 Feb. 29 | 9.738 | 0.018 | V | DUBF |
| 2457451.322 | 2016 Mar. 03 | 9.822 | 0.046 | V | DUBF |
| 2457451.322 | 2016 Mar. 03 | 9.788 | 0.04 | V | DUBF |
| 2457451.323 | 2016 Mar. 03 | 9.803 | 0.035 | V | DUBF |
| 2457451.323 | 2016 Mar. 03 | 9.855 | 0.031 | V | DUBF |
| 2457451.323 | 2016 Mar. 03 | 9.838 | 0.03 | V | DUBF |
| 2457458.344 | 2016 Mar. 10 | 9.856 | 0.019 | V | DUBF |
| 2457458.344 | 2016 Mar. 10 | 9.838 | 0.02 | V | DUBF |
| 2457458.344 | 2016 Mar. 10 | 9.867 | 0.018 | V | DUBF |
| 2457458.345 | 2016 Mar. 10 | 9.889 | 0.018 | V | DUBF |
| 2457458.345 | 2016 Mar. 10 | 9.846 | 0.019 | V | DUBF |
| 2457461.301 | 2016 Mar. 13 | 9.88 | 0.014 | V | DUBF |
| 2457461.301 | 2016 Mar. 13 | 9.887 | 0.014 | V | DUBF |
| 2457461.301 | 2016 Mar. 13. | 9.89 | 0.013 | V | DUBF |
| 2457461.302 | 2016 Mar. 13 | 9.888 | 0.014 | V | DUBF |
| 2457461.302 | 2016 Mar. 13 | 9.903 | 0.014 | V | DUBF |
| 2457464.313 | 2016 Mar. 16 | 9.899 | 0.032 | V | DUBF |
| 2457464.313 | 2016 Mar. 16 | 9.912 | 0.031 | V | DUBF |
| 2457464.314 | 2016 Mar. 16 | 9.875 | 0.031 | V | DUBF |
| 2457464.314 | 2016 Mar. 16 | 9.913 | 0.031 | V | DUBF |
| 2457464.314 | 2016 Mar. 16 | 9.944 | 0.03 | V | DUBF |
| 2457465.291 | 2016 Mar. 17 | 9.902 | 0.03 | V | DUBF |
| 2457465.291 | 2016 Mar. 17 | 9.926 | 0.027 | V | DUBF |
| 2457465.291 | 2016 Mar. 17 | 9.926 | 0.027 | V | DUBF |
| 2457465.292 | 2016 Mar. 17 | 9.976 | 0.026 | V | DUBF |
| 2457465.292 | 2016 Mar. 17 | 9.917 | 0.028 | V | DUBF |
| 2457470.348 | 2016 Mar. 22 | 9.912 | 0.018 | V | DUBF |
| 2457470.348 | 2016 Mar. 22 | 9.889 | 0.018 | V | DUBF |
| 2457470.348 | 2016 Mar. 22 | 9.861 | 0.018 | V | DUBF |
| 2457470.348 | 2016 Mar. 22 | 9.878 | 0.018 | V | DUBF |
| 2457470.349 | 2016 Mar. 22 | 9.905 | 0.017 | V | DUBF |
| 2457479.358 | 2016 Mar. 31 | 9.806 | 0.028 | V | DUBF |
| 2457479.358 | 2016 Mar. 31 | 9.858 | 0.026 | V | DUBF |
| 2457479.359 | 2016 Mar. 31 | 9.778 | 0.029 | V | DUBF |
| 2457479.359 | 2016 Mar. 31 | 9.802 | 0.03 | V | DUBF |
| 2457479.359 | 2016 Mar. 31 | 9.825 | 0.027 | V | DUBF |
| 2457480.32 | 2016 Apr. 01 | 9.796 | 0.024 | V | DUBF |
| 2457480.32 | 2016 Apr. 01 | 9.832 | 0.022 | V | DUBF |
| 2457480.32 | 2016 Apr. 01 | 9.794 | 0.024 | V | DUBF |
| 2457480.32 | 2016 Apr. 01 | 9.822 | 0.024 | V | DUBF |
| 2457480.32 | 2016 Apr. 01 | 9.795 | 0.025 | V | DUBF |
| 2457484.307 | 2016 Apr. 05 | 9.855 | 0.038 | V | DUBF |
| 2457484.307 | 2016 Apr. 05 | 9.74 | 0.042 | V | DUBF |
| 2457484.307 | 2016 Apr. 05 | 9.843 | 0.036 | V | DUBF |
| 2457484.307 | 2016 Apr. 05 | 9.761 | 0.037 | V | DUBF |
| 2457484.307 | 2016 Apr. 05 | 9.807 | 0.036 | V | DUBF |
Note. — UBVR Photometry from 2004-2016 used in this work.
3 Analysis
3.1 Continuum
First we consider changes in the continuum flux density. The (red) photometry presented in Figure 2 comes from various times between 1998 and 2010, but we used the AAVSO UBVR and decline rate in B and V (0.015 mag yr-1) measured for FU Ori in previous work (Kenyon et al., 2000; Green et al., 2006) to confirm that FU Ori has continued to decline in B and V-band. Specifically, we averaged the B and V magnitudes measured in 2016 from the AAVSO, 11.178 0.078 and 9.844 0.156, respectively. Photometry contemporaneous with the Spitzer spectroscopy (Green et al., 2006), taken in Oct 2004, indicated B and V magnitudes of 11.01 0.02 and 9.66 0.02, respectively. This data is shown in Table 2. Extrapolating from Oct 2004 to Mar 2016 indicates decline rates of 0.015 and 0.016 mag/yr, respectively. This translates to a decrease of 14-15% in the optical bands over the 12 years between the Spitzer and SOFIA observations.
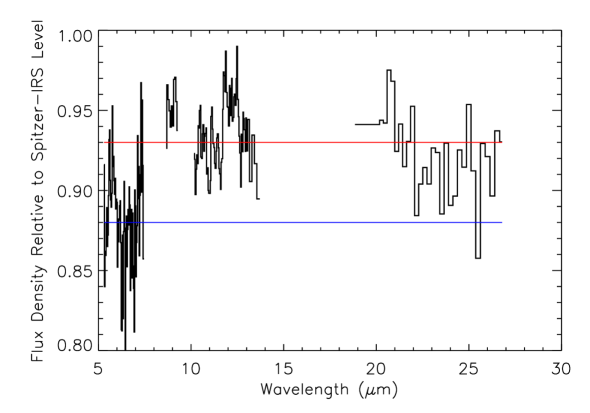
Next we consider the mid-IR bands by comparing the common portions of the 5-28 m data from Spitzer and SOFIA directly; the ratio is shown in Figure 3. We observe a 12% decrease from 5-8m, and a 7% decrease from 10-28 m; these ratios are shown in Figure 3.
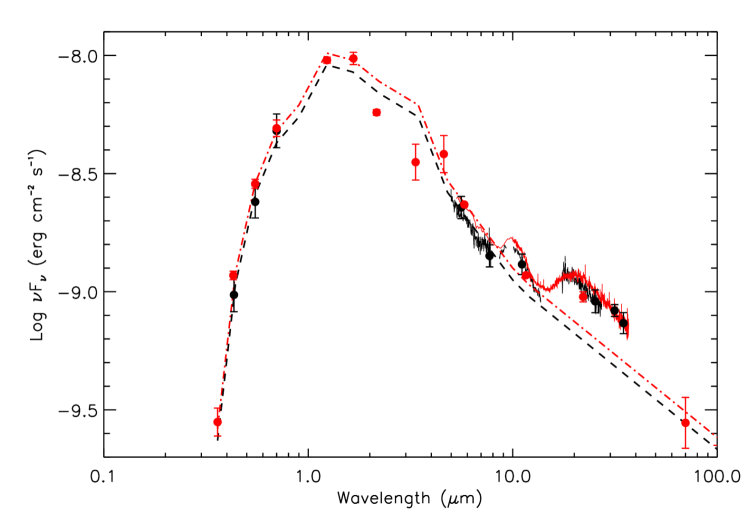
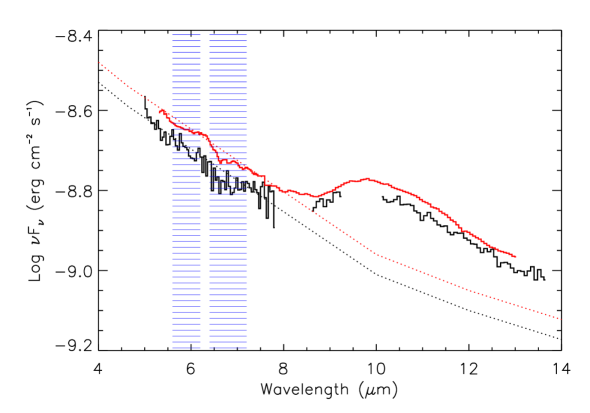
Finally we consider the entire 0.1-100 m spectrum. We began by fitting the Spitzer 5-8 m continuum, along with the UBVRIJHK, and WISE W1 band similar to Green et al. (2006), using the modified blackbody models from Kenyon & Hartmann (1995). We found that any of the 6590-7200 K models were equivalent fits to the observed 5-8 m slope. There are larger differences between the models near 1 m, but lacking ca. 2016 data in the near-IR, the uncertainties are too great to distinguish between them. For the purpose of this comparison, we adopt the 7200 K model as in Green et al. (2006). We then fit the rebinned SOFIA continuum at the same anchor wavelengths and found that the same 7200 K model, but with 12% lower flux, matched the continuum to within uncertainties.
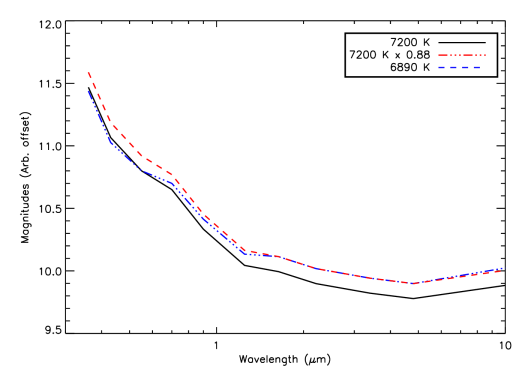
We found the slopes were not sufficiently distinguishable in either the optical/near-IR photometry or in the 5-8 m spectroscopy. To get an idea of the uncertainties in the temperature, we used standard photometric colors from Table A.5 of Kenyon & Hartmann (1995). To illustrate this, Figure 4 shows three modified blackbody models reddened to an AV of 1.8 (Mathis, 1990), similar to FU Ori: 7200 K, 6890 K, and 7200 K but decreased by 12%; the difference between cooling from 7200 to 6890 K, rather than decreasing the accretion rate by 12%, is indistinguishable at wavelengths 1 m. Given that the UBVR photometry we include shows a decrease comparable to the IR, it is most plausible to explain the continuum flux change by depletion of the innermost region of the disk (or equivalently decreased accretion rate); however, the mid-IR flux decrease can be explained by cooling (a decrease in the inner disk temperature). The cooling time in centrally irradiated T Tauri disks is very short, either a few years down to a few days depending upon the disk geometry (D’Alessio et al., 1999). Additionally, for typical FUor system parameters, Johnstone et al. (2013) found a cooling time in FUor disks on the order of a few weeks (albeit long compared with the dust-photon coupling timescale). Assuming the outer disk of FU Ori remains similar to a T Tauri disk, the cooling timescale is too rapid to explain the slow rate of decay.
Typically the draining of the gas within a disk would be noted in a decrease of the flux of the corotating molecular gas, as was seen in the post-outburst emission lines of EX Lup (Banzatti et al., 2015). Unlike T Tauri disks (Salyk et al., 2011), the CO lines are seen in absorption in FUors, even at 4.6 m (Smith et al., 2009); they attribute the absorption to a surrounding envelope of 0.1 M⊙, which FU Ori does not possess (e.g. Green et al., 2013).
3.2 Dust features
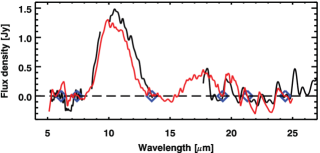
The 10 m silicate emission feature in the Spitzer-IRS spectrum showed no evidence of crystalline grains, but some evidence for grain growth during the disk lifetime (Quanz et al., 2007). In order to compare the SOFIA feature, we used a spline fit to anchor the spectrum at 8 m, between the SiO and water vapor features, at 13 m (the long wavelength edge of the G111 spectrum), and beyond 20 m (centered within the G253 spectrum).
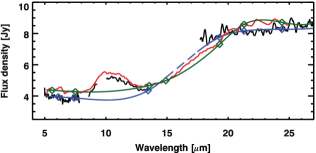
Two different spline fits to both the Spitzer and SOFIA spectra are shown in Figure 5, and described below. We first tried independent spline fitting on each spectrum: 5.6, 7.5, 13.6,14.9, 19.3, 21.3, and 24.4 m anchor points for the Spitzer data; 6.1, 7.4, 13.5, 19.3, 21.3, and 24.4 m for the SOFIA data. We identified the anchor continuum points separately, and unlike the IRS spectrum, the FORCAST spectrum does not have continuous wavelength coverage from 5-38 m, nor over the 9-13 m complete silicate complex. Thus the fits are slightly different, and the residuals appear to have shifted (Figure 5, top panel). Specifically, the 10 m silicate feature appears broader (to longer wavelengths) and taller. To check whether this difference was due to the differences in spline fitting between the two spectra, we performed a second spline fitting and subtraction using exactly the same anchor points for both the SOFIA-FORCAST and the Spitzer-IRS spectrum. Because we were limited to wavelength points common to both spectra, we used only six anchor points rather than the original seven in the IRS spectrum. The results are shown in the bottom of Figure 5. The features are virtually unchanged given the S/N of the SOFIA spectrum; we see no evidence of further dust processing or grain growth in the last 12 years, and attribute any apparent differences in the feature to incomplete spectral coverage in the FORCAST bands.
Unfortunately, we lack sufficient spectral coverage to compare the 20 m silicate features, but we find them consistent at wavelengths greater than 20 m, and attribute any differences at shorter wavelengths to edge effects in the G253 spectrum.
3.3 Gaseous absorption features: H2O
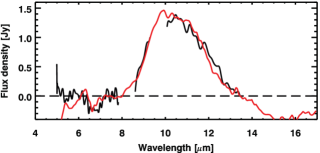
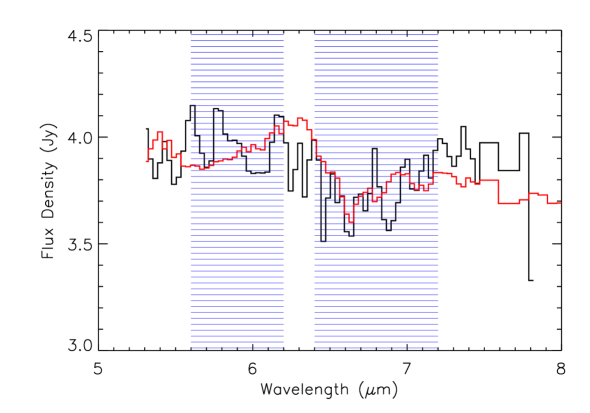
The blended rovibrational absorption lines of H2O, originally noted in Green et al. (2006), are still present in the SOFIA-FORCAST spectrum (Figure 6). The short wavelength shoulder marks the boundary between the blended R-branch lines ( 6.3 m) and the blended P-branch lines ( 6.3 m). The blended P-branch absorption lines appear unchanged over the last 12 years. However, the relatively shallower blended R-branch absorption detected in the Spitzer-IRS spectrum is not clearly detected. In order to compare the features directly, we apply a -0.5 Jy offset to the IRS spectrum, shown in Figure 7. Differences between the R- and P-branch lines were noted, for example, in Orion-BN/KL (González-Alfonso et al., 1998), who found the R-branch in absorption and P-branch in emission. However, further observations with higher S/N are needed to confirm any changes.
Additional absorption attributed to SiO (8 m) by Green et al. (2006) may be present in the FORCAST spectrum, but without full spectral coverage, or improved sensitivity, we cannot determine whether this feature has changed in detail.
4 Discussion
FUors are generally understood as large accretion bursts, although models differ on where the infalling material begins its descent. Binarity and outburst behavior has been examined in several studies (e.g. Bonnell & Bastien, 1992; Reipurth et al., 2002; Millan-Gabet et al., 2006; Green et al., 2016). As noted earlier, FU Ori is itself a 05 binary, and disk-binary interactions could promote an episodic or burst mode of accretion (Reipurth & Aspin, 2004). Assuming the central star mass of FU Ori is (Zhu et al., 2009a), the integrated accretion luminosity (using model parameters from Green et al. 2006) corresponds to a total accreted mass of . Furthermore, FU Ori was the target of a recent ALMA study that separated the two components (Hales et al., 2015) and demonstrated that the remnant envelope is tenuous at best, indicating that there is no external reservoir for resupplying the disk material in repeated bursts. They hypothesized that the more extinguished southern component could act as the mass reservoir for resupply. Flattened envelope models can explain the long wavelength SED and provide long-term resupply potential, although whether sufficient mass exists for resupply is unclear, judging by the far-IR excess reported by Green et al. (2013), who estimated a dust mass of 0.05 M⊙ from the Herschel-SPIRE 350 m excess. Higher resolution observations from the Submillimeter Array further contained the size and mass of such an envelope plus disk observations to 0.05 M⊙ within 450 AU or less (M. Dunham, 2016, priv. comm., Green et al. 2016).
Regardless of the origin of the infalling material, our study suggests that at the mature stages of outburst, the infalling material accretes from the inside-out. The decrease in only the short wavelength continuum, without change to spectral shape, indicates a decrease in density of the hot material, rather than a decrease in temperature. Combined with the lack of change in the silicate dust features after removing continuum effects, we suggest that the luminosity decrease in FU Ori is due primarily to this draining effect, leading to a decrease in the accretion rate. Because the peak temperature in the disk still appears to be about 7200 K, the infall radius (centrifugal radius) is quite close to the central star. Zhu et al. (2007) modeled FU Ori as a superheated disk with a maximum effective temperature of 6420 K at 5 R⊙, decreasing to 4660 K at 3 , eventually to 977 K at 30 (0.7 AU). They added a second component from a more typical accretion disk 1 AU.
Supposing over the past 12 years FU Ori accreted only material at a temperature 977 K, the accreted material would all be within 0.7 AU, where the free fall time is much shorter than 12 years. It may be refilled from surrounding regions but the maximum refill rate is capped by the upper limit to the change in IR excess beyond 20 m, which arises from annuli beyond the boundaries of the superheated disk at 1 AU (Zhu et al., 2009a). It appears that the outer disk does not react as quickly to this decreased luminosity on a 12 year timescale; within the uncertainties in scatter, the continuum level 20 m has changed by 7%.
However, we note that we cannot rule out cooling in the inner disk from this change in the SED. If this is due to cooling of the inner disk rather than a decrease in the accretion rate, and the 5-8 m is dominated by the hot disk as models suggest, then the temperature decrease from a 12% decrease in luminosity would be only 4% (ie. from 7200 K to 6900 K). This is a small effect on the slope and is consistent with our data in the mid-IR (Figure 4). Potentially, a cooling pattern and decreased central accretion could be distinguished with high fidelity IR continuum measurements, increased coverage in the optical-near IR bands, or by changes in the width or shape of CO lines from differing disk annuli. Bell et al. (1995) noted that the decrease in the SED of FUor V1057 Cyg was least significant between 1 and 10 m; between 2004 and 2016, at least, FU Ori does not seem to follow this pattern, maintaining a decay rate similar to the optical bands out to at least 8 m. This difference may reflect the relatively small amount of material surrounding FU Ori, or the overall slower decay rate compared with that of V1057 Cyg. An alternate explanation is that the FU Ori disk is geometrically thicker due to the extreme nature and duration of the accretion event (e.g., Hartmann et al. 2011 and references therein), and is beginning to settle as the midplane begins to cool.
5 Conclusions
We have performed the first comparison of multi-epoch mid-IR spectra of an FUor, to examine the changes occurring in the system during outburst. We compared the ca. 2004 SED and IR spectrum of FU Orionis with newly acquired (2016) SOFIA-FORCAST spectrum and photometry to identify changes over the intervening 12 year period. After establishing cross-calibration between the various measurements, we find a 12% ( 3) decrease in the 5-14 m continuum without significant change in shape. We find lesser changes ( 7%) to the SED beyond 10 m, and no significant change to the silicate dust or the rovibrational water absorption from the disk photosphere. From this, we posit a decrease in gas at the highest temperatures, and therefore the innermost regions of the disk, either due to cooling or depletion via accretion processes.
References
- Ábrahám et al. (2009) Ábrahám, P., Juhász, A., Dullemond, C. P., et al. 2009, Nature, 459, 224
- Andrews & Williams (2005) Andrews, S. M., & Williams, J. P. 2005, ApJ, 631, 1134
- Banzatti et al. (2015) Banzatti, A., Pontoppidan, K. M., Bruderer, S., Muzerolle, J., & Meyer, M. R. 2015, ApJ, 798, L16
- Bell & Lin (1994) Bell, K. R., & Lin, D. N. C. 1994, ApJ, 427, 987
- Bell et al. (1995) Bell, K. R., Lin, D. N. C., Hartmann, L. W., & Kenyon, S. J. 1995, ApJ, 444, 376
- Bonnell & Bastien (1992) Bonnell, I., & Bastien, P. 1992, ApJ, 401, L31
- Carey et al. (2012) Carey, S., Ingalls, J., Hora, J., et al. 2012, in Proc. SPIE, Vol. 8442, Space Telescopes and Instrumentation 2012: Optical, Infrared, and Millimeter Wave, 84421Z
- Cieza et al. (2016) Cieza, L. A., Casassus, S., Tobin, J., et al. 2016, ArXiv e-prints, arXiv:1607.03757
- Cutri & et al. (2013) Cutri, R. M., & et al. 2013, VizieR Online Data Catalog, 2328
- D’Alessio et al. (1999) D’Alessio, P., Calvet, N., Hartmann, L., Lizano, S., & Cantó, J. 1999, ApJ, 527, 893
- González-Alfonso et al. (1998) González-Alfonso, E., Cernicharo, J., van Dishoeck, E. F., Wright, C. M., & Heras, A. 1998, ApJ, 502, L169
- Green et al. (2006) Green, J. D., Hartmann, L., Calvet, N., et al. 2006, ApJ, 648, 1099
- Green et al. (2016) Green, J. D., Kraus, A. L., Rizzuto, A. C., et al. 2016, ArXiv e-prints, arXiv:1605.03270
- Green et al. (2013) Green, J. D., Evans, II, N. J., Kóspál, Á., et al. 2013, ApJ, 772, 117
- Hales et al. (2015) Hales, A. S., Corder, S. A., Dent, W. R. D., et al. 2015, ApJ, 812, 134
- Hartmann (1998) Hartmann, L. 1998, Accretion Processes in Star Formation (Accretion processes in star formation / Lee Hartmann. Cambridge, UK ; New York : Cambridge University Press, 1998. (Cambridge astrophysics series ; 32) ISBN 0521435072.)
- Hartmann & Kenyon (1985) Hartmann, L., & Kenyon, S. J. 1985, ApJ, 299, 462
- Hartmann & Kenyon (1996) —. 1996, ARA&A, 34, 207
- Hartmann et al. (2011) Hartmann, L., Zhu, Z., & Calvet, N. 2011, ArXiv e-prints, arXiv:1106.3343
- Herbig (1977) Herbig, G. H. 1977, ApJ, 217, 693
- Herter et al. (2012) Herter, T. L., Adams, J. D., De Buizer, J. M., et al. 2012, ApJ, 749, L18
- Herter et al. (2013) Herter, T. L., Vacca, W. D., Adams, J. D., et al. 2013, PASP, 125, 1393
- Higdon et al. (2004) Higdon, S. J. U., Devost, D., Higdon, J. L., et al. 2004, PASP, 116, 975
- Houck et al. (2004) Houck, J. R., Roellig, T. L., van Cleve, J., et al. 2004, ApJS, 154, 18
- Hubbard & Ebel (2014) Hubbard, A., & Ebel, D. S. 2014, Icarus, 237, 84
- Johnstone et al. (2013) Johnstone, D., Hendricks, B., Herczeg, G. J., & Bruderer, S. 2013, ApJ, 765, 133
- Kenyon & Hartmann (1995) Kenyon, S. J., & Hartmann, L. 1995, ApJS, 101, 117
- Kenyon et al. (1988) Kenyon, S. J., Hartmann, L., & Hewett, R. 1988, ApJ, 325, 231
- Kenyon et al. (2000) Kenyon, S. J., Kolotilov, E. A., Ibragimov, M. A., & Mattei, J. A. 2000, ApJ, 531, 1028
- Kim et al. (2012) Kim, H. J., Evans, II, N. J., Dunham, M. M., Lee, J.-E., & Pontoppidan, K. M. 2012, ApJ, 758, 38
- Lebouteiller et al. (2015) Lebouteiller, V., Barry, D. J., Goes, C., et al. 2015, ApJS, 218, 21
- Lebouteiller et al. (2011) Lebouteiller, V., Barry, D. J., Spoon, H. W. W., et al. 2011, ApJS, 196, 8
- Lin & Papaloizou (1985) Lin, D. N. C., & Papaloizou, J. 1985, in Protostars and Planets II, ed. D. C. Black & M. S. Matthews, 981–1072
- Martin et al. (2012) Martin, R. G., Lubow, S. H., Livio, M., & Pringle, J. E. 2012, MNRAS, 423, 2718
- Mathis (1990) Mathis, J. S. 1990, ARA&A, 28, 37
- Millan-Gabet et al. (2006) Millan-Gabet, R., Monnier, J. D., Akeson, R. L., et al. 2006, ApJ, 641, 547
- Olofsson et al. (2009) Olofsson, J., Augereau, J.-C., van Dishoeck, E. F., et al. 2009, A&A, 507, 327
- Paczynski (1976) Paczynski, B. 1976, in IAU Symposium, Vol. 73, Structure and Evolution of Close Binary Systems, ed. P. Eggleton, S. Mitton, & J. Whelan, 75–+
- Poteet et al. (2013) Poteet, C. A., Pontoppidan, K. M., Megeath, S. T., et al. 2013, ApJ, 766, 117
- Pueyo et al. (2012) Pueyo, L., Hillenbrand, L., Vasisht, G., et al. 2012, ApJ, 757, 57
- Quanz et al. (2007) Quanz, S. P., Henning, T., Bouwman, J., et al. 2007, ApJ, 668, 359
- Reipurth & Aspin (2004) Reipurth, B., & Aspin, C. 2004, ApJ, 608, L65
- Reipurth et al. (2002) Reipurth, B., Hartmann, L., Kenyon, S. J., Smette, A., & Bouchet, P. 2002, AJ, 124, 2194
- Romanova et al. (2009) Romanova, M. M., Ustyugova, G. V., Koldoba, A. V., & Lovelace, R. V. E. 2009, Astrophysics and Space Science Proceedings, 13, 153
- Salyk et al. (2011) Salyk, C., Blake, G. A., Boogert, A. C. A., & Brown, J. M. 2011, ApJ, 743, 112
- Skrutskie et al. (2006) Skrutskie, M. F., Cutri, R. M., Stiening, R., et al. 2006, AJ, 131, 1163
- Smith et al. (2009) Smith, R. L., Pontoppidan, K. M., Young, E. D., Morris, M. R., & van Dishoeck, E. F. 2009, ApJ, 701, 163
- Vorobyov & Basu (2015) Vorobyov, E. I., & Basu, S. 2015, ApJ, 805, 115
- Wang et al. (2004) Wang, H., Apai, D., Henning, T., & Pascucci, I. 2004, ApJ, 601, L83
- Watson et al. (2009) Watson, D. M., Leisenring, J. M., Furlan, E., et al. 2009, ApJS, 180, 84
- Werner et al. (2004) Werner, M. W., Roellig, T. L., Low, F. J., et al. 2004, ApJS, 154, 1
- Young et al. (2012) Young, E. T., Becklin, E. E., Marcum, P. M., et al. 2012, ApJ, 749, L17
- Zhu et al. (2007) Zhu, Z., Hartmann, L., Calvet, N., et al. 2007, ApJ, 669, 483
- Zhu et al. (2009a) Zhu, Z., Hartmann, L., & Gammie, C. 2009a, ApJ, 694, 1045
- Zhu et al. (2009b) Zhu, Z., Hartmann, L., Gammie, C., & McKinney, J. C. 2009b, ApJ, 701, 620
- Zhu et al. (2010) Zhu, Z., Hartmann, L., Gammie, C. F., et al. 2010, ApJ, 713, 1134