The age of the young bulge-like population in the stellar system Terzan5: linking the Galactic bulge to the high-z Universe111Based on data obtained with (1) the ESA/NASA HST, under programs GO-14061, GO-12933, GO-10845, (2) the Very Large Telescope of the European Southern Observatory during the Science Verification of the camera MAD; (3) the W.M. Keck Observatory, which is operated as a scientific partnership among the California Institute of Technology, the University of California and NASA.
Abstract
The Galactic bulge is dominated by an old, metal rich stellar population. The possible presence and the amount of a young (a few Gyr old) minor component is one of the major issues debated in the literature. Recently, the bulge stellar system Terzan 5 was found to harbor three sub-populations with iron content varying by more than one order of magnitude (from 0.2 up to 2 times the solar value), with chemical abundance patterns strikingly similar to those observed in bulge field stars. Here we report on the detection of two distinct main sequence turn-off points in Terzan 5, providing the age of the two main stellar populations: 12 Gyr for the (dominant) sub-solar component and 4.5 Gyr for the component at super-solar metallicity. This discovery classifies Terzan 5 as a site in the Galactic bulge where multiple bursts of star formation occurred, thus suggesting a quite massive progenitor possibly resembling the giant clumps observed in star forming galaxies at high redshifts. This connection opens a new route of investigation into the formation process and evolution of spheroids and their stellar content.
1 Introduction
The picture of galaxy bulges formation is still highly debated in the literature (for a review of the Milky Way bulge, see, e.g., Rich, 2013; Origlia, 2014). Among the proposed scenarios, three main channels can be grossly distinguished: dissipative collapse (e.g., Ballero et al., 2007; McWilliam et al., 2008), with possibly an additional component formed with a time delay of a few Gyr (e.g. Tsujimoto & Bekki, 2012; Grieco et al., 2012), dynamical secular evolution of a massive disk that buckles into a bar (e.g., Combes & Sanders, 1981; Raha et al., 1991; Saha & Gerhard, 2013), and merging of substructures either of primordial galaxies embedded in a dark matter halo (e.g., Scannapieco & Tissera, 2003; Hopkins et al., 2010), or massive clumps generated by early disk fragmentation (e.g. Immeli et al., 2004; Carollo et al., 2007; Elmegreen et al., 2008). In the merging scenarios most of the early fragments rapidly dissolved/merged together to form the bulge. However, a few of them could have survived the total disruption (e.g. Immeli et al., 2004; Carollo et al., 2007; Elmegreen et al., 2008) and it is very possible that such fossil relics are still observable somewhere in the host galaxy, grossly appearing as normal globular clusters (GCs). Because of their original large mass, these clumps should have been able to retain the iron-enriched ejecta and the stellar remnants of the supernova (SN) explosions, and they likely experienced more than one burst of star formation. As a consequence, we expect these fossil relics to host multi-iron sub-populations and, possibly, also a large number of neutron stars. Clearly, finding stellar systems with these properties would provide crucial observational support to the ’merging” scenario for bulge formation.
Until recently, no empirical probes of such fossil clumps in galaxy bulges were available. The situation changed in 2009, when Ferraro et al. (2009) discovered two stellar components with very different iron abundances in Terzan 5, a stellar system in the Milky Way bulge previously catalogued as a GC, with the only peculiarity of hosting the largest population of millisecond pulsars in the Galaxy (Ransom et al., 2005). The two components of Terzan 5 appear well distinct at the level of the red clump (RC) and red giant branch (RGB) in the combined NIR-optical color-magnitude diagram (CMD; Ferraro et al., 2009; Massari et al., 2012). Moreover, they display significantly different iron and -element abundances, the metal-poor population having [Fe/H] dex and [Fe], the metal-rich one showing [Fe/H] dex and [Fe] (Origlia et al., 2011; a minor component at [Fe/H] has been also detected, extending the internal metallicity range of Terzan 5 over more than 1 dex; see Origlia et al., 2013; Massari et al., 2014). Given these abundance patterns, the observed RC split could be explained either in terms of an age difference of a few Gyr, or in terms of a different helium content in two nearly coeval sub-populations (D’Antona et al., 2010; Lee et al., 2015).
The chemical abundance patterns measured in Terzan 5 are strikingly similar to those observed toward the Galactic bulge, while no other stellar system within the Milky Way outer disk and halo or in the Local Group show analogous properties (Chiappini et al., 1999; Matteucci & Chiappini, 2005; Lemasle et al., 2012). This opens the intriguing possibility that Terzan 5 is a fossil relic of one of the structures that contributed to generate the Galactic bulge. The bulge is known to be dominated by an old ( Gyr) stellar population with solar-like metallicity (Clarkson et al., 2008; Valenti et al., 2013; Rich, 2013). However, growing indirect evidence (Bensby et al., 2013; Dékány et al., 2015; Nataf, 2015) supports the existence of a minor, significantly younger component, with age not precisely determined yet. Thus, measuring the absolute ages of the two major stellar components in Terzan 5 is of paramount importance also in the context of the bulge formation history.
Here we present the accurate determination of the main sequence turn-off (MS-TO) region in Terzan 5, from which we determined the age of its two main stellar populations. The paper is organized as follows. The data-sets used and the data reduction procedures are presented and discussed in Section 2. The analysis of the CMDs, and the measure of the ages and radial distributions of the two populations are presented in Section 3. Section 4 is devoted to discussion and conclusions.
2 Observations and Data Analysis
For this study we used a wide photometric database collected with different instruments and telescopes: (i) ultra-deep images in the F606W and F814W filters acquired with the Advanced Camera for Surveys (ACS) on board the Hubble Space Telescope (HST), in three different epochs spanning more than 11 years (GO: 9799, PI: Rich; GO: 12933, PI: Ferraro and GO: 14061, PI: Ferraro); (ii) a set of images in the F110W and F160W filters secured with the IR channel of the Wide Field Camera 3 (WFC3) on board the HST (GO: 12933, PI: Ferraro); (iii) a set of high-resolution images in the and bands acquired with the Multi-conjugate Adaptive Optic Demonstrator (MAD) at the ESO Very Large Telescope (Science Demonstration Proposal, PI: Ferraro); (iv) a set of -band images obtained at the Keck Telescope by using the camera NIRC2 assisted with laser adaptive optics (U156N2L, PI: Rich). Most of the dataset used in this work was already presented and discussed in previous papers (see Ferraro et al., 2009; Lanzoni et al., 2010; Massari et al., 2014, 2015; Ferraro et al., 2015). Hence detailed information on the observations, data quality and data analysis can be found in those papers, while here we report only a schematic summary of the datasets and the reduction processes.
The optical HST dataset acquired with the Wide Field Channel (WFC) of the ACS camera is described in detail in Massari et al. (2015) and Ferraro et al. (2015). Here we used exclusively the _FLC images, already flat fielded and corrected for charge transfer efficiency (CTE) losses with the pixel-based correction in the pipeline (Anderson & Bedin, 2010; Ubeda & Anderson, 2012). The data reduction was performed using the software DAOPHOT-II (Stetson 1987, 1994), following the standard procedure described e.g. in Dalessandro et al. (2015). Briefly, for each exposure we determined the best PSF model using a few hundreds of bright, isolated stars. The model was then applied to all the sources detected (using ALLSTAR) above a 3 threshold from the background. Since the images secured with the F814W filter (being less affected by the strong extinction present in the cluster direction) turned out to be significantly deeper than those acquired in the filter F606W, we created a master list of stars composed by sources detected in at least three frames. This master list was used as input to force the PSF fitting with DAOPHOTII/ALLFRAME. The star magnitudes obtained in each frame secured in the same filter were then homogenized, and their weighted mean and standard deviation were finally adopted as magnitude and photometric error of each source. The stellar instrumental magnitudes and positions were finally calibrated onto the Johnson-Cousins system and reported onto the 2MASS equatorial reference frame, respectively, as described in Lanzoni et al. (2010).
The WFC3 dataset is made of 32 images, each one acquired with an exposure time of 300 s in both the F110W and the F160W filters. We worked on the images already pre-reduced by the STScI pipeline, following the same reduction procedure described in the previous paragraph. Also in this case, the F814W ACS catalog was used as input for the ALLFRAME analysis of all the exposures. The final catalog was built with the same prescriptions used for the ACS one. The instrumental magnitude were calibrated using the aperture correction and the zero-points listed at http://www.stsci.edu/hst/wfc3/photzplbn. Stellar positions were brought to the 2MASS astrometric reference using the CataPack suite of software111www.bo.astro.it/paolo/Main/CataPack.html
The MAD dataset is already described in Ferraro et al. (2009). Since the observations span a temporal interval of several hours, with seeing conditions varying quite significantly from one exposure to another, we limited our analysis only to those with a stable Full Width at Half Maximum (FWHM) of across the entire MAD field of view. FWHM were measured on bright, non saturated and isolated stars using the standard IRAF tools. Fifteen exposures survived such a selection, and we reduced them as described for the previous data sets. In this case, however, the PSF model was computed by allowing the look-up table of the star profile fitting residuals to vary across the field of view as a third order polynomial. This is because, as demonstrated in Saracino et al. (2015) and Massari et al. (2016), the PSF variability due to anisoplanatism effects in MCAO images is too large to be properly accounted for by a uniform PSF model. The magnitude of the final MAD catalogue were calibrated as described in Ferraro et al. (2009).
The NIRC2 data set consists of 82 exposures in the -filter with integration time of 180 s, taken during two observing nights (see Table 1). NIRC2 uses one Laser Guide Star (LGS) to correct for the blurring effect of the atmosphere. For this reason, the PSF variation within the field of view is much stronger than what observed in MCAO data, and the PSF deformation mainly follows a radial pattern around the LGS itself. In the acquired images, not even a third order polynomial allowed a proper modeling of the PSF, and a good photometry was achieved only within the isoplanatic region. Nonetheless, each exposure has been treated as described for the previous sets, and a final catalog including only stars found in at least 5 single exposures was built. The instrumental magnitudes were calibrated using the MAD catalog as reference.
3 Unveiling the double Turn-off
The gold standard method to measure the age of a stellar population requires the accurate definition of the MS-TO region in the color-magnitude diagram (CMD). In Terzan 5 this is hampered by three major problems: (i) strong differential reddening, (ii) heavy contamination from disk and bulge field stars and (iii) severe stellar crowding. To overcome these obstacles we took advantage of previous works published by our group. In particular: the high-resolution extinction map obtained in the direction of Terzan 5 (Massari et al., 2012) was used to identify regions where the color excess is the least and the most homogeneous: we excluded from the analysis all the cluster regions (as the North and the North-East portions of the system) where the reddening map shows large variations of the extinction. Once selected the most appropriate region, we also applied differential reddening corrections (following the prescriptions by Cardelli et al., 1989) to the magnitudes of all the stars detected therein. To remove possible non-member objects, we excluded all the sources with relative proper motion larger than 1.5 mas yr-1, which likely belong to the Galactic disk and bulge populations (Massari et al., 2015) 222 All the details about the proper motion determination can be found in Massari et al. (2015). Here we just recall that we used two HST-ACS datasets separated by a baseline of years, which allowed us to measure proper motions with a typical uncertainty of 0.1 mas yr at the MS-TO level, thus ensuring good precision in assessing the stellar membership. In order to remove blends, only sources with a quite symmetric brightness profile (as measured by the PSF sharpness parameter) have been considered. Moreover, to minimize the scatter, only sources within 3- from the median photometric error at different magnitude levels, in the -magnitude versus photometric error diagram, have been taken into account. Finally, we excluded the innermost and most crowded regions of the cluster, depending on the field of view and the performances of each instrument: we excluded stars with in the MAD and NIRC2 samples, those with in the ACS sample, and those with in the WFC3 sample.
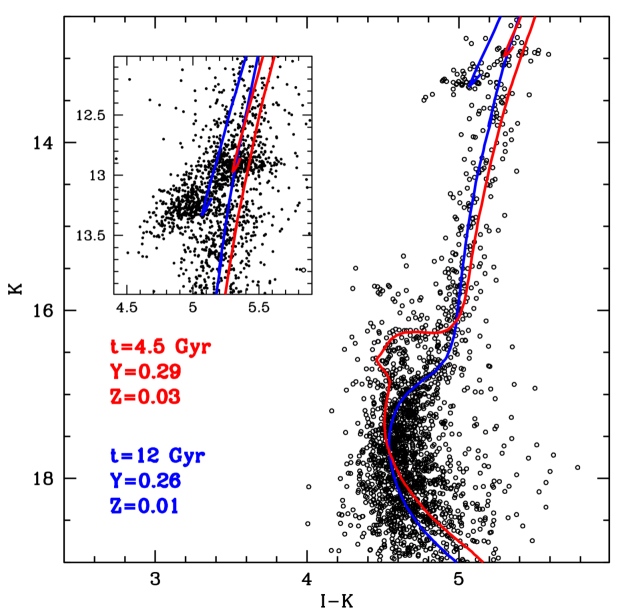
Figure 1 schematically shows the portions of the cluster field covered by each dataset and considered for the analysis. As can be seen, different portions of the South and South-West regions of Terzan 5 are sampled. Figure 2 shows the CMD of the TO/SGB region in a few planes, obtained by combining observations in different photometric bands, under the criteria described above. Although they refer to different regions of the cluster, they all show (at different levels of significance) the existence of two distinct evolutionary sequences at the MS-TO/sub-giant branch (SGB) level. The clearest one is obtained in the combined NIR/optical plane and is plotted in Figure 3: a well-defined secondary SGB is clearly emerging from the MS-TO of the dominant population at , and it merges into the red giant branch (RGB) at .
3.1 The age of the two populations
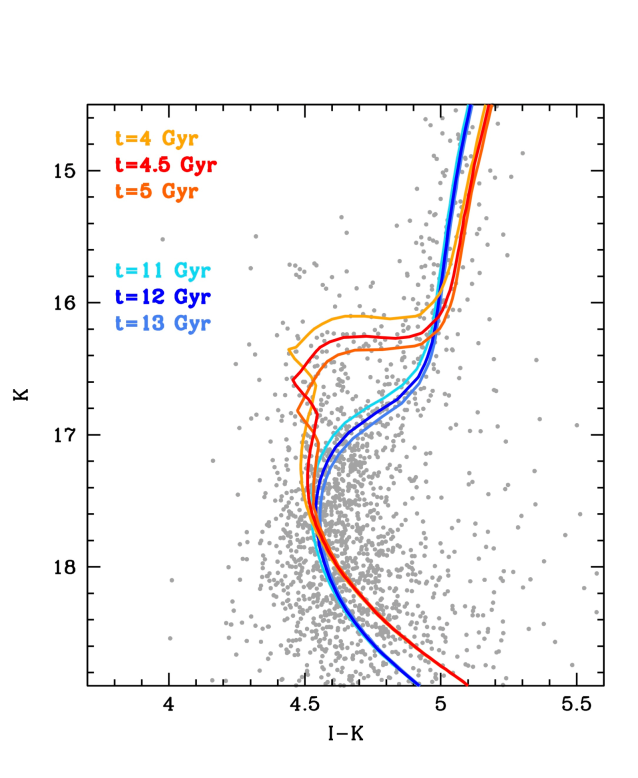
In order to determine the age of the two sub-populations hosted in Terzan 5, we searched for the best-fit isochrones reproducing the features shown in Figure 3. To this end, we assumed a distance of 5.9 kpc and a color excess (from Valenti et al., 2007), and we adopted the following procedure. The metallicity of each population ( and ) has been fixed according to the spectroscopic observations ([Fe/H] dex and [Fe/H] dex, respectively), while for the helium mass fractions, we adopted for the metal-poor component and for the super-solar one, as expected from “standard” [Fe/H] enrichment scenarios (Girardi et al., 2002). Hence, having fixed the metallicity and the helium mass fraction, the only free parameter of the fit is the age. In Figure 4 we show a set of isochrones with the adopted metallicities and helium mass fractions, and with different ages selected to match the two detected MS-TO/SGB features. In order to identify the isochrones best reproducing the observations, we performed a Chi-Square analysis. The parameter has been computed selecting a sample of stars along the MS-TO/SGB sequences of the two populations as: , where is the observed magnitude of each star and is the corresponding value of the magnitude read along the isochrone. The results are shown in Figure 5: the two distinct MS-TO/SGBs are well reproduced by two isochrones (Girardi et al., 2002) with quite different ages: Gyr for the dominant, sub-solar component, and Gyr for the extreme metal-rich sub-population.
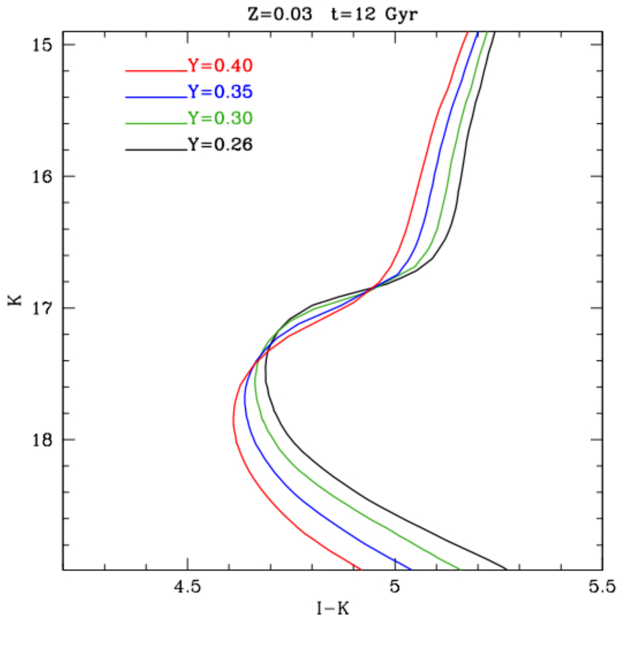
For sake of completeness, we also investigated the effect of an increased helium abundance on the isochrones. Indeed in genuine GCs there is evidence of helium abundances significantly enhanced with respect to the standard values (Piotto et al., 2007), and a large () helium content at fixed old age has been advocated (D’Antona et al., 2010; Lee et al., 2015) to explain the origin of the bright red clump observed in Terzan 5. Stellar models show that increasing the helium abundance at fixed age makes the MS-TO/SGB fainter (see Figure 6), at variance to what is needed to reproduce the secondary MS-TO observed in Terzan 5. The best fit isochrones (of 12 and 4.5 Gyr and standard helium) nicely reproduce also the location of the two red clumps, thus demonstrating that even this feature is likely due to an age difference, instead of a different helium abundance in two almost coeval populations. Hence the detection of the bright TO completely removes the possibility that the two stellar populations are due to a difference in helium and definitely breaks the helium/age degeneracy.
3.2 The radial distribution of the two populations
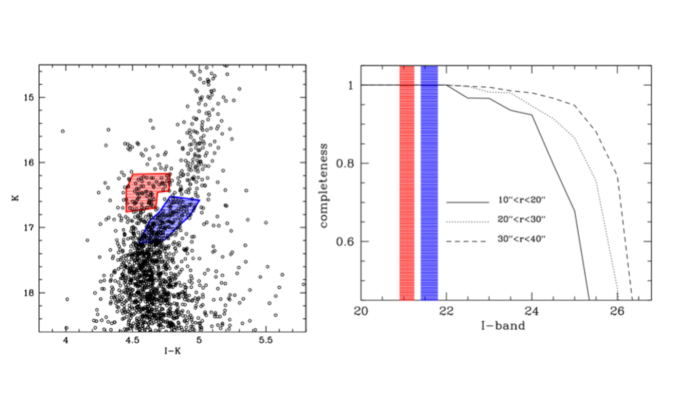
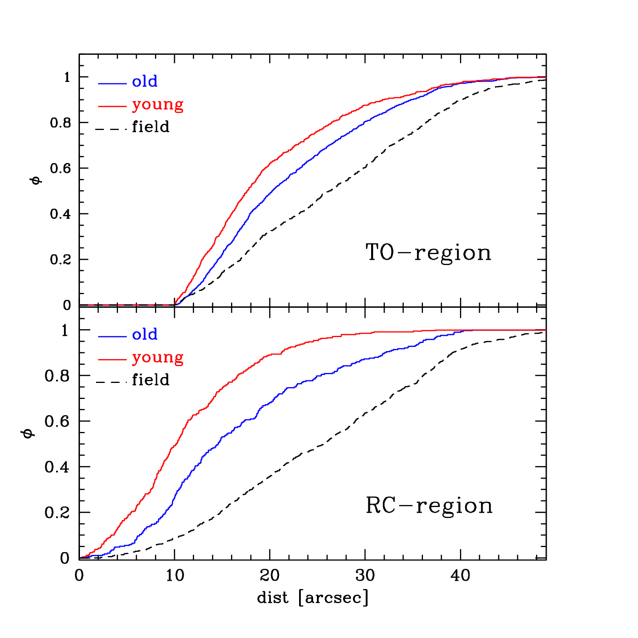
The super-solar red clump sub-population was found to be more centrally concentrated than the more metal poor one(Ferraro et al., 2009; Lanzoni et al., 2010). In order to study the radial distribution of the two MS-TO/SGB populations, we first considered the CMD shown in Figure 3, where the two sequences are clearly distinguishable, and adopted the sample selection boxes marked as colored shaded regions in the left-hand panel of Figure 7. Then, all the stars measured in the and bands and located within the two selection boxes have been considered, with the only exception (for avoiding incompleteness biases) of the innermost stars within from the center. To investigate the completeness of the samples thus selected we followed the standard procedures of adding artificial stars to the original frames. The results obtained for the -band (providing the main source of incompleteness) are shown in the right-hand panel of Figure 7, where the two shaded strips mark the -band magnitude range of the young (, in red) and of the old ( in blue) population selection boxes. As can be seen, at these magnitude levels the completeness of both the samples is .
The final samples count about 670 stars along the young MS-TO/SGB and 900 stars along the old MS-TO/SGB. The radial distribution of the two samples is shown in Figure 8 and demonstrates that the young component is clearly more centrally concentrated than the old one. This finding is fully consistent with what found from the analysis of the double clumps (Ferraro et al., 2009; Lanzoni et al., 2010) and in agreement with what expected in the context of a self-enrichment scenario, where the younger population formed from a central concentration of gas enriched from the previous stellar generation.
In order to investigate whether Galactic field contamination significantly affects the selected populations, we estimated the field star radial distribution. Indeed, Galactic field stars are expected to be uniformly distributed over the small region covered by the observations, while any stellar populations belonging to Terzan 5 must be concentrated toward the center of the system. Hence, the field star radial distribution has been derived from a simulation of 10,000 artificial stars with a uniform spatial distribution in the observed field of view. The field distribution (black dashed lines in Figure 8) turns out to be totally incompatible with that of both the Terzan 5 sub-populations.
4 Discussion and Conclusions
Both the multi-peak iron distribution (Ferraro et al., 2009; Origlia et al., 2011, 2013; Massari et al., 2014) and the clear separation of the two MS-TO/SGBs (this paper) observed in Terzan 5 suggest that the star formation process in the system was not continuous, but characterized by distinct bursts. Dating the two main sub-populations provides the time scale of the enrichment process. After an initial period of star formation, which occurred at the epoch of the original assembly of the system ( Gyr ago) and generated the two sub-solar components from gas enriched by SNII, Terzan 5 experienced a long phase ( Gyr) of quiescence during which the gas ejected from both SNeII and SNeIa accumulated in the central region. Then, approximately 4.5 Gyr ago, the super solar component formed. This requires the Terzan 5 ancestor to be quite massive (at least a few ; Baumgardt et al. 2008). The amount of gas retained by the proto-Terzan 5 system was huge: on the basis of the observed red clump populations (Ferraro et al., 2009; Lanzoni et al., 2010), we estimate that the young component in Terzan 5 currently amounts to roughly (the same size of a 47 Tucanae-like globular cluster) corresponding approximately to of the total mass of the system.
These results definitely put Terzan 5 outside the context of genuine CGs. Indeed, apart from the overall morphological appearance, Terzan 5 shares no other property with globulars, neither in terms of chemistry (GCs show inhomogeneities only in the light-elements; Carretta et al. 2009), nor in the enrichment history and age spread of the sub-populations (the enrichment timescale in GCs is of a few yrs and their light-element sub-populations are thus almost coeval; D’Ercole et al. 2008), nor in terms of the mass of the progenitor (GCs did not retain the high-velocity SN ejecta and therefore do not need to have been as massive as Terzan 5 in the past; Baumgardt et al. 2008). If Terzan5 is not a genuine GC, what is it then?
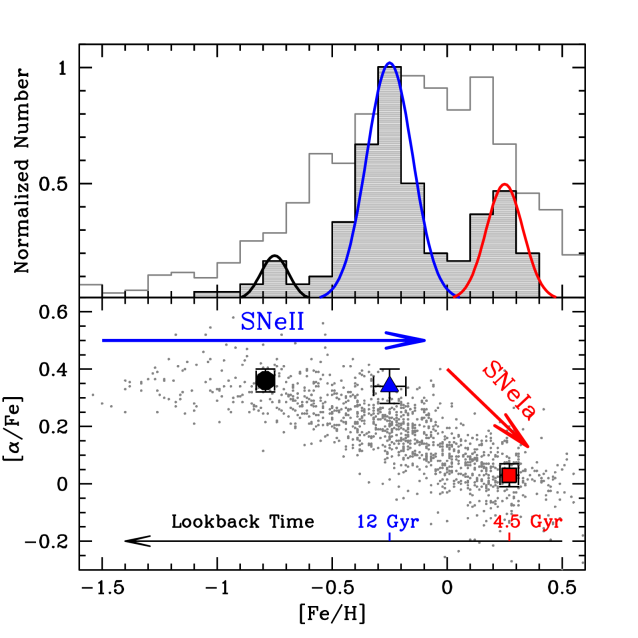
As shown in Figure 9, the metallicity distribution and chemical abundance patterns of Terzan 5 are strikingly similar to those observed in bulge stars (Gonzalez et al., 2011; Ness et al., 2013; Johnson et al., 2014; Rojas-Arriagada et al., 2014; Ryde et al., 2016): not only the iron abundance, but also the amount of -enhancement and its dependence on metallicity are fully consistent with those measured in the Galactic bulge. Note that setting such an abundance pattern requires quite special conditions. In fact, the large value of [Fe/H] () at which the Fe] vs [Fe/H] relation changes slope necessarily implies that an exceptionally large number of SNeII exploded over a quite short timescale (i.e. before the explosion of the bulk of SNeIa, which polluted the medium with iron, generating the knee in the relation). In turn, this requires a very high star formation efficiency. Indeed, the stellar populations in the Galactic halo/disk system (Chiappini et al., 1999; Matteucci & Chiappini, 2005) and in the dwarf galaxies observed in the vicinity of the Milky Way (Lemasle et al., 2012) show abundance patterns inconsistent with those plotted in the figure: they do not reach the same high iron content and the knee in the Fe] vs [Fe/H] relation occurs at much lower metallicities ([Fe/H] and [Fe/H] in the disk/halo and in dwarfs, respectively), indicating a significantly less efficient SNII enrichment process. Hence, within the Local Group, the abundance patterns shown in Figure 9 can be considered as a univocal signature of stellar populations toward the Galactic bulge.
Because of the tight chemical link between Terzan 5 and the bulge, it seems reasonable to ask whether there is any connection also in terms of stellar ages, in particular, between the super-solar (and young) population of Terzan 5 and the super-solar component of the bulge. Deep photometric studies (Clarkson et al., 2008; Valenti et al., 2013) of a few bulge fields properly decontaminated from the disk population indicate that the vast majority of the bulge is significantly old (up to is older than 10 Gyr; Clarkson et al. 2008; Nataf 2015). However, a multi-peak metallicity distribution very similar to that of Terzan 5 is observed in samples of giant, red clump, and lensed dwarf stars in the bulge (Ness et al., 2013; Rojas-Arriagada et al., 2014; Bensby et al., 2013, respectively; but see Johnson et al., 2014). Moreover, in close analogy with what found for Terzan 5, two prominent epochs of star formation are estimated for the lensed dwarfs (more than 10 Gyr ago for stars at [Fe/H], and Gyr ago for the youngest super-solar objects; Bensby et al., 2013; Nataf, 2015).
The possible presence of a younger population was also recently suggested in the photometric and spectroscopic study of the bulge within the GAIA-ESO Survey. Rojas-Arriagada et al. (2014) detected a bimodal magnitude distribution for the two RC samples with different metallicities observed in their surveyed field closest to the Galactic plane (the Baade’s Window), where geometric effects due to the X-shaped morphology of the bulge should be negligible, thus concluding that this might be due to an intrinsic age difference of the order of 5 Gyr. Interestingly enough, the difference in magnitude (), the metallicities (super-solar in the bright RC and sub-solar in the fainter one) and the proposed difference in age ( Gyr) of their two RC populations turn out to be in nice agreement with those measured in the two main sub-populations of Terzan5.
The collected evidence suggests that the proto-Terzan 5 system was a massive structure formed at the epoch of the Milky Way bulge formation. Indeed, clumps are observed in early disks at high redshifts, thus confirming that such massive structures existed in the remote epoch of the Galaxy assembling ( Gyr ago), when also Terzan 5 formed. These giant clumps are thought to form from the fragmentation of highly unstable disks, to experience intense star formation episodes over quite short timescales (less than 1 Gyr)333The possibility of such clumps to survive the energetic feedback from young stars has been critically discussed in the literature (see, e.g., Hopkins et al., 2012). However recent observations suggest that indeed these structure can survive for several yr (a lifetime of 500 Myr has been estimated by Zanella et al. (2015), thus supporting the scenario where these clumps can contribute to bulge formation. and then to coalesce and give rise to galaxy bulges (e.g., Elmegreen et al., 2008). Notably the metallicity and the -element enhancement of the high-z clumps ([Fe/H] and Fe; Pettini et al., 2002; Halliday et al., 2008) are in agreement with the values measured in the two oldest stellar populations of Terzan 5 (and in the Galactic bulge), thus suggesting that the major star formation events occurred at early epochs and over a quite short time-scale, before the bulk of SNeIa exploded. Hence the progenitor of Terzan 5 might have been one of these clumps, which survived the complete destruction. Most of the pristine gas was frenetically converted into stars within the giant clumps that populated the forming bulge. The coalescence of most of these systems in the very early epoch contributed to form the “old bulge” that we currently observe.444The proposed scenario might also naturally account for the -ray emission recently detected in the central region of our Galaxy (Brandt & Kocsis, 2015). This has been proposed to be originated by Millisecond Pulsars dispersed in the field by the dissolution of globular clusters in the early epoch of the Galaxy formation. Further support to this hypothesis is obtained by assuming that the disrupting structures were metal-rich and massive clumps similar to the proposed progenitor of Terzan 5. In fact, a high metallicity (testifying the explosion of a large number of SNeII; see Figure 9) combined with a large total mass (allowing the retention of both SNeII ejecta and neutron stars), and with a high collision rate (as measured by Lanzoni et al. (2010) for Terzan 5), makes the proto-bulge massive clumps the ideal environment for forming Millisecond Pulsars. Indeed, Terzan 5 is the stellar system hosting the largest known population of such objects in the Galaxy (Ransom et al., 2005). The large number of Millisecond Pulsars generated within the clumps and then dispersed in the bulge may therefore account for the -ray emission detected in the Galactic center. Note that, at odds with pulsars, the emission of the reaccelerated pulsars is expected (Bhattacharya & van den Heuvel, 1991) to persist for long time ( yr). However, a few of them survived the destruction. A possibility is that the proto-Terzan5 system was originally less massive (Behrendt et al., 2016) and more compact than other clumps and, because of its lower mass, it did not rapidly sink and merge in the central region, but it was scattered out to large radii by dynamical interactions with more massive sub-structures (indeed such events are observed to occur in simulations; Bournaud 2016). Thus the proto-Terzan5 clump might have evolved in an environment significantly less violent than the central forming bulge, and, as a giant “cocoon”, it may have retained a large amount of gas ejected by SNe for several Gyr, before producing a new generation of stars (such a bursty star formation histories, with long periods of quiescence, are observed in the Universe; e.g., VandenBerg et al., 2015). For instance, the most recent burst in Terzan 5 could have been promoted by a major interaction with bulge sub-structures, possibly also driving the mass-loss phenomenon that significantly reduced its mass (from the initial , to the current ; Lanzoni et al. 2010).
An alternative possibility is that Terzan 5 is the former nuclear cluster of a massive satellite that contributed to generate the Milky Way bulge via repeated mergers at high redshift (e.g. Hopkins et al., 2010). In order to account for the observed chemical abundance patterns (Figure 9), the satellite hosting the Terzan 5 progenitor should have been much more metal rich (and massive) than the dwarf galaxies currently populating the Local Group. Although such objects are not present anymore in the Milky Way vicinity (Chiappini et al., 1999; Matteucci & Chiappini, 2005; Lemasle et al., 2012), they possibly existed at the epoch of the Galaxy assembly555On the other hand, a scenario where the structure hosting the proto-Terzan 5 was accreted in a single event well after the bulge formation seems to be quite implausible, since it would require that such a structure independently experienced a chemical evolutionary history very similar to that of the bulge (see Figure 9).. Thus, the proto-Terzan 5 host might have been one of several satellites that merged together to originate the bulge (Hopkins et al., 2010). A speculation on its mass can be derived from the mass-metallicity relation of galaxies (Mannucci et al., 2009), by assuming that the satellite was somehow ( dex) more metal-poor than its nucleus (which seems to be the case at least for the most massive structures; see Figure 4 in Paudel et al. 2011). This yields to a mass of the proto-Terzan5 host galaxy of a few . Thus similar primordial massive structures (see Hopkins et al. 2010) could have contributed to the mass budget of the Galactic bulge (; Valenti et al. 2016).
The bulge formation history in general, its broad metallicity distribution and its kinematics cannot be explained within a simple scenario (either merging, dissipative collapse or some disk instability/secular evolution), but likely all these processes and perhaps others have played some role. Complexity is a matter of fact in all the galactic components, especially in the central region of the Galaxy. Any ad hoc model that neglects complexity to support one specific scenario is poorly thorough. While the presence of bar(s) and disks with complex chemistry and kinematics in the central region of our Galaxy is well established since quite a long time, an observational evidence of the existence of fossil remnants of massive clumps in our bulge, as those observed at high-z, is still lacking. Terzan 5 could be the first such evidence, providing a direct link between the distant and the local Universe and also calling for models able to account for the survival of similar structures and for the existence of a younger (minor) stellar populations in galaxy bulges. From an observational point of view, it is urged to check whether other stellar systems similar to Terzan 5 still orbit the Milky Way bulge and to constrain the amount of intermediate-age stars therein. Finally, it is also worth mentioning that the presence of massive clumps that merged/dissolved to form the bulge, or survived disruption and evolved as independent systems, does not necessarily exclude the formation (and possible secular evolution) of disks, bars and other sub-structures as those observed toward the Galactic bulge.
References
- Anderson & Bedin (2010) Anderson, J., & Bedin, L. R. 2010, PASP, 122, 1035
- Ballero et al. (2007) Ballero, S. K., Matteucci, F., Origlia, L., & Rich, R. M. 2007, A&A, 467, 123
- Baumgardt et al. (2008) Baumgardt, H., Kroupa, P., & Parmentier, G. 2008, MNRAS, 384, 1231
- Bhattacharya & van den Heuvel (1991) Bhattacharya, D., & van den Heuvel, E. P. J. 1991, Phys. Rep., 203, 1
- Behrendt et al. (2016) Behrendt, M., Burkert, A., & Schartmann, M. 2016, ApJ, 819, L2
- Bensby et al. (2013) Bensby, T., Yee, J. C., Feltzing, S., et al. 2013, A&A, 549, A147
- Bournaud (2016) Bournaud, F. 2016, Galactic Bulges, 418, 355
- Brandt & Kocsis (2015) Brandt, T. D., & Kocsis, B. 2015, ApJ, 812, 15
- Cardelli et al. (1989) Cardelli, J. A., Clayton, G. C., & Mathis, J. S. 1989, ApJ, 345, 245
- Carollo et al. (2007) Carollo, C. M., Scarlata, C., Stiavelli, M., Wyse, R. F. G., & Mayer, L. 2007, ApJ, 658, 960
- Carretta et al. (2009) Carretta, E., Bragaglia, A., Gratton, R., & Lucatello, S. 2009, A&A, 505, 139
- Chiappini et al. (1999) Chiappini, C., Matteucci, F., Beers, T. C., & Nomoto, K. 1999, ApJ, 515, 226
- Clarkson et al. (2008) Clarkson, W., Sahu, K., Anderson, J., et al. 2008, ApJ, 684, 1110-1142
- Combes & Sanders (1981) Combes, F., & Sanders, R. H. 1981, A&A, 96, 164
- Dalessandro et al. (2015) Dalessandro, E., Ferraro, F. R., Massari, D., et al. 2015, ApJ, 810, 40
- Dékány et al. (2015) Dékány, I., Minniti, D., Majaess, D., et al. 2015, ApJ, 812, L29
- D’Antona et al. (2010) D’Antona, F., Ventura, P., Caloi, V., D’Ercole, A., Vesperini, E., Carini, R., & Di Criscienzo, M., 2010, ApJ, 715, L63
- D’Ercole et al. (2008) D’Ercole, A., Vesperini, E., D’Antona, F., McMillan, S. L. W., & Recchi, S. 2008, MNRAS, 391, 825
- Elmegreen et al. (2008) Elmegreen, B. G.,Bournaud, F., & Elmegreen, D. M. 2008, ApJ, 688, 67
- Ferraro et al. (2009) Ferraro, F. R., Dalessandro, E., Mucciarelli, A., et al. 2009, Nature, 462, 483
- Ferraro et al. (2015) Ferraro, F. R., Pallanca, C., Lanzoni, B., et al. 2015, ApJ, 807, L1
- Girardi et al. (2002) Girardi, L., Bertelli, G., Bressan, A., et al. 2002, A&A, 391, 195
- Grieco et al. (2012) Grieco, V., Matteucci, F., Pipino, A., & Cescutti, G. 2012, A&A, 548, A60
- Gonzalez et al. (2011) Gonzalez, O. A., Rejkuba, M., Zoccali, M., et al. 2011, A&A, 530, A54
- Halliday et al. (2008) Halliday, C., Daddi, E., Cimatti, A., et al. 2008, A&A, 479, 417
- Hopkins et al. (2010) Hopkins, P. F., Bundy, K., Croton, D., et al. 2010, ApJ, 715, 202
- Hopkins et al. (2012) Hopkins, P. F., Kereš, D., Murray, N., Quataert, E., & Hernquist, L. 2012, MNRAS, 427, 968
- Immeli et al. (2004) Immeli, A., Samland, M., Gerhard, O., & Westera, P. 2004, A&A, 413, 547
- Johnson et al. (2014) Johnson, C. I., Rich, R. M., Kobayashi, C., Kunder, A., & Koch, A. 2014, AJ, 148, 67
- Lanzoni et al. (2010) Lanzoni, B., Ferraro, F. R., Dalessandro, E., et al. 2010, ApJ, 717, 653
- Lee et al. (2015) Lee, Y.-W., Joo, S.-J., & Chung, C. 2015, MNRAS, 453, 3906
- Lemasle et al. (2012) Lemasle, B., Hill, V., Tolstoy, E., et al. 2012, A&A, 538, A100
- Mannucci et al. (2009) Mannucci, F., Cresci, G., Maiolino, R., et al. 2009, MNRAS, 398, 1915
- Massari et al. (2012) Massari, D., Mucciarelli, A., Dalessandro, E., et al. 2012, ApJ, 755, L32
- Massari et al. (2014) Massari, D., Mucciarelli, A., Ferraro, F. R., et al. 2014, ApJ, 795, 22
- Massari et al. (2015) Massari, D., Dalessandro, E., Ferraro, F. R., et al. 2015, ApJ, 810, 69
- Massari et al. (2016) Massari, D., Fiorentino, G., McConnachie, A., et al. 2016, A&A, 586, A51
- Matteucci & Chiappini (2005) Matteucci, F., & Chiappini, C. 2005, PASA, 22, 49
- McWilliam et al. (2008) McWilliam, A., Matteucci, F., Ballero, S., et al. 2008, AJ, 136, 367
- Ness et al. (2013) Ness, M., Freeman, K., Athanassoula, E., et al. 2013, MNRAS, 430, 836
- Nataf (2015) Nataf, D. M. 2015, In Fifty Years of Wide Field Studies in the Southern Hemisphere: Resolved Stellar Populations of the Galactic Bulge and Magellanic Clouds. ASP Conference Series, Vol. 491, (San Francisco: Astronomical Society of the Pacific),p.174
- Origlia (2014) Origlia, L. 2014, Setting the scene for Gaia and LAMOST, IAU Symposium Vol 298, 28
- Origlia et al. (2011) Origlia, L., Rich, R. M., Ferraro, F. R., et al. 2011, ApJ, 726, L20
- Origlia et al. (2013) Origlia, L., Massari, D., Rich, R. M., et al. 2013, ApJL, 779, L5
- Paudel et al. (2011) Paudel, S., Lisker, T., & Kuntschner, H. 2011, MNRAS, 413, 1764
- Pettini et al. (2002) Pettini, M., Rix, S. A., Steidel, C. C., et al. 2002, ApJ, 569, 742
- Piotto et al. (2007) Piotto, G., Bedin, L. R., Anderson, J., et al. 2007, ApJ, 661, L53
- Raha et al. (1991) Raha, N., Sellwood, J. A., James, R. A., & Kahn, F. D. 1991, Nature, 352, 411
- Ransom et al. (2005) Ransom, S. M., Hessels, J. W. T., Stairs, I. H., et al. 2005, Science, 307, 892
- Saha & Gerhard (2013) Saha, K., & Gerhard, O. 2013, MNRAS, 430, 2039
- Saracino et al. (2015) Saracino, S., Dalessandro, E., Ferraro, F. R., et al. 2015, ApJ, 806, 152
- Rich (2013) Rich, R. M. 2013, Planets, Stars and Stellar Systems. Volume 5: Galactic Structure and Stellar Populations, Vol. 5, 271
- Rojas-Arriagada et al. (2014) Rojas-Arriagada, A., Recio-Blanco, A., Hill, V., et al. 2014, A&A, 569, A103
- Ryde et al. (2016) Ryde, N., Schultheis, M., Grieco, V., et al. 2016, AJ, 151, 1
- Scannapieco & Tissera (2003) Scannapieco, C., & Tissera, P. B. 2003, MNRAS, 338, 880
- Stetson (1987) Stetson, P. B. 1987, PASP, 99, 191
- Stetson (1994) Stetson, P. B. 1994, PASP, 106, 250
- Tsujimoto & Bekki (2012) Tsujimoto, T., & Bekki, K. 2012, ApJ, 751, L35
- Ubeda & Anderson (2012) Ubeda, L., Anderson, J., STScI Inst. Sci. Rep. ACS 2012-03 (Baltimore: STScI)
- Valenti et al. (2007) Valenti, E., Ferraro, F. R., & Origlia, L. 2007, AJ, 133, 1287
- Valenti et al. (2013) Valenti, E., Zoccali, M., Renzini, A., et al. 2013, A&A, 559, A98
- Valenti et al. (2016) Valenti, E., Zoccali, M., Gonzalez, O. A., et al. 2016, A&A, 587, L6
- VandenBerg et al. (2015) VandenBerg, D. A., Stetson, P. B., & Brown, T. M. 2015, ApJ, 805, 103
- Zanella et al. (2015) Zanella, A., Daddi, E., Le Floc’h, E., et al. 2015, Nature, 521, 54


| Instrument | Nexp | Filters | Epoch | Proposal | PI | |
|---|---|---|---|---|---|---|
| Telescope | (sec) | |||||
| MAD@ESO-VLT | 15 | 120 | J,K | 2008 | Science Dem. | FERRARO |
| NIRC2@KECK | 29 | 180 | K | 2010 | U156N2L | RICH |
| WFC3@HST | 64 | 300 | F110W, F160W | 2013 | GO12933 | FERRARO |
| ACS@HST | 10 | 365 | F606W, F814W | 2013 | GO12933 | FERRARO |
| ACS@HST | 2 | 340 | F606W, F814W | 2003 | GO9799 | RICH |
| ACS@HST | 10 | 365 | F606W, F814W | 2015 | GO14061 | FERRARO |