Optical Phase Imaging Using Synthetic Aperture Illumination and Phase Retrieval
Dennis J. Lee and Andrew M. Weiner
School of Electrical and Computer Engineering, Purdue University, West Lafayette, 47906 IN, USA
leedj@purdue.edu
Abstract
We perform quantitative phase imaging using phase retrieval to implement synthetic aperture imaging. Compared to digital holography, the developed technique is simpler, less expensive, and more stable.
OCIS codes: (170.0180) Microscopy, (100.5070) Phase retrieval, (110.1758) Computational imaging.
Optical phase imaging finds important applications in biomedical imaging where samples are often transparent and weakly scattering. Once the phase and complex field are known, label-free cell imaging, numerical refocusing, and differential interference contrast can be performed [3, 4, 5].
An important concern in any imaging system is resolution. The technique called synthetic aperture imaging illuminates a sample at multiple angles and measures a complex field image at each angle. Conceptually, each angular field covers a different portion of frequency space. Effectively, the numerical aperture is increased. Currently this technique is implemented using digital holography. Although digital holography is commonly used, it does have its disadvantages. The reference arm adds more parts, cost, and complexity. For example, the phase shifting interferometry in [3] requires AOMs to upshift the reference beam and a high frame rate camera to capture the phase-shifted images.
We propose to implement synthetic aperture imaging using phase retrieval. A separate reference beam is not required, which aids stability. The measurements are based on defocused intensity images, which does not require an expensive high frame rate camera. Fewer components are required, which
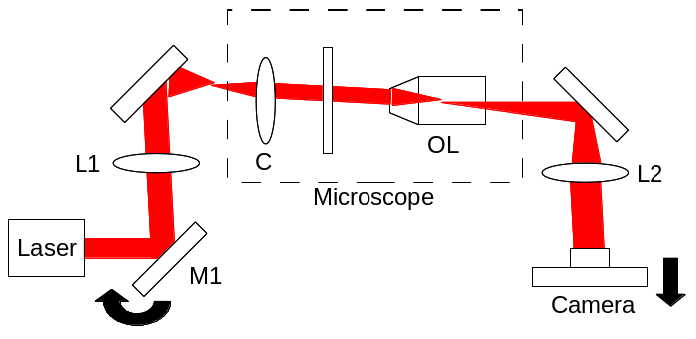
L1: lens (f = 300 mm); C: condenser lens (NA 1.4); OL: objective lens (NA 0.75); L2: tube lens (f = 200 mm).
reduces cost. Our setup is shown in Fig. 2. Mirror M1 is a motorized gimbal mount which steers the beam at different angles to provide oblique illumination at the sample. The sample is imaged on a camera which is mounted on a translation stage to defocus the sample.
We process these defocused images using phase retrieval based on an iterative algorithm [6, 7]. We start in the first plane with complex amplitude and phase . We numerically propagate the complex amplitude at plane to plane and extract phase . We update the complex amplitude as . This propagate and update procedure is repeated as many times as necessary. Convergence is checked by numerically propagating the retrieved field and comparing with measured intensities. For each angle of illumination, we apply this procedure to calculate phase and the complex field. We sum the complex fields at each angle to calculate the synthesized field. The synthesized phase is the phase of the synthesized field. In our experiment, for each angle, we measure 11 intensity images at planes separated by 2.1 , symmetric about the focal plane at . The samples are 10 polystyrene beads (n = 1.587) immersed in oil (n = 1.515).
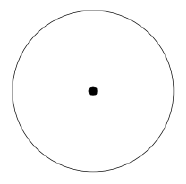
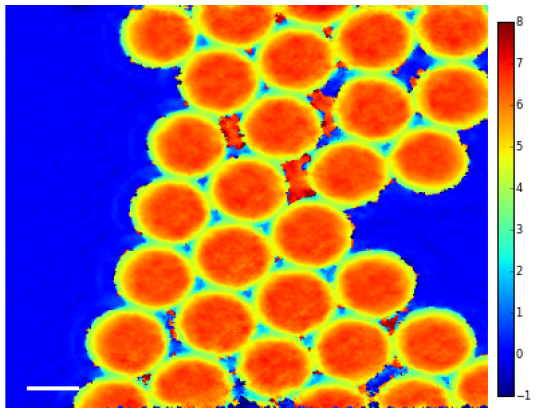
The simplest test is to measure a single angle at
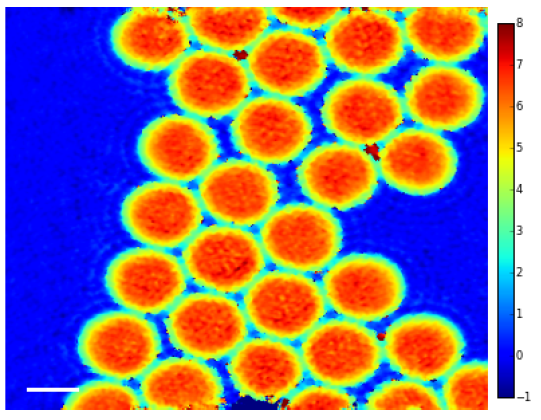
illumination (Fig. 2(a)). Figure 3 shows the resulting phase image, which agrees with refractive index calculations. The wrapped phase image most clearly exhibits diffraction noise, evidenced by the diffraction
rings and speckle-like patterns inside the beads. For reference, we also measure phase with off-axis interferometry (Fig. 5), which shows approximately the same phase shift at the center of the beads.
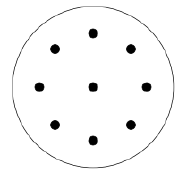
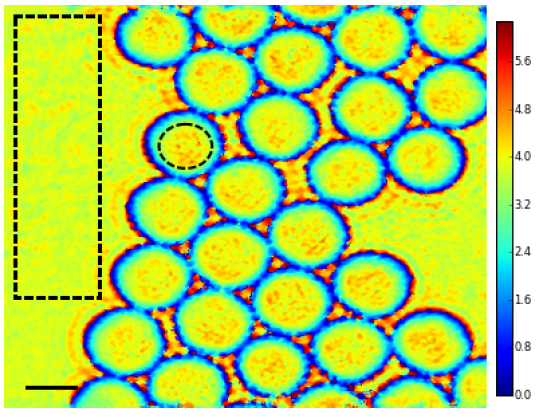
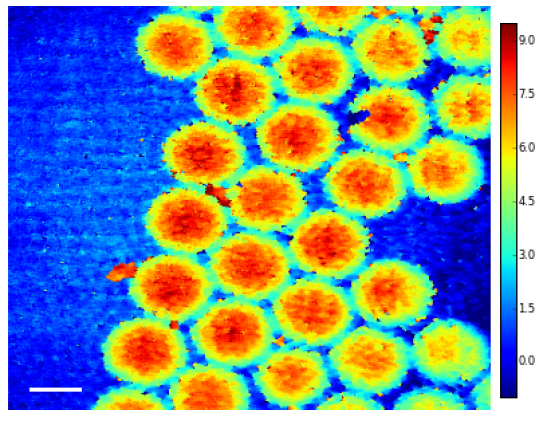
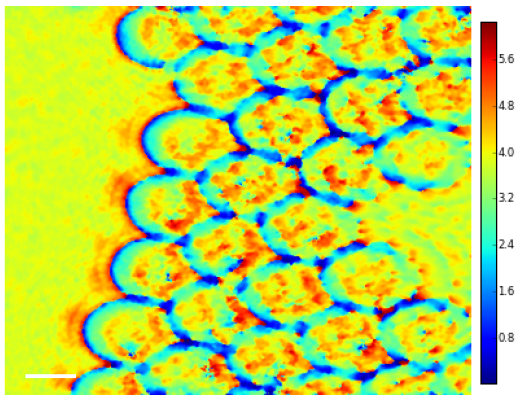
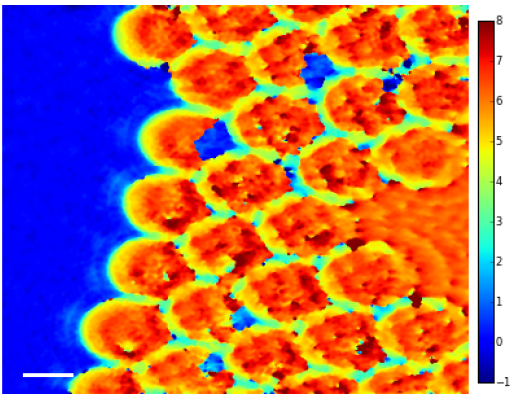
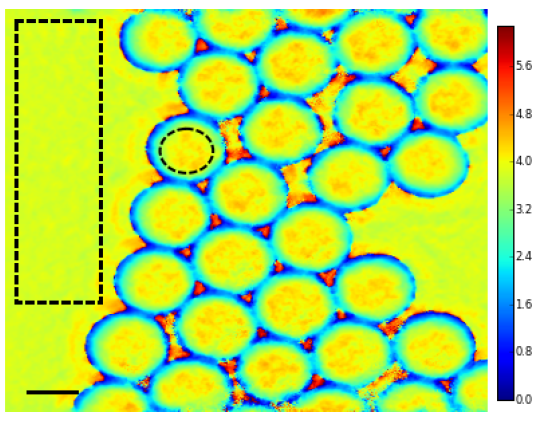
In test case 2, we measure 9 total angles by scanning the beam at the back focal plane of the condenser (Fig. 2(b)). The beam is scanned in an approximate circle pattern so that the largest angle of illumination is at the sample. Note the angular spectra overlap between angles. For each angle we measure a phase image. Figure 5 shows a phase image at . Although there are unwrapping errors, the figure illustrates the basic idea. Since the beam is oblique to the camera, the beads appear elongated [3, 8]. To the best of our knowledge, this work is the first experimental demonstration of phase retrieval on an obliquely illuminated sample. Next we add the measured complex fields at each angle to form the synthesized field, with the background phases set equal. Figure 6 shows the synthesized phase. Compared to test case 1 (Fig. 3), the phase image displays reduced diffraction noise; the diffraction rings and phase speckle features inside the beads are mitigated. We measure the phase variance inside the bead (dashed circle) for Fig. 3 ( and for Fig. 6 (); the phase speckle noise reduced by 60%. We also measure the background variance (dashed rectangle) for Fig. 3 () and for Fig. 6 (); the background noise reduced by 83%.
We have demonstrated the principle of using phase retrieval to implement synthetic aperture imaging. Our experiment used a 0.75 NA objective; it can be extended to the 1.4 NA used in [3]. Our approach enables resolution enhancement without needing an expensive high NA objective. Overall this new imaging technique is simpler, less expensive, and more stable than digital holography, and it paves the way for other applications such as tomographic phase microscopy to be enabled by phase retrieval.
References
- [1]
-
[2]
- [3] M. Kim, et. al., J. Biomed. Opt. 17(2), 026003 (2012).
- [4] P. Marquet, et. al., Opt. Lett. 30, 468 (2005).
- [5] B. Rappaz, et. al., Opt. Express 13, 9361 (2005).
- [6] G. Pedrini, et. al., Opt. Lett. 30, 833 (2005).
- [7] P. Almoro, et. al., Appl. Opt. 45, 8596 (2006).
- [8] W. Choi, et. al., Nat. Methods 4, 717 (2007).
- [3] M. Kim, et. al., J. Biomed. Opt. 17(2), 026003 (2012).
- [9]