Hyperfine and crystal field interactions in multiferroic HoCrO3
Abstract
We report a comprehensive specific heat and inelastic neutron scattering study to explore the possible origin of multiferroicity in HoCrO3. We have performed specific heat measurements in the temperature range 100 mK–290 K and inelastic neutron scattering measurements were performed in the temperature range 1.5–200 K. From the specific heat data we determined hyperfine splitting at 22.5(2) eV and crystal field transitions at 1.379(5) meV, 10.37(4) meV, 15.49(9) meV and 23.44(9) meV, indicating the existence of strong hyperfine and crystal field interactions in HoCrO3. Further, an effective hyperfine field is determined to be 600(3) T. The quasielastic scattering observed in the inelastic scattering data and a large linear term mJmol-1K-2 in the specific heat is attributed to the presence of short range exchange interactions, which is understood to be contributing to the observed ferroelectricity. Further the nuclear and magnetic entropies were computed to be, Jmol-1K-1 and 34 Jmol-1K-1, respectively. The entropy values are in excellent agreement with the limiting theoretical values. An anomaly is observed in peak position of the temperature dependent crystal field spectra around 60 K, at the same temperature an anomaly in the pyroelectric current is reported. From this we could elucidate a direct correlation between the crystal electric field excitations of Ho3+ and ferroelectricity in HoCrO3. Our present study along with recent reports confirm that HoCrO3, and CrO3 ( Rare earth) in general, possess more than one driving force for the ferroelectricity and multiferroicity.
pacs:
75.40.-s, 31.30.Gs, 71.70.Ch, 28.20.Cz1 Introduction
Perovskite chromites CrO3, where is a rare earth element or yttrium are revisited in the recent years as possible multiferroic materials in which multiple ferroic orders such as ferroelectricity and antiferromagnetism coexist as discussed below [1, 2, 3, 8, 4, 5, 6, 7]. Compared to perovskite manganites, which are well studied in light of multiferroicity, the microscopic physical properties of chromites are not explored in detail and the mechanism for multiferroicity in HoCrO3 is still under debate. The coexistence of ferroelectric and magnetic orders in rare-earth orthochromites was first suggested by Subba Rao [9]. Based on dielectric studies it is reported that the heavy rare earth chromites, CrO3 (=Ho, Er, Yb, Lu) undergo a ferroelectric transition in the temperature range K [2]. In a recent article, electrical polarization and magnetodielectric effect studies are reported for polycrystalline LuCrO3 and ErCrO3 [6]. Although both LuCrO3 and ErCrO3 showed the presence of a polar state induced by magnetic ordering below , polarization was not affected by applied magnetic fields, so that the magnetoelectric coupling was not evident in these compounds. Further, the magnetodielectric effect observed in the case of ErCrO3 is one order of magnitude higher compared with LuCrO3 reflecting the role of different magnetism of rare-earth cations in ferroelectricity [6].
Recently, Ghosh et al., have studied the ferroelectric properties of polycrystalline HoCrO3 by measuring the thermal variation of pyroelectric current [8]. It was found that pyroelectric current exhibits its maximum value around the antiferromagnetic transition temperature K, nevertheless, the ferroelectric order temperature which associated with the emergence of spontaneous electric polarization is observed at a higher temperature of K. The atypical multiferroic behavior observed in HoCrO3 is argued to be a result of Ho displacements and oxygen octahedral rotations in the non–centrosymmetric space group [8, 4, 10, 11]. The role of the rare earth ion in determining the physical properties of chromites CrO3 was revealed in a recent communication where the origin of ferroelectricity in orthochromites has been attributed to the instability of the symmetric position of the rare earth ion [5]. The interaction between magnetic rare earth and week ferromagnetic Cr3+ ions is the driving force for the breaking of symmetry, and thus the emergence of multiferroic behavior in these systems [5, 7]. Despite a debatable multiferriocity, orthochromites possess a plethora of physical phenomena, providing excellent opportunities to study and understand the basic interactions in materials. The detailed knowledge on the properties of rare earth ion is of particular importance to understand the multiferroicity in rare earth chromites CrO3.
The rare earth orthochromites crystallize in a distorted orthorhombic perovskite structure with four formula units per unit cell [12, 13, 14]. In HoCrO3 the exchange coupling between the Cr3+ nearest neighbors is predominantly antiferromagnetic and they order magnetically below the Néel temperature of K [15]. On the other hand, earlier reports differ on the aspect of Ho-ordering. Cooperatively induced ordering of Ho in HoCrO3 was reported at 12 K [15, 16] whereas no ordering was observed by Hornreich , down to K [17]. Ferroelectricity is observed in CrO3 systems only when the ion is magnetic. This directly suggests the exchange interaction between Cr3+ and is very important in inducing polarization and warrants the study of the local distortions around the ion as well as its magnetic properties. Hence, we have chosen HoCrO3 as our subject to investigate the role of rare earth in the magnetic and thermodynamic properties of chromites.
2 Experimental details
Polycrystalline HoCrO3 was synthesized by solid state reaction of Ho2O3 (3N) and Cr2O3 (4N) in stoichiometric ratio. The precursors were mixed intimately and subsequently heat treated at 1100 ∘C for h. Then, the material was reground and annealed again at C for h. The phase purity of the synthesized powder sample was confirmed by powder x-ray diffraction (PXRD) with Cu- () radiation, using a Huber x-ray diffractometer (Huber G) in transmission Guinier geometry. The profiles of the PXRD data were analyzed using the Rietveld method [18] implemented in the software suit [19]. This confirmed the formation of orthorhombic single phase. The powder was then pressed into pellets and sintered at C for h for further magnetic and thermal characterization. The heat capacity was measured in the temperature range from mK to K using a commercial Quantum Design Physical Property Measurement System equipped with a dilution insert. The heat capacity values were extracted using the relaxation method [20]. The background heat capacity of the microcalorimeter and the Apiezon grease used for thermal conduction was measured before the sample measurement and subtracted from the raw data to obtain the absolute heat capacity of the sample.
Inelastic neutron scattering (INS) measurements were carried out on the BASIS backscattering spectrometer of the Spallation Neutron Source (SNS), Oak Ridge National Laboratory, USA [21]. More details of this measurement is presented in reference [22]. Inelastic neutron scattering experiments were also carried out on the high–resolution time–of–flight spectrometer FOCUS at the Spallation Neutron Source SINQ at PSI, Villigen in Switzerland. The polycrystalline sample was enclosed in an aluminum cylinder ( mm diameter, mm height) and placed into a He – cryostat and the spectrum was collected using an incident energy of meV. Additional experiments were performed for the empty container as well as for vanadium to allow the correction of the raw data with respect to background, detector efficiency, absorption and detailed balance according to standard procedures. Inelastic data reduction and analysis was carried out using the software DAVE [23].
3 Results and discussion
3.1 Crystal Structure
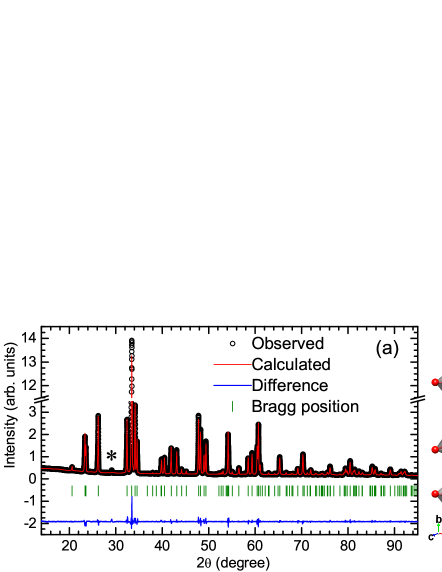
The Rietveld refinement of room temperature PXRD data is presented in Fig. 1(a), and the results are tabulated in table 1. Using Shannon–radii values for the ions [24] the value of the tolerance factor for HoCrO3 is found to be . Accordingly HoCrO3 is an orthorhombically distorted perovskite with the space group [12, 13, 14]. The crystal structure at K is in good agreement with the previously determined orthorhombic structure with similar lattice parameters [25, 8]. The unit cell parameters obey the relationship, which is characteristic of –type orthorhombic structures. A buckling of the network of octahedra corresponding to cooperative rotation about a –axis leads to the –type orthorhombic structure. The clinographic view of the CrO6 octahedra in HoCrO3 is presented in Fig. 1(b). In perovskite manganites MnO3 ( = La, Pr, Nd, Sm, Eu, Gd, Tb and Dy), in addition to the distortion due to buckling of the MnO6 octahedron, a second distortion also arises because of the Jahn–Teller effect. This is because the Mn3+ in MnO3 with four unpaired electrons the –shell in high spin state is Jahn–Teller active. On the other hand Cr3+ in chromites with three unpaired electrons in -orbitals is Jahn–Teller inactive. Thus a contribution to the lattice distortion in CrO3 due to the Jahn–Teller effect is ruled out.
| Atoms | x | y | z | Biso (Å2) |
|---|---|---|---|---|
| Cr | 0 | 0 | 0.815(2) | |
| Ho | 1.031(3) | |||
| O1 | 1.037(5) | |||
| O2 | 1.152(1) |
| Unit Cell Dimensions | |||
|---|---|---|---|
| Discrepancy Factors | |||
|---|---|---|---|
3.2 Specific heat
The variation of the specific heat () of HoCrO3 with temperature is presented in Fig. 2. The low temperature features in can be visualized clearly in a log-log plot as shown in the inset of Fig. 2. The direct inspection of the specific heat curve evidences the presence of three main contributions or features: (1) a sharp increase in specific heat below K with a maximum at K due to anomalously large hyperfine interaction between the electronic and nuclear spins of 165Ho3+ leading to a nuclear-Schottky specific heat (); (2) the electronic Schottky contribution () from thermal depopulation of the ground state multiplet of Ho3+ with a maximum at K; and (3) the –like anomaly with a peak at 142 K due to the magnetic ordering of the Cr3+ moments. To determine different contributions to , a detailed analysis was performed in two steps, first was modeled in the temperature range K and then K.

3.2.1 Specific heat in the temperature range
The specific heat below K has two broad features with maxima around K and K. From the low temperature specific heat measurements of Ho metal it was found that anomalously large hyperfine interaction between the electronic and nuclear spins of Ho commonly leads to a nuclear Schottky anomaly with a maximum at K [26]. The Hamiltonian for hyperfine interactions can be written in the form [27]:
| (1) |
where, is the magnetic hyperfine constant, which is a measure of the strength of the hyperfine interaction between the nuclear moment and the magnetic moment associated with the 4 electrons. is the quadrupolar coupling constant. The field is applied in the direction. Since the projection can take values, i.e. , the hyperfine specific heat will be a Schottky type specific heat, associated with the hyperfine levels. The nuclear spin of 165Ho with 100% natural abundance is , while 53Cr with has a natural abundance of 9.5%. One can calculate the mean square of effective nuclear moment for the natural abundance of active isotopes of Ho and Cr, , yielding for 165Ho and for Cr. With these effective nuclear moments one can conclude that the Cr hyperfine contribution is about three orders of magnitude smaller than the Ho one. Thus only the Ho contribution is taken into account in the calculation of nuclear hyperfine contribution to the specific heat. Due to the hyperfine interaction the holmium nucleus has possible spin orientations relative to an effective field . The energies of various nuclear spin states, i.e. the eigenvalues of the Hamiltonian in equation (1) are
| (2) |
where, . Information about and can be obtained by measuring the heat capacity at sufficiently low temperatures. In case of holmium, the quadrupolar coupling contribution is small and can be neglected [28]. Therefore for the equation (2) reduces to,
| (3) |
The specific heat in the temperature range K is modeled by taking into consideration the contributions from nuclear specific heat , an electronic Schottky term and a lattice term . Thus at low temperatures the of HoCrO3 is given by,
| (4) |
where, and are given by the general expression for an n-level Schottky specific heat term given by [29]:
| (5) |
In this expression, and Jmol-1K-1 is universal gas constant. To calculate the nuclear specific heat , a Schottky curve for 165Ho with =7/2, eight equally spaced energy levels with splitting energy, , where , is used. To calculate the electronic Schottky specific heat , a simple two level Schottky term with energy splitting is used, as the contribution from higher energy terms is negligible in the temperature range K. In this temperature range the lattice contribution is expressed by a single Debye term. At low temperatures, when , the Debye temperature, the Debye specific heat can be represented by well-known Debye T3–law as [29],
| (6) |
where, is the number of atoms per molecule.
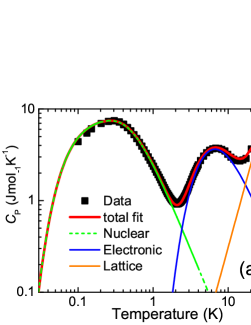
The fit results to equation (4) are given in Fig. 3 (a). From the fit the values of electronic Schottky splitting energy and the Debye temperature are found to be, 1.379(5) meV and K, respectively. The Schottky energy 1.379(5) meV is consistent with earlier reports based on specific heat measurements [16] and optical absorption Zeeman spectroscopy [30]. The value of from our analysis is found to be 0.2615(6) K which is slightly smaller compared to the value found in metallic Ho, K [31, 32, 26], in inter-metallic HoCo2, K [33] and in paramagnetic salts, K [31]. The energy difference between two adjacent nuclear levels due to hyperfine field thus calculated from equation (3) is eV. From inelastic neutron scattering measurements it is possible to observe these energy levels directly, as an inelastic peak centered at eV. Similar observations were made in spin–ice compound Ho2Ti2O7 which shows a nuclear Schottky peak around K in the specific heat data [34], which was later observed in inelastic neutron scattering measurements as a peak at eV [35]. The effective magnetic (hyperfine) field at the holmium nuclei can be computed by writing [32],
| (7) |
where, for 165Ho and is the nuclear magneton ( JT-1). Using the value of in equation (7) the hyperfine field, is found to be T. This value is comparable to the values reported for Ho2Ti2O7 (720 T) [34], metallic Ho (770 T) [32] based on specific heat data and in ErCrO3 (530 T) [36] based on Mössbauer spectroscopy.
The nuclear specific heat was obtained by subtracting the lattice and electronic contributions from . The entropy associated with the nuclear specific heat was calculated by the numerical integration of . is given by the expression,
| (8) |
The versus and the computed are presented in Fig. 3(b). The nuclear entropy reaches a maximum value of Jmol-1K-1 at K. The theoretical limiting value of entropy for 165Ho with nuclear spin is calculated as Jmol-1K-1. It is shown as an horizontal dashed line in Fig. 3(b). An excellent agreement between the experimental with the theoretical value suggests that only contribution to the low temperature peak in the specific heat is from the nuclear Schottky term due to hyperfine interactions.
3.2.2 Specific heat in the temperature range, .
The non-magnetic contribution to the specific heat in the temperature region K is fitted assuming the contributions from an electronic Schottky term , lattice term and a linear term . HoCrO3 has 5 atoms per formula unit, which implies that 15 vibrational modes to the phononic specific heat exist. Taking in to account this constraint, we approximate the lattice contribution to the specific heat () as sum of a Debye term () and two distinct Einstein terms . The specific heat associated with the magnetic ordering, () results in a –like transition with a maximum at K. is obtained by subtracting from the experimental data (). The magnetic entropy associated with is obtained by the numerical integration of . The and in the temperature range K can be written as [29, 37],
| (9) | |||
| (10) | |||
| (11) |
Here is purely electronic Schottky term as we are fitting only above 2 K, where the nuclear contribution is negligible. The non-magnetic contribution to the specific heat in this temperature is obtained by equations (5), (9), (10) and,
| (12) | |||
| (13) | |||
| (14) |
In these expressions, is the gas constant, = , = , is Boltzmann constant, is the coefficient of the linear term and is the number of atoms per molecule. The fitting was performed excluding the data in the temperature range 60–200 K. The different contributions to the measured specific heat obtained from fitting are presented in Fig. 4(a). The values of Debye temperature and two Einstein temperatures (, ) obtained from the fit are K (46(1) meV) and K (67(1) meV) and K (15.17(2) meV), respectively. This contribution to was parametrized by using 3 Debye modes with Debye temperature (), 7 Einstein modes with Einstein temperature , and another 5 Einstein modes with . Although the used parametrization over simplify the phonon spectrum, the obtained key results are not influenced by subtleties in the choice of the modeled lattice contribution, i.e., by the number of Debye and Einstein contribution or by the used absolute values within reasonable error bars [38].
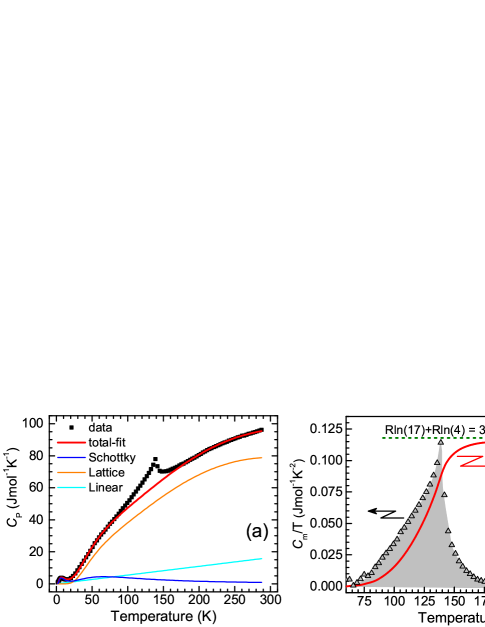
Based on optical absorption spectroscopy [30], magnetization and magnetic susceptibility [17], specific heat [39], elastic neutron diffraction [40] and inelastic neutron scattering (INS) [41] experiments five electronic Schottky levels were observed in HoCrO3 with the fifth level being at K (23.4 meV). To calculate , a Schottky curve for five energy levels is used which contribute to below K. The ground state energy level is assumed to be zero i.e., . From the low temperature specific heat analysis, where a simple two level Schottky model was used to calculate , the energy splitting is found to be 1.379(5) meV. We fixed this value as in the present calculations. The higher energy levels are determined from the fit as = meV, = meV and = meV. These values are in excellent agreement with the reported crystal field energy values in HoCrO3 (within 0.5).
After subtracting the contributions, , and from the total specific heat , the magnetic specific heat is obtained, which can be seen as the deviation from the total fit in Fig. 4(a) in the temperature range K. The magnetic entropy, was calculated by the numerical integration of analogous to the expression (8), by replacing by . The versus and computed is presented in Fig. 4(b). The experimental magnetic entropy value reaches a maximum value of 34 Jmol-1K-1 around 180 K, above . The theoretical limiting value of was calculated by adding the contributions due to ordering of both Ho3+ () and Cr3+ () moments, i.e., Jmol-1K-1, indicated as a horizontal dotted line in Fig. 4(b). The experimental magnetic entropy is very close to the theoretical magnetic entropy around 180 K . The good agreement between the experimentally found value for the magnetic entropy and that calculated for the spin only component of Cr3+ ions and orbital magnetic moment of Ho3+ ions, allows for concluding the following: first, the orbital moments of Cr3+ ions appear to be quenched while keeping the full spin moment. Second, the lattice contribution seems to be described sufficiently well by the Debye and Einstein models.
The value of linear coefficient from the fit is found to be mJmol-1K-2. This value of is comparable to the reported values, mJmol-1K-2 which is associated with conduction electrons in some doped manganites [42, 43, 44, 45]. The linear coefficient is usually attributed to charge carriers, and is proportional to the density of states at the Fermi level. However, HoCrO3 is an electrical insulator, thus the origin of linear term should be interpreted with caution. Several electrical insulators have been reported with large values of , viz., LaMnO3+δ ( mJmol-1K-2) [46], BaVS3 ( mJmol-1K-2) [47] and La2.3YCa0.7Mn2O7 ( mJmol-1K-2) [48]. The origin of a linear contribution in these electrical insulators was attributed to a variety of magnetic phenomena. The most plausible explanation for the appearance of a linear term in the heat capacity in HoCrO3 is due to disordered Ho3+ as in the case of insulating Ho1-xYxMnO3. For this compound it was observed that with increasing Y content is reduced and drops to zero at , indicating the dependence of on the Ho content [49]. It was interpreted that the appearance of the linear term is due to high degeneracy of disordered Ho3+ spins above the ordering temperature. From high resolution neutron spectroscopy a huge quasielastic scattering was observed in HoCrO3, which was understood as due to fluctuating disordered Ho electronic moments [22]. This supports our interpretation of disordered Ho electronic moments as a possible source of a linear term in the observed specific heat. It is worth noting at this point that, to model the low temperature specific heat data using equation (4), a linear term was not required which can be understood due to spin ordering of Ho3+ at these low temperatures [50]. These observations confirm that the main origin of the linear term in HoCrO3 is disordered Ho3+ spins.
3.3 Inelastic neutron scattering
Inelastic neutron scattering spectra measured at the BASIS back–scattering spectrometer are presented in Fig. 5(a). At low temperatures two clear inelastic signals are observed on both energy gain and energy loss sides. A detailed study of the hyperfine spectra of HoCrO3 is published elsewhere [22]. The inelastic spectra was modeled with the equation,
| (15) |
where, delta function and represent elastic and inelastic peaks, respectively. These terms are convoluted numerically with the experimentally determined resolution function, , which is asymmetric due to the neutron pulse shape. is a flat background term and are scaling factors. The average energies of the inelastic peaks as obtained from the fits are eV, this is in excellent agreement with the hyperfine splitting energy, eV determined from our low temperature specific heat data. The fitting result to the 1.5 K data is presented in Fig. 5(b). As can be seen from Fig. 5(a) a strong quasielastic scattering signal arises with increasing temperatures, broadening the elastic peak. An additional Lorentzian term was required to describe this intensity. The temperature evolution of the quasielastic term was attributed to fluctuating electronic moments of the Ho ions, which get increasingly disordered at higher temperatures. This reassures the validity of the large linear coefficient obtained by fitting the specific heat data at higher temperatures. From our earlier detailed report on the temperature dependence quasielastic scattering in HoCrO3 [22] we found that the intensity decreases sharply below 40 K. Further the temperature dependence of ordered magnetic moment of Ho obtained from our recent neutron powder diffraction measurements [50], varies inversely as the temperature dependence of quasielastic scattering intensity and shows a sharp increase below 40 K. This confirms that the origin of quasielastic scattering is indeed fluctuating Ho moments which are short range in nature. A similar phenomenon was also observed in Ho2Ti2O7, the authors have interpreted it as being due to the fluctuating electronic moments of the Ho [35]. Wan et al., [51] showed both analytically and numerically that indirect magnetic exchange, which is short-range in nature is another driving force for the off-center atomic motion and ferroelectricity. In the present case, proposed short-range magnetic exchange interactions could cause the off-center atomic motion leading to ferroelectricity. We will report a detailed nuclear and magnetic structure studies as a function of temperature elsewhere, which should shed more light on atomic displacements and short range magnetic order in HoCrO3.
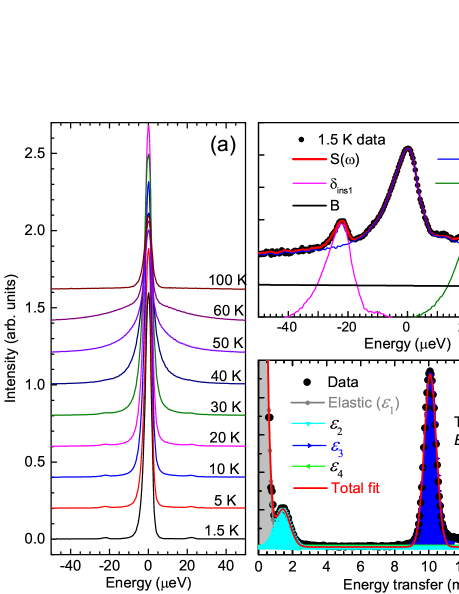
A typical inelastic spectrum measured at the time–of–flight instrument FOCUS is presented in Fig. 5(c). The non-Kramer’s Ho3+ ions in HoCrO3 are at sites of point group symmetry (C1h), which typically leads to a singlet ground state. Thus the ground multiplet of the Ho3+ ion, , split into singlets by the crystalline field generated by surrounding ions. The energy range of our inelastic data, limited to only three crystal field levels, makes a crystal field calculation inadequate using a point–charge model. Despite that, the observed inelastic peaks, fitted with Gaussian peak functions as shown in Fig. 5(c), are centered at energies, meV, meV and meV are in excellent agreement with those determined from heat capacity data and reported values [41].
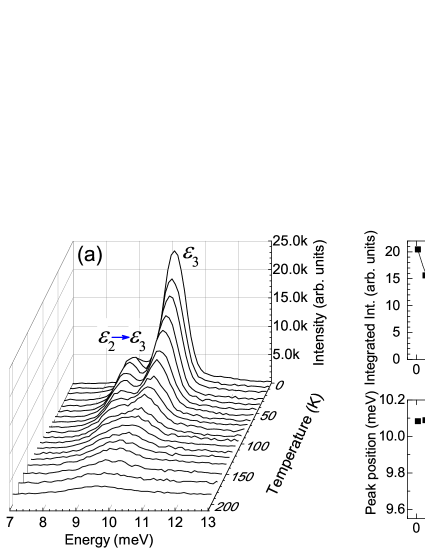
The hyperfine excitation signal which is masked gradually by quasielastic scattering upon increasing temperature, in contrast, the Crystal Electric Field (CEF) excitation signal is still visible in high temperature range. The temperature evolution of inelastic peak associated with the CEF excitation between ground state () and the second excitation level () is presented in Fig. 6(a). The inelastic peak due to transitions between first excitation level () and the second excitation level () can also be seen (above 10 K). Two inelastic peaks were simultaneously fitted with Gaussian peak function, both the peaks are well separated in all temperatures below 100 K above which the peak due to the transition between first excitation level () and the second excitation level () vanishes. The integrated peak intensity as a function of temperature for the peak corresponding to crystal field excitation is plotted in Fig. 6(b). It exhibits a typical behavior of Van Vleck contribution below and a clear anomaly at = 140 K. Given the fact that the CEF interaction reflects directly the electrical and magnetic potential created by neighboring ions, the anomaly of peak intensity around indicated the change of local environment surrounding the Ho3+ ion in HoCrO3. Because both Cr and Ho moments order below , the anomaly on peak intensity can be mainly attributed to the effect of exchange field on the Ho3+ ion from the long range order of Cr3+ magnetic sublattice. Rajeswaran et al., [5] proposed that the multiferroicity in CrO3 is caused by the interaction between magnetic rare earth and weak ferromagnetic Cr3+ ions following the breaking of symmetry. The observed anomaly in CEF signal strengthens the importance of Ho-Cr exchange striction. The anomaly in 6(b) also implies the possible distortion of Ho ions and their surroundings since the pyroelectric current exhibits its maximal at the same temperature [8].
The temperature dependence of peak position is shown in Fig. 6(c). In the temperature range 1.5 – 60 K, the peak position remains unchanged at 10.1 meV and starts moving gradually to lower energy, above 60 K, which is well below . The change of peak position of CEF excitation at 60 K hints at the shift of CEF levels accompanied with the change of local crystallographic symmetry of Ho3+ ion. However, so far there is no report on the observation of structural distortion for HoCrO3 at 60 K. It is noticed that a tiny peak is observed at the same temperature in pyroelectric current curve, as shown in Fig. 5(a) in the ref. [8]. Therefore, the change of CEF peak position at 60 K is related to the change of ferroelectric properties. A detailed study on the temperature–dependent crystal structure is needed to understand the unusual behavior of CEF excitation and thus the mechanism of multiferroicity in HoCrO3.
4 Summary and conclusions
High quality polycrystalline HoCrO3 was prepared by solid state reaction method and characterized by means of x-ray powder diffraction, heat capacity and inelastic neutron scattering measurements. From the structural analysis we could establish the consistency of the observed crystal structure and theoretical predictions based on Goldschimdt’s tolerance factor rule. From the low temperature nuclear contribution to the specific heat results we obtained the first CEF excitation energy for Ho3+, 1.379(5) meV and hyperfine field of 600(3) T with a hyperfine splitting energy, 22.5(2) eV for 165Ho with =. The entropy () associated with nuclear hyperfine specific heat () was also estimated from the low temperature specific heat, which is in excellent agreement with theory. The hyperfine splitting energy determined from specific heat data is then confirmed from the peak observed in inelastic back scattering data. The large linear term mJmol-1K-2 in the specific heat was understood as due to disordered Ho3+ spins, which is further supported by strong quasielastic scattering observed in inelastic backscattering data at high temperatures. From the analysis of high temperature specific heat, by fixing the first CEF excitation level to 1.379(5) meV, obtained from low temperature specific heat analysis, we determined three more crystal field transitions at 10.37(4) meV, 15.49(9) meV and 23.44(8) meV. The lower energy crystal field levels observed from the inelastic neutron scattering measurements are in excellent agreement with those determined from specific heat data. The magnetic entropy () associated with the magnetic specific heat () is obtained, which is consistent with the theoretical prediction. The linear term in specific heat and also quasielastic scattering observed in inelastic neutron spectra, further adds another possible driving force for the observed ferroelectricity in the form of short range exchange interactions in this compound as proposed by Wan et al., [51]. Further, from the temperature evolution of crystal field spectra we confirm a direct correlation between the magnetic ordering and the ferroelectricity in this compound, as predicted by Rajeswaran et al. [5]. In addition to aforementioned mechanisms, the asymmetry driven ferroelectricity as proposed by Ghosh et al. [8, 10] and Indra et al., [11] should also be considered as one of the driving force for ferroelectricity. More detailed temperature dependent structural studies are required for the quantitative analysis of distortions induced ferroelectricity. Thus our study and recent reports on the ferroelectricity confirm that HoCrO3 and CrO3 in general, possesses more than one ingredient which can drive ferroelectricity, suggesting that these materials are potential multiferroic candidates for device applications. Our study warrants, more detailed temperature dependent nuclear and magnetic structure studies to establish a most favorable mechanism for multiferroicity in HoCrO3 and rare-earth orthochromites in general.
Acknowledgments
We thank the expert assistance of T. Strässle, SINQ, Paul Scherrer Institute. Part of the research conducted at SNS was sponsored by the Scientific User Facilities Division, Office of Basic Energy Sciences, US Department of Energy. This work is partially based on the experiments performed at the Swiss Spallation Neutron Source SINQ, instrument FOCUS (Proposal ID 20090536). Financial support from the European Project EU NMI3 is acknowledged.
References
References
- [1] Serrao C R, Kundu A K, Krupanidhi S B, Waghmare U V and Rao C N R 2005 Phys. Rev. B 72 220101
- [2] Sahu J R, Serrao C R, Ray N, Waghmare U V and Rao C N R 2007 J. Mater. Chem. 17 42
- [3] Su Y, Zhang J, Feng Z, Li Z, Shen Y and Cao S 2011 J. Rare Earths 29 1060
- [4] Benedek N A, Mulder A T and Fennie C J 2012 J. Solid State Chem. 195 11
- [5] Rajeswaran B, Khomskii D I, Zvezdin A K, Rao C N R and Sundaresan A 2012 Phys. Rev. B 86(21) 214409
- [6] Preethi Meher K R S, Wahl A, Maignan A, Martin C and Lebedev O I 2014 Phys. Rev. B 89(14) 144401
- [7] Apostolov A T, Apostolova I N and Wesselinowa J M 2015 Mod. Phys. Lett. B 29 1550251
- [8] Ghosh A, Pal A, Dey K, Majumdar S and Giri S 2015 J. Mater. Chem. C 3(16) 4162
- [9] Subba Rao G V, Chandrashekhar G V and Rao C N R 1968 Solid State Commun. 6 177
- [10] Ghosh A, Dey K, Chakraborty M, Majumdar S and Giri S 2014 EPL 107 47012
- [11] Indra A, Dey K, Midya A, Mandal P, Gutowski O, Rütt U, Majumdar S and Giri S 2016 J. Phys.: Condens. Matter 28 166005
- [12] Geller S and Wood E A 1956 Acta Crystallogr. 9 563
- [13] Geller S 1956 J. Chem. Phys. 24 1236
- [14] Bertaut E F and Forrat F 1956 J. Phys. (Paris) 17 129
- [15] Bertaut E, Mareschal J, De Vries G, Aleonard R, Pauthenet R, Rebouillat J and Zarubicka V 1966 IEEE Trans. Magn. 2 453
- [16] Pataud P and Sivardière J 1970 J. de Phys. 31 803
- [17] Hornreich R M, Wanklyn B M and Yaeger I 1972 Int. J. Magn. 2 77
- [18] Rietveld H M 1969 J. Appl. Crystallogr. 2 65
- [19] Rodríguez-Carvajal J 1993 Physica B 192 55
- [20] Hwang J S, Lin K J and Tien C 1997 Rev. Sci. Instrum. 68 94
- [21] Mamontov E and Herwig K W 2011 Rev. Sci. Instrum. 82 085109
- [22] Chatterji T, Jalarvo N, Kumar C M N, Xiao Y and Brückel T 2013 J. Phys. Condens. Matter 25 286003
- [23] Azuah R, Kneller L, Qiu Y, Tregenna-Piggott P, Brown C, Copley J and Dimeo R 2009 J. Res. Natl. Inst. Stand. Technol. 114 341
- [24] Shannon R D 1976 Acta Crystallogr., Sect. A: Found. Crystallogr. 32 751
- [25] Quezel-Ambrunaz S and Mareschal J 1963 Bull. Soc. Fr. Mineral. Crystallogr. 36 204
- [26] Van Kempen H, Miedema A R and Huiskamp W J 1964 Physica 30 229
- [27] Bleaney B and Hill R W 1961 Proc. Phys. Soc. London 78 313
- [28] Rossat-Mignod J, Quezel G, Berton A and Chaussy J 1974 Phys. Status Solidi B 63 105
- [29] Tari A 2003 The specific heat of matter at low temperatures (Imperial College Press, London)
- [30] Courths R and Hüfner S 1976 Zeitschrift für Physik B Condensed Matter 24 193
- [31] Gordon J E, Dempesy C W and Soller T 1961 Phys. Rev. 124 724
- [32] Lounasmaa O V 1962 Phys. Rev. 128 1136
- [33] Bloch D, Voiron A, Berton A and Chaussy J 1973 Solid State Commun. 12 685
- [34] Jana Y M and Ghosh D 2000 Phys. Rev. B 61 9657
- [35] Ehlers G, Mamontov E, Zamponi M, Kam K C and Gardner J S 2009 Phys. Rev. B 102 016405
- [36] Eibschütz M, Cohen R L and West K W 1969 Phys. Rev178 572
- [37] Gopal E S R 1966 Specific heats at low temperatures (Heywood books London)
- [38] Schäpers M, Wolter A U B, Drechsler S L, Nishimoto S, Müller K H, Abdel-Hafiez M, Schottenhamel W, Büchner B, Richter J, Ouladdiaf B, Uhlarz M, Beyer R, Skourski Y, Wosnitza J, Rule K C, Ryll H, Klemke B, Kiefer K, Reehuis M, Willenberg B and Süllow S 2013 Phys. Rev. B 88(18) 184410
- [39] Pataud P and Sivardière J 1970 J. de Phys. 31 1017
- [40] Shamir N, Shaked H and Shtrikman S 1977 Physica B+C 90 211
- [41] Shamir N, Melamud H, Shaked H and Shtrikman S 1977 Physica B 90 217
- [42] Ghivelder L, Abrego Castillo I, Alford N, Tomka G J, Riedi P, MacManus-Driscoll J, Akther Hossain A and Cohen L 1998 J. Magn. Magn. Mater. 189 274
- [43] Hamilton J J, Keatley E L, Ju H L, Raychaudhuri A K, Smolyaninova V N and Greene R L 1996 Phys. Rev. B 54(21) 14926
- [44] Coey J M D, Viret M, Ranno L and Ounadjela K 1995 Phys. Rev. Lett. 75(21) 3910
- [45] Woodfield B F, Wilson M L and Byers J M 1997 Phys. Rev. Lett. 78(16) 3201
- [46] Ghivelder L, Abrego Castillo I, Gusmao M A, Alonso J A and Cohen L F 1999 Phys. Rev. B 60 12184
- [47] Imai H, Wada H and Shiga M 1996 J. Phys. Soc. Jpn. 65 3460
- [48] Raychaudhuri P, Mitra C, Paramekanti A, Pinto R, Nigam A K and Dhar S K 1998 J. Phys. Condens. Matter 10 L191
- [49] Zhou H D, Lu J, Vasic R, Vogt B W, Janik J A, Brooks J S and Wiebe C R 2007 Phys. Rev. B 75 132406
- [50] Kumar C M N, Xiao Y, Nandi S, Senyshyn A, Su Y, Brückel T Magnetic ordering and magnetoelastic effect in HoCrO3, manuscript in preparation
- [51] Wan X, Ding H C, Savrasov S Y and Duan C G 2016 Scientific reports 6 22743