MUSE Reveals a Recent Merger in the Post-starburst Host Galaxy of the TDE ASASSN-14li
Abstract
We present MUSE integral field spectroscopic observations of the host galaxy (PGC 043234) of one of the closest (, Mpc) and best-studied tidal disruption events (TDE), ASASSN-14li. The MUSE integral field data reveal asymmetric and filamentary structures that extend up to kpc from the post-starburst host galaxy of ASASSN-14li. The structures are traced only through the strong nebular [O III] 5007, [N II] 6584, and H emission lines. The total off nuclear [O III] 5007 luminosity is erg s-1 and the ionized H mass is . Based on the BPT diagram, the nebular emission can be driven by either AGN photoionization or shock excitation, with AGN photoionization favored given the narrow intrinsic line widths. The emission line ratios and spatial distribution strongly resemble ionization nebulae around fading AGNs such as IC 2497 (Hanny’s Voorwerp) and ionization “cones” around Seyfert 2 nuclei. The morphology of the emission line filaments strongly suggest that PGC 043234 is a recent merger, which likely triggered a strong starburst and AGN activity leading to the post-starburst spectral signatures and the extended nebular emission line features we see today. We briefly discuss the implications of these observations in the context of the strongly enhanced TDE rates observed in post-starburst galaxies and their connection to enhanced theoretical TDE rates produced by supermassive black-hole binaries.
1 Introduction
When a star passes within the tidal radius of a supermassive black-hole (SMBH), the strong gravitational tidal forces can tear it apart, potentially producing a short-lived luminous flare known as a tidal disruption event (TDE; Rees, 1988; Evans & Kochanek, 1989; Strubbe & Quataert, 2009). TDEs can be used to find SMBHs in the centers of galaxies, to study their mass function and its evolution in cosmic time, to study the properties of the disrupted star and the stellar debris, and to determine the SMBH mass and spin (see review by Komossa, 2015, and references therein). The theoretical TDE rate in a galaxy with a single SMBH has been estimated to be per year (e.g., Wang & Merritt, 2004; Stone & Metzger, 2016). However, if a galaxy or galaxy merger has created a SMBH binary, the TDE rate could increase by a few orders of magnitude (e.g., Chen et al., 2009, 2011). The TDE rate can also be higher in steep central stellar cusps (e.g., Magorrian & Tremaine, 1999; Stone & van Velzen, 2016).
In the last few years, TDE candidates111See https://tde.space. have been identified at different wavelengths from -rays to optical (e.g., Esquej et al., 2007; Gezari et al., 2008; Arcavi et al., 2014; Holoien et al., 2014, 2016a, 2016b). One of the most unexpected observational results from these discoveries was the finding by Arcavi et al. (2014) that a large fraction of TDEs have post-starburst hosts, galaxies with strong Balmer absorption lines (A-type stellar populations with ages Myr) on top of a spectrum characteristic of an old (elliptical) stellar population with weak or no evidence for very recent star-formation (E+A galaxies; e.g., Zabludoff et al. 1996). In a follow-up study using SDSS galaxies and a larger TDE host sample, French et al. (2016) confirm this result and estimate that the observed TDE rate might be more than two orders of magnitude higher in galaxies with strong Balmer absorption features compared to normal galaxies. Given this puzzling observation and the theoretical expectation of enhanced TDE rates in galaxies with SMBH binaries, detailed studies of TDE host galaxies could provide important insights into the physical mechanism that produces this rate enhancement.
The All-Sky Automated Survey for SuperNovae (ASAS-SN; Shappee et al., 2014), a transient survey of the whole sky at optical wavelengths, has discovered three of the closest ( Mpc) and best studied TDEs (ASASSN-14ae, Holoien et al. 2014; Brown et al. 2016a; ASASSN-14li, Holoien et al. 2016a; ASASSN-15oi, Holoien et al. 2016b), providing an excellent sample for detailed host galaxy studies. In particular, ASASSN-14li at ( Mpc), discovered in November 2014, has been the best studied TDE to date at all wavelengths, including the optical/UV (Holoien et al., 2016a; Cenko et al., 2016; Brown et al., 2016b), radio (Alexander et al., 2016; van Velzen et al., 2016; Romero-Cañizales et al., 2016), X-rays (Holoien et al., 2016a; Miller et al., 2015), and mid-infrared (Jiang et al., 2016), as well as with theoretical modeling (Krolik et al., 2016). The archival, nuclear SDSS spectrum of the host galaxy of ASASSN-14li, PGC 043234 (VIII Zw 211; M⊙), shows strong Balmer lines in absorption and no strong evidence for current star-formation (Holoien et al., 2016a). Indeed, the galaxy has the highest Lick H index in the TDE host sample studied by French et al. (2016), indicating a strong post-starburst stellar population in its nuclear region with an age of Myr.
In this letter, we present integral field spectroscopic observations of the host galaxy of ASASSN-14li and its surroundings obtained in early 2016. In Section §2 we discuss the observations and data reduction. In Section §3 we present the results and the analysis of the data. We discuss our results in Section §4. Throughout the paper, we assume a distance to ASASSN-14li of Mpc corresponding to a linear scale of /kpc (Holoien et al., 2016a).
2 Observations and Data Reduction
We observed the field of ASASSN-14li as part of the All-weather MUse Supernova Integral field Nearby Galaxies (AMUSING; Galbany et al. 2016) with the Multi Unit Spectroscopic Explorer (MUSE, Bacon et al. 2010) on ESO’s Very Large Telescope UT4 (Yepun). MUSE is a state-of-the-art integral field spectrograph with a field of view of and spaxels. It covers the spectral range Å with a resolving power of . Our MUSE data were obtained on 2016-01-21 and consisted of four dithered exposures each with an integration time of 698 sec. The sky conditions were clear, and we measure a full-with-half-maximum for the stellar point-spread function of 105 at 5000 Å and 085 at 9000 Å, respectively.
We reduced the MUSE spectroscopy with version 1.2.1 of the pipeline provided by ESO (Weilbacher et al., 2014), which applies a bias, flat-field, illumination, field geometry correction and background subtraction. The wavelength solution was tied to arc lamp frames, refined using skylines in the science data and converted into the heliocentric reference frame. Observations of the spectrophotometric standard GD108, taken immediately after the science data, provided the flux calibration. The final product of this reduction process is a data cube with two celestial coordinates sampled at 02 and one wavelength dimension sampled at 1.25 Å. We checked the astrometric zeropoint of the MUSE data using the SDSS DR12 (Alam et al., 2015) and -band images of the field. We found and corrected astrometric shifts of 103 in RA and 133 in Dec with respect to the SDSS images.
3 Results and Analysis
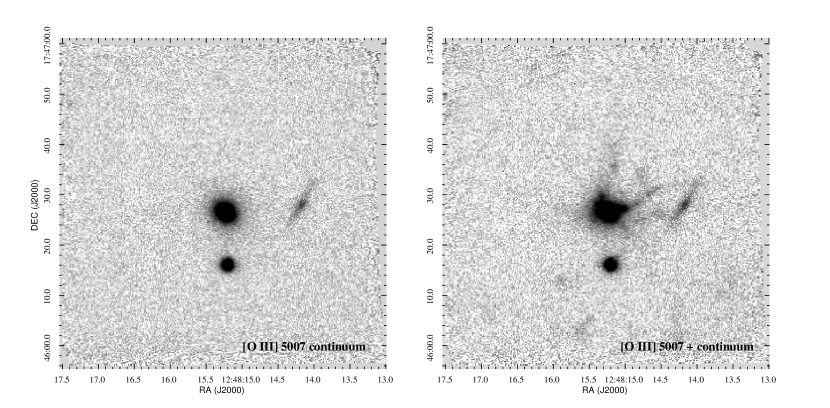
An initial inspection of the MUSE data immediately showed the presence of extended line emission around PGC 043234 that was not detected in the SDSS images. The left panel of Figure 1 shows a full image of the continuum just to the blue of the nebular [O III] 5007 emission line (at Å in the observer’s frame) and the right panel shows an image including the nebular [O III] 5007 emission line and its underlying continuum (at Å in the observer’s frame). The extended source to the West of PGC 043234 is an edge-on background galaxy at , measured using nebular emission lines from the galaxy, and the bright point-source to the South is a Galactic star. The extended features around PGC 043234 have strong [O III] 5007 in emission, and further analysis also reveals strong [N II] 6584 and H emission at the same locations.
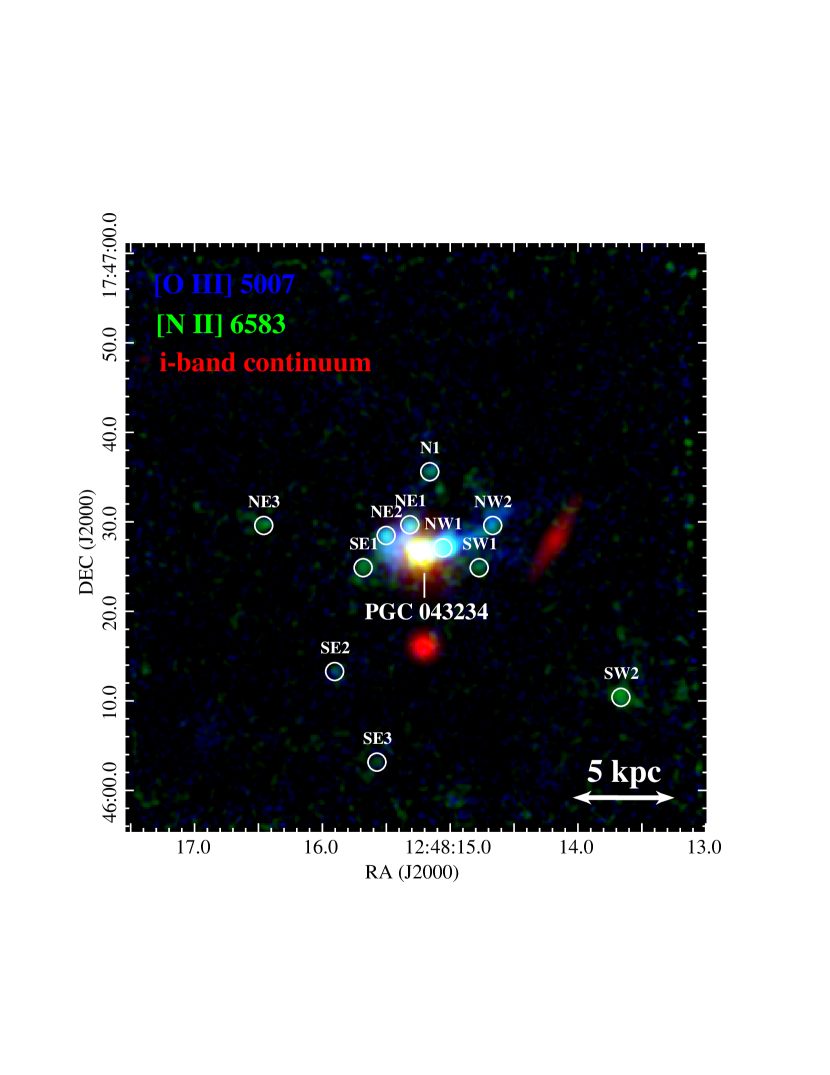
Figure 2 shows a false color image of the MUSE field around ASASSN-14li/PGC 043234. In blue is the continuum-subtracted [O III] 5007 emission line image, in green is the continuum-subtracted [N II] 6584 emission line image, and in red is the -band continuum flux image obtained from synthetic photometry of the MUSE data cube. We observe complex filamentary and asymmetric structures in the nebular emission around PGC 043234 that resemble a galaxy merger that is undetected in the continuum image. The emission extends to a projected distance of kpc () from the nucleus of PGC 043234, with some isolated nebular emission regions at kpc () from the nucleus. The “arm” structure to the North-West of PGC 043234 extends to kpc, with a resolved extended peak in nebular emission at kpc. There is also an extended region of strong nebular emission kpc to the East/North-East of PGC 043234 with multiple emission peaks.
The circles in Figure 2 define radius apertures for regions with strong nebular emission that we will study in more detail. In order to extract the fluxes of the nebular emission lines free from the contamination of the stellar continuum, we modeled the stellar continuum in the spectrum of each region using stellar population synthesis models from STARLIGHT (Cid Fernandes et al., 2009) and following the prescriptions presented in Galbany et al. (2014). The H emission line is undetected in most of the regions and we estimate 3 upper limits on the emission line fluxes following Shappee et al. (2013).
In Table 1 we present the measured properties of the regions defined in Figure 2, including the coordinates, projected distances (in kpc) and radial velocity differences (in km s-1, measured from the [N II] 6584 line) with respect to the nucleus of PGC 043234, along with integrated line luminosities (corrected for Galactic extinction) for the strongest nebular emission lines ([O III] 5007, H, H, and [N II] 6584). The nebular emission line luminosities of the nuclear region of PGC 043432 shown in Table 1 are also included after subtracting the best-fit STARLIGHT model for the absorption lines. The H and H emission line luminosities for the nuclear region should be interpreted with caution given the very strong stellar absorption and the contribution from ASASSN-14li to the nuclear fluxes even at late epochs after its discovery (Brown et al., 2016b).
In Figure 3 we show the integrated spectra of the regions defined in Figure 2 with the highest [O III] 5007 line luminosities. In addition to H, H, [O III], and [N II], the He II 4686 and [S II] 6716,6731 nebular emission lines are clearly detected in the region NW1. From the detection of the [S II] doublet we can estimate the electron density of the nebula (Osterbrock & Ferland, 2006). Using the temden task in IRAF, the measured [S II] 6716,6731 flux ratio of 1.04, and an assumed electron temperature of K, the estimated electron density for the region is cm-3. This implies a recombination timescale of yr (Osterbrock & Ferland, 2006). Note that the [S II] 6731 emission line lies at the wavelength of the telluric O2 B-band absorption, making this estimate of the density prone to significant systematic uncertainties.
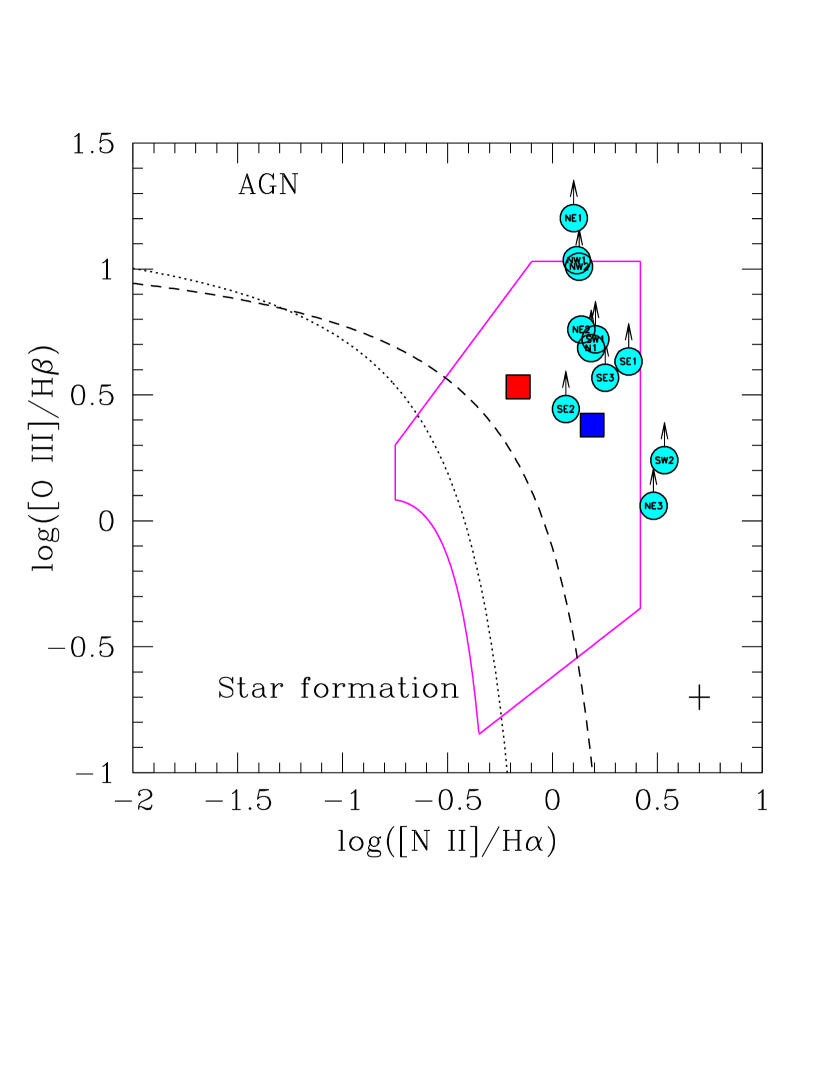
In Figure 4 we show the standard Baldwin-Phillips-Terlevich (BPT; Baldwin et al., 1981) emission line diagnostics diagram along with the [N II]/H and [O III]/H flux ratios (in logarithmic scale) for all the nebular emission regions defined in Figure 2 and the nucleus of PGC 043234. The dashed and dotted lines in Figure 4 separate the main sources of photoionization of nebulae between star formation (starburst) and AGN activity as defined in Kewley et al. (2001, dashed line) and Kauffmann et al. (2003, dotted line). Shock excitation can also produce line ratios in the range of the BPT diagram between star-formation and AGN (e.g., Allen et al., 2008; Rich et al., 2011; Alatalo et al., 2016). The area inside the magenta region defined in Figure 4 contains values of the line ratios that can be explained by shock models (Alatalo et al., 2016).
All the [O III] 5007 and [N II] 6584 emitting line regions around PGC 043234, including its nucleus, are consistent with photoionization by an AGN, instead of current star-formation, and most of the values of the ratios are also consistent with shock models. Given the presence of late-time Balmer line contamination from TDE emission in the nucleus (Brown et al., 2016b), we also measured the line ratios using the archival SDSS spectrum of the host galaxy (obtained in 2007) using the same approach to subtracting the strong stellar absorption lines. The resulting SDSS emission line fluxes of the nuclear region are log([N II]/H) 0.19 and log([O III]/H) 0.38, which still puts the nucleus in the AGN/shock region of the BPT diagram (see Figure 4).
4 Discussion
We have presented MUSE integral field spectroscopic observations of the nearby TDE ASASSN-14li host galaxy, PGC 043234, and its environment (). These data reveal the presence of asymmetric and filamentary emission line structures that extend many kpc from the post-starburst host galaxy of ASASSN-14li (Figure 2). The extended ( kpc) filamentary structures are traced only by the detection of strong nebular emission lines of [O III] 5007, [N II] 6584, and H, and are undetected in the continuum, as illustrated in Figure 2. The total off nuclear line luminosities are erg s-1, erg s-1, and erg s-1 for [O III], [N II], and H, respectively, which implies an off-nuclear ionized H mass of (Osterbrock & Ferland, 2006).
The location of the main nebular emission line ratios for both the extended emission line regions and the nucleus of PGC 043234 in the BPT diagnostic diagram (Figure 4) are consistent with photoionization by an AGN or shock excitation, but not photoionization by current star-formation. We do not favor shock excitation models as an explanation for the line ratios because the nebular emission lines have a low average intrinsic velocity dispersion of km s-1 and no broad wings. Fast shocks ( km s-1) that can produce the observed line ratios seem incompatible with the line widths (Allen et al., 2008), while slow shocks ( km s-1) which might be compatible, but still broader, with the line widths do not reproduce the line ratios (Rich et al., 2011). Also, the He II 4686 to H line ratio of 0.6 in the NW1 region is higher than in most of the fast shock models (Allen et al., 2008). We therefore conclude that the emission lines are most likely photoionized by an AGN.
There are two lines of evidence that PGC 043234 was a weak AGN prior to the TDE. The first, discussed in Section §3, is that the stellar population-corrected SDSS archival spectrum from 2007 of the nuclear region has line ratios suggesting AGN activity. PGC 043234 is also associated with an unresolved FIRST (Becker et al., 1995) radio source with a luminosity of W Hz-1 (Holoien et al., 2016a) or erg s-1 that is typical of low-luminosity AGN (e.g., Ho, 1999). Although the radio luminosity could be produced by star formation, there is no evidence for current star formation in the host galaxy from either the SDSS/MUSE spectra or the overall spectral energy distribution (Holoien et al., 2016a). However, the upper limit on the soft X-ray luminosity of PGC 043234 from the ROSAT All-Sky Survey (Voges et al., 1999) of erg s-1 (Holoien et al., 2016a; Miller et al., 2015), implies an ionizing luminosity which is too small to explain the extended emission line features. Using the H luminosity of the brightest off-nuclear emission region (NW1), assuming case B recombination and following Keel et al. (2012), we estimate a minimum required ionizing luminosity from a central source of erg s-1.
The production of strong emission lines can then be explained in two ways. First, the pre-TDE nucleus could be a Seyfert 2, with other lines of sight being exposed to much higher ionizing fluxes. Such ionization “cones” are observed around local Seyfert 2 AGN on similar physical scales (e.g., Wilson & Tsvetanov, 1994; Keel et al., 2012). Second, the observed emission line structures also resemble Hanny’s Voorwerp, a large ionization nebula located kpc from the galaxy IC 2497 (Lintott et al., 2009), and other ionization nebulae where the line emission is thought to be an echo of AGN activity in the recent past rather than a reflection of present day activity (e.g., Keel et al., 2012; Schweizer et al., 2013).
The [S II] doublet line ratio measured in the spectrum of the strongest [O III] 5007 emitting region (NW1) implies a recombination time that is short compared to the light travel time to the furthest emission line regions ( years versus years), which suggests that the pre-TDE source would more likely be a Seyfert 2 rather than a Voorwerp. The short recombination timescale is also at odds with a “fossil nebula” interpretation (Binette & Robinson, 1987). However, the possible systematics errors associated with the density estimate from the [S II] doublet line ratio, due to the dominant telluric absorption correction at that wavelength, makes this conclusion fairly uncertain. Also, the distribution of the emission line regions around PGC 043234 do not clearly favor the geometry seen in Seyfert 2 ionization cones (e.g., Wilson & Tsvetanov, 1994).
In either case, the overall morphology of the emission line features strongly indicates that PGC 043234 recently underwent a merger, leaving relatively dense gas on large scales with no associated stars. This is consistent with both recent AGN activity and the post-starburst spectrum of the galaxy, strongly supporting the galaxy-galaxy merger scenario proposed for E+A galaxies (Zabludoff et al., 1996; Goto, 2005). The stellar continuum emission itself is quite smooth, suggesting that we are observing the merger at a relatively late time (e.g., Hopkins et al., 2008). In these late phases, we might expect a relatively compact SMBH binary in the nucleus of the host galaxy, which would then naturally produce a greatly enhanced TDE rate (e.g., Chen et al., 2009, 2011). This would be an exciting possibility for explaining the high TDE rates that appear to be associated with post-starburst galaxies (Arcavi et al., 2014; French et al., 2016), including the host of ASASSN-14li. Indeed, the detection of a radio source at pc from the nucleus of PGC 043234 in high resolution EVN observations could be explained by a companion AGN (Romero-Cañizales et al., 2016).
References
- Alam et al. (2015) Alam, S., Albareti, F. D., Allende Prieto, C., et al. 2015, ApJS, 219, 12
- Alatalo et al. (2016) Alatalo, K., Cales, S. L., Rich, J. A., et al. 2016, ApJS, 224, 38
- Alexander et al. (2016) Alexander, K. D., Berger, E., Guillochon, J., Zauderer, B. A., & Williams, P. K. G. 2016, ApJ, 819, L25
- Allen et al. (2008) Allen, M. G., Groves, B. A., Dopita, M. A., Sutherland, R. S., & Kewley, L. J. 2008, ApJS, 178, 20-55
- Arcavi et al. (2014) Arcavi, I., Gal-Yam, A., Sullivan, M., et al. 2014, ApJ, 793, 38
- Bacon et al. (2010) Bacon, R., Accardo, M., Adjali, L., et al. 2010, Proc. SPIE, 7735, 773508
- Baldwin et al. (1981) Baldwin, J. A., Phillips, M. M., & Terlevich, R. 1981, PASP, 93, 5
- Becker et al. (1995) Becker, R. H., White, R. L., & Helfand, D. J. 1995, ApJ, 450, 559
- Binette & Robinson (1987) Binette, L., & Robinson, A. 1987, A&A, 177, 11
- Brown et al. (2016a) Brown, J. S., Shappee, B. J., Holoien, T. W.-S., et al. 2016a, MNRAS, 462, 3993
- Brown et al. (2016b) Brown, J. S., et al. 2016b, MNRAS, submitted, arXiv:1609.04403
- Cenko et al. (2016) Cenko, S. B., Cucchiara, A., Roth, N., et al. 2016, ApJ, 818, L32
- Chen et al. (2009) Chen, X., Madau, P., Sesana, A., & Liu, F. K. 2009, ApJ, 697, L149
- Chen et al. (2011) Chen, X., Sesana, A., Madau, P., & Liu, F. K. 2011, ApJ, 729, 13
- Cid Fernandes et al. (2009) Cid Fernandes, R., Schoenell, W., Gomes, J. M., et al. 2009, Revista Mexicana de Astronomia y Astrofisica Conference Series, 35, 127
- Esquej et al. (2007) Esquej, P., Saxton, R. D., Freyberg, M. J., et al. 2007, A&A, 462, L49
- Evans & Kochanek (1989) Evans, C. R., & Kochanek, C. S. 1989, ApJ, 346, L13
- French et al. (2016) French, K. D., Arcavi, I., & Zabludoff, A. 2016, ApJ, 818, L21
- Galbany et al. (2014) Galbany, L., Stanishev, V., Mourão, A. M., et al. 2014, A&A, 572, A38
- Galbany et al. (2016) Galbany, L., Anderson, J. P., Rosales-Ortega, F. F., et al. 2016, MNRAS, 455, 4087
- Gezari et al. (2008) Gezari, S., Basa, S., Martin, D. C., et al. 2008, ApJ, 676, 944-969
- Goto (2005) Goto, T. 2005, MNRAS, 357, 937
- Ho (1999) Ho, L. C. 1999, ApJ, 516, 672
- Holoien et al. (2014) Holoien, T. W.-S., Prieto, J. L., Bersier, D., et al. 2014, MNRAS, 445, 3263
- Holoien et al. (2016a) Holoien, T. W.-S., Kochanek, C. S., Prieto, J. L., et al. 2016a, MNRAS, 455, 2918
- Holoien et al. (2016b) Holoien, T. W.-S., Kochanek, C. S., Prieto, J. L., et al. 2016b, MNRAS, accepted, arXiv:1602.01088
- Hopkins et al. (2008) Hopkins, P. F., Hernquist, L., Cox, T. J., & Kereš, D. 2008, ApJS, 175, 356-389
- Jiang et al. (2016) Jiang, N., Dou, L., Wang, T., et al. 2016, arXiv:1605.04640
- Kauffmann et al. (2003) Kauffmann, G., Heckman, T. M., Tremonti, C., et al. 2003, MNRAS, 346, 1055
- Keel et al. (2012) Keel, W. C., Chojnowski, S. D., Bennert, V. N., et al. 2012, MNRAS, 420, 878
- Kewley et al. (2001) Kewley, L. J., Dopita, M. A., Sutherland, R. S., Heisler, C. A., & Trevena, J. 2001, ApJ, 556, 121
- Komossa (2015) Komossa, S. 2015, Journal of High Energy Astrophysics, 7, 148
- Krolik et al. (2016) Krolik, J., Piran, T., Svirski, G., & Cheng, R. M. 2016, ApJ, 827, 127
- Magorrian & Tremaine (1999) Magorrian, J., & Tremaine, S. 1999, MNRAS, 309, 447
- Miller et al. (2015) Miller, J. M., Kaastra, J. S., Miller, M. C., et al. 2015, Nature, 526, 542
- Lintott et al. (2009) Lintott, C. J., Schawinski, K., Keel, W., et al. 2009, MNRAS, 399, 129
- Osterbrock & Ferland (2006) Osterbrock, D. E., & Ferland, G. J. 2006, Astrophysics of gaseous nebulae and active galactic nuclei, 2nd. ed. by D.E. Osterbrock and G.J. Ferland. Sausalito, CA: University Science Books, 206
- Rees (1988) Rees, M. J. 1988, Nature, 333, 523
- Rich et al. (2011) Rich, J. A., Kewley, L. J., & Dopita, M. A. 2011, ApJ, 734, 87
- Romero-Cañizales et al. (2016) Romero-Cañizales, C., Prieto, J. L., et al. 2016, submitted to ApJL, arXiv:1609.00010
- Schweizer et al. (2013) Schweizer, F., Seitzer, P., Kelson, D. D., Villanueva, E. V., & Walth, G. L. 2013, ApJ, 773, 148
- Shappee et al. (2013) Shappee, B. J., Stanek, K. Z., Pogge, R. W., & Garnavich, P. M. 2013, ApJ, 762, L5
- Shappee et al. (2014) Shappee, B. J., Prieto, J. L., Grupe, D., et al. 2014, ApJ, 788, 48
- Stone & Metzger (2016) Stone, N. C., & Metzger, B. D. 2016, MNRAS, 455, 859
- Stone & van Velzen (2016) Stone, N. C., & van Velzen, S. 2016, ApJ, 825, L14
- Strubbe & Quataert (2009) Strubbe, L. E., & Quataert, E. 2009, MNRAS, 400, 2070
- van Velzen et al. (2016) van Velzen, S., Anderson, G. E., Stone, N. C., et al. 2016, Science, 351, 62
- Voges et al. (1999) Voges, W., Aschenbach, B., Boller, T., et al. 1999, A&A, 349, 389
- Wang & Merritt (2004) Wang, J., & Merritt, D. 2004, ApJ, 600, 149
- Weilbacher et al. (2014) Weilbacher, P. M., Streicher, O., Urrutia, T., et al. 2014, Astronomical Data Analysis Software and Systems XXIII, 485, 451
- Wilson & Tsvetanov (1994) Wilson, A. S., & Tsvetanov, Z. I. 1994, AJ, 107, 1227
- Zabludoff et al. (1996) Zabludoff, A. I., Zaritsky, D., Lin, H., et al. 1996, ApJ, 466, 104
| Location | RA | DEC | L(H) | L([O III] 5007) | L(H) | L([N II] 6584) | ||
|---|---|---|---|---|---|---|---|---|
| (J2000.0) | (J2000.0) | (kpc) | (km s-1) | ( erg s-1) | ( erg s-1) | ( erg s-1) | ( erg s-1) | |
| Nucleus | 12:48:15.24 | +17:46:26.5 | 0.0 | 0.0 | 23.7 | 80.7 | 57.3 | 39.4 |
| NW1 | 12:48:15.06 | +17:46:27.1 | 1.2 | +48 | 6.8 | 73.4 | 18.4 | 24.0 |
| NE1 | 12:48:15.32 | +17:46:29.7 | 1.5 | +12 | 17.7 | 4.9 | 6.1 | |
| NE2 | 12:48:15.50 | +17:46:28.5 | 1.8 | +88 | 3.0 | 17.2 | 4.6 | 6.4 |
| SE1 | 12:48:15.68 | +17:46:24.9 | 2.8 | 3.8 | 1.1 | 2.6 | ||
| SW1 | 12:48:14.77 | +17:46:24.9 | 3.0 | 4.2 | 1.4 | 2.2 | ||
| NW2 | 12:48:14.67 | +17:46:29.6 | 3.8 | +43 | 10.2 | 2.9 | 3.9 | |
| N1 | 12:48:15.16 | +17:46:35.6 | 4.0 | 5.3 | 1.8 | 2.7 | ||
| SE2 | 12:48:15.90 | +17:46:13.3 | 7.1 | 2.5 | 0.9 | 1.1 | ||
| NE3 | 12:48:16.46 | +17:46:29.6 | 7.8 | 1.3 | 0.8 | 2.4 | ||
| SE3 | 12:48:15.57 | +17:46:03.2 | 10.4 | 2.7 | 0.6 | 1.1 | ||
| SW2 | 12:48:13.66 | +17:46:10.4 | 12.1 | 1.7 | 1.0 | 3.4 |
Note. — and are the projected distances (in kpc) and velocity shifts (relative to km s-1 for the central region of PGC 043234). The remaining columns are the H, [O III] 5007, H, and [N II] 6584 line luminosities of each region obtained after subtracting the stellar continuum using STARLIGHT models and correcting for Galactic extinction.