Distinguishing nanobubbles from nanodroplets with AFM: the influence of vertical and lateral imaging forces
Abstract
The widespread application of surface-attached nanobubbles and nanodroplets in biomedical engineering and nanotechnology is limited by numerous experimental challenges, in particular, the possibility of contamination in nucleation experiments. These challenges are complicated by recent reports that it can be difficult to distinguish between nanoscale drops and bubbles. Here we identify clear differences in the mechanical responses of nanobubbles and nanodroplets under various modes of AFM imaging which subject the objects to predominantly vertical or lateral forces. This allows to distinguish between nanodroplets, nanobubbles, and oil covered nanobubbles in water.
keywords:
nanobubbles, HOPG, nanodroplets, contaminationNanyang Technological University]Cavitation Lab, Division of Physics and Applied Physics, School of Physical and Mathematical Sciences, Nanyang Technological University, Singapore Nanyang Technological University]Cavitation Lab, Division of Physics and Applied Physics, School of Physical and Mathematical Sciences, Nanyang Technological University, Singapore Nanyang Technological University]Cavitation Lab, Division of Physics and Applied Physics, School of Physical and Mathematical Sciences, Nanyang Technological University, Singapore \abbreviationsHOPG
![[Uncaptioned image]](/html/1608.08162/assets/x1.png)
1 Introduction
The nucleation of micro and nanoscale liquid drops and gaseous bubbles on surfaces has gathered significant interest in recent years for numerous applications 1, 2, 3. Nanodroplets are useful for biomolecular analysis and microfluidic reactors 4, while the decoration of surfaces with bubbles significantly reduces fluid drag in microchannels 5. Both nanobubbles and nanodroplets are produced by exchanging water with an organic solvent, such as ethanol, over a suitable surface 1, 2, 3, 6. The nucleation mechanism of nanobubbles and nanodroplets appears to depend on the substantial difference in the solubility of gas (nanobubbles 7, 8) or the desired liquid (nanodroplets 6) in the water and solvent.
Given the similarity in their nucleation recipes, the contamination of exchange liquids may lead to the nucleation of both nanobubbles and nanodrops within a single experiment. It was recently reported that using disposable medical plastic syringes and cannulas to deliver liquids lead may lead to the contamination of nucleation experiments 9, 10, 11, 12. This contamination arises from the use of polydimethylsiloxane (PDMS) or other biologically-inert silicone oils to lubricate syringes and needles, in order to reduce discomfort during topical injections 13, 14.
The issue of contamination contributes to reproducibility issues and conflicting results in the field of nanobubbles. It has been noted that the height and size distributions of nanobubbles characterised with atomic force microscopy (AFM) varies drastically between research groups 2, 3, even though only widely-available liquids and atomically smooth substrates like highly oriented pyrolytic graphite (HOPG) are used in most such experiments.
Given the ease of contamination, experimental methods to distinguish polymeric liquid nanodroplets and gaseous nanobubbles are of urgent interest 2, 3. Recently significant progress in this area has been made. Chan et al. 15 used fluorescence microscopy to show that moving a contact line over a nanobubble deflated it upon exposure to the ambient atmosphere, while the contact line pinned strongly on a nanodroplet. Seo et al. 16 distinguished between dye-covered bubbles and drops by identifying differences in fluorescence signals. However, the two tests either permanently alter the interfacial chemistry of the objects or destroy them upon identification. Moreover, the fact is that the vast majority of the literature characterise nanobubbles exclusively with AFM. It is therefore important to be able to make the distinction between nanobubbles, nanodroplets and contamination using AFM in particular, so as to allow researchers in this field an opportunity to verify that their previously-published nucleation protocols are not contaminated.
In this article, we demonstrate that surface nanobubbles and nanodroplets on an atomically flat HOPG substrate can be differentiated through careful, non-destructive AFM characterization. We find distinct differences in the response of nanobubbles and nanodroplets in (a) PeakForce mode, in which the vertical imaging force can be carefully controlled; (b) contact mode, which delivers an invasive lateral force on the objects; and (c) force spectroscopy.
2 Results and discussion
2.1 Generation of nanobubbles and nanodroplets
To eliminate external contamination, we used unambiguous methods to nucleate nanobubbles and nanodroplets, avoiding solvent exchange or plastic syringes. Hydrogen nanobubbles were electrolytically generated on HOPG, while nanodroplets were introduced by directly depositing a dilute solution of PDMS (see Materials and Methods).
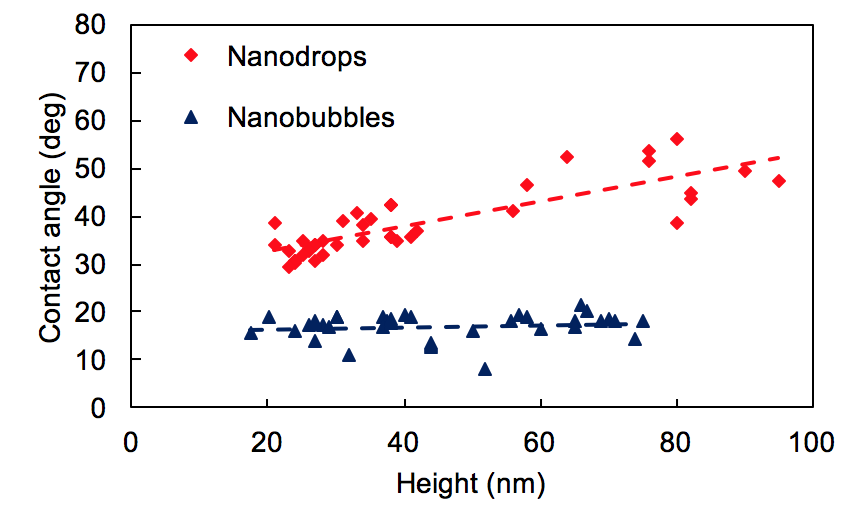
A baseline distribution of sizes and contact angles was established by imaging nanobubbles and nanodroplets separately with tapping mode AFM. The nanoscopic contact angles of the objects were calculated by least-square fits of the cross-sectional profile to a spherical cap. As shown in Figure 1, the nanobubbles’ fitted contact angles were virtually height-independent (), whereas the nanodroplets’ contact angles increased () with height. The contact angles are measured from the gas phase for nanobubbles and from the oil phase for the nanodroplets.
2.2 Morphology of nanobubbles and nanodroplets under varying peak force
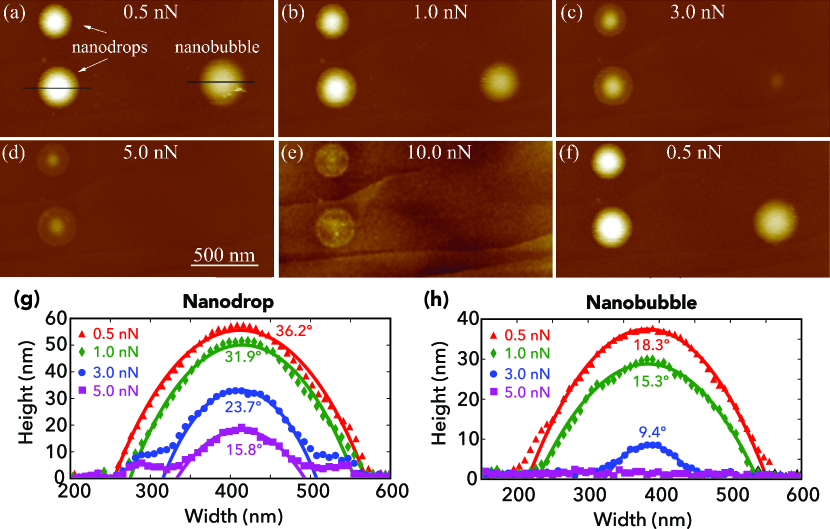
The most direct way to compare nanobubbles and nanodroplets is to introduce them onto a common substrate. We first electrolysed water to generate bubbles, and later introduced oil drops by adding dilute oil solution, allowing both types of objects to appear on the same scan (Figure 2). We selected an area containing two nanodroplets and one nanobubble with similar lateral radii. To observe the effects of varying the imaging force on drops and bubbles, we used PeakForce tapping mode AFM. In this mode, the maximum vertical force on the cantilever is used as a feedback mechanism, allowing soft objects to be imaged with a peak force that is typically of the order 0.1 to 1 nN, but can be controlled to an accuracy of 10 pN 17, 18, 19.
We then performed successive AFM scans at 0.5 to 10 nN (Figures 2A-E). The morphology of nanodroplets and nanobubbles changed significantly with increasing . At 0.5 nN, the height profiles of nanodroplets (Figures 2A and G) and nanobubbles (Figures 2A and H) were well-fitted to spherical caps. With increasing , the nanobubble in Figure 2a became smaller in base radius and height, before disappearing completely at nN. A nanodroplet also shrank in base radius and height with an increase in , but at nN appeared as a sombrero: a spherical cap sitting on a flat molecular layer. Remarkably, the molecular layer was highly resistant to vertical loading and remained in the height image at up to nN, maintaining a thickness of 1-2 nm. Molecular layers of 1-2 nm thickness at the contact lines of spreading PDMS drops have previously been observed by ellipsometry 20, though this layering is still not well understood. Finally, we note that neither bubbles nor drops were physically moved or destroyed by PeakForce imaging. When was reduced from 10.0 to 0.5 nN, all the objects restored their original heights, base radii, and positions (Figure 2F).
The way we created the objects on the system – with bubbles created first, and drops introduced later – leaves open the possibility that the bubbles may have been coated with oils. To investigate this scenario, AFM scans were taken in PeakForce mode before and five hours after dilute oil solution was introduced into the system (Figure S1 in the Supporting Information). Some bubbles exhibited an increase of contact angle from 18-20∘ to 30-54∘ (Table S1, Figures S1-2). As surface nanobubbles are stable against diffusion for several weeks without significant changes to morphology, the difference in contact angle must arise only from the change in interfacial energy balance at the nanobubble’s three-phase line due to oil depositing on top of the nanobubbles. When was increased incrementally, nanobubbles no longer disappeared from the scan image at 5.0 nN but maintained a nanometric layer (see Figures S1-2), similar to the oil nanodroplets.
The presence of a nanometric layer under strong AFM scanning is a tell-tale sign of contamination, resolving a contradiction raised by three recent papers imaging nanobubbles in PeakForce mode. Zhao et al. 19 and Yang et al. 17 found that nanobubbles disappeared from the scan image at 1.25-2 nN, restoring their original heights when was reduced to 0.2 nN. This agrees with our results. On the other hand, Walczyk et al. 18 suggested that nanobubbles (20 nm height, 100 nm width) remained visible when reached 27 nN. While the vast majority of work in the literature nucleated nanobubbles by solvent exchange or electrolysis 1, 2, 3, they were able to nucleate the objects simply by delivering water with a disposable syringe. Our results suggest that the robust layers visible at high peak forces in Walczyk et al. 18 were not nanobubbles, but polymeric contamination originating from plastic syringes.
2.3 Invasive contact mode scanning
Soft objects are usually imaged in non-invasive tapping or PeakForce mode AFM, rather than the conventional contact mode. In these modes, the tip height is adjusted rapidly (once in 100 s in PeakForce mode 21) by a feedback mechanism to ensure that the tip and sample only contact intermittently. The imaging force is hence predominantly vertical, while avoiding strong lateral forces. In contrast, feedback in contact mode controls the cantilever deflection rather than the tip height, and this imparts a strong lateral force on the objects imaged. A schematic of these modes is shown in Figure S3.
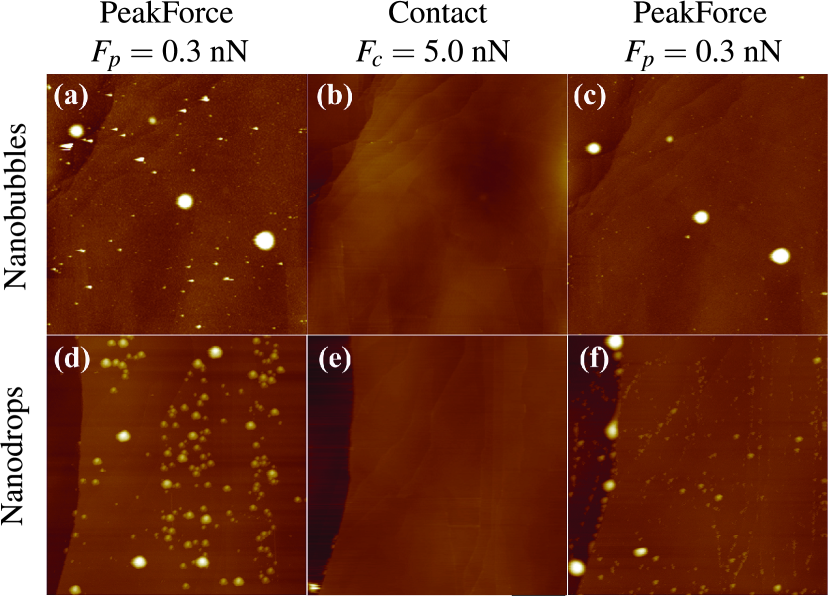
To observe the influence of strong lateral deformation on nanobubbles and nanodroplets, we nucleated the objects separately on HOPG substrate and performed scans in PeakForce mode before (Figures 3A and D) and after (Figures 3C and F) a contact mode scan with an estimated imaging force of 5 nN (Figs. 3B and E). Before contact mode imaging, the deflection sensitivity (in units of m/volts) was calibrated. The imaging force was estimated as , where is the spring constant of the cantilever, the set point and the vertical deflection signal (both in volts) reading before the AFM was engaged. Figs. 3a-c show that nanobubbles on the substrate were neither moved nor destroyed by contact mode scanning. Some irregularly-shaped particles, likely dirt, were removed by the scanning. We were unable to unpin nanobubbles from the substrate, even when was increased to nN. On the contrary, the distribution of nanodroplets was completely altered at nN, either by merging with other nanodroplets or being removed from the scan area (Figure 3F).
To understand why nanodroplets are unpinned and swept away in contact mode imaging, we make a few estimates. According to Young’s equation, the contact angle of a surface-attached drop is defined only by the interfacial energies at its three phase line. The tip imparts a steady lateral force onto the drop, which deforms the drop from one side, changing its approaching and receding angles (Figure S3). The drop depins once the difference in angles – hysteresis – has reached a certain amount. Since this threshold is unknown, we instead exploit the fact that bubbles and drops possess an effective spring constant 22 in the same order of magnitude as the surface tension of the object 23. The force exerted on the drops can then be estimated from the distance of deformation to be , where is the PDMS-water interface tension. In the experiments, the PDMS-water interface has a surface tension of 40 mN/m 24, and the nanodroplets have a typical base radius 200 nm. Assuming that the maximum deformation of the drop is in the same order as the base radius, the threshold force to trigger the unpinning of the drop in contact mode AFM can be estimated to be 4 nN, in agreement with our experimental observation. On the other hand, in PeakForce mode, the intermittent contact between tip and object minimised contact angle hysteresis. Nanodroplets were thus able to withstand large vertical forces of 10 nN without unpinning.
The force threshold required to unpin a nanobubble from its substrate remains unresolved. If nanobubbles and nanodroplets are pinned to their substrates by an identical force per unit length, and knowing that the interfacial energy of water-air is about double that of water-PDMS (72 versus 40 mJ/m2), the force threshold to unpin a bubble from the surface in contact mode should be approximately double that of a PDMS drop with same lateral size, i.e. nN. However, we were unable to unpin nanobubbles at any imaging force in both imaging modes used here.
2.4 Force spectroscopy
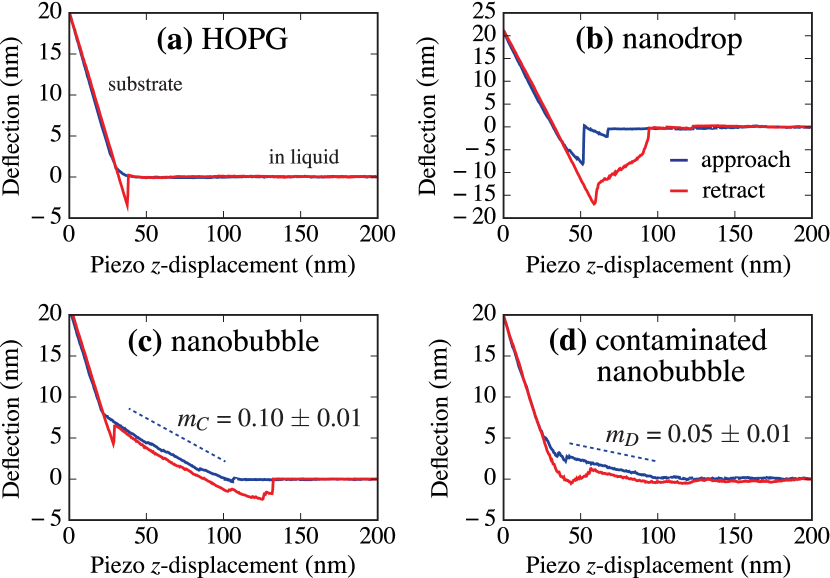
We also examined the tip-object interaction with AFM force spectroscopy. The tip-sample interaction is quantified by tracking the cantilever’s vertical deflection as it moves down towards (approach) and away (retract) from the sample. The force curves are read right-to-left. Figure 4A shows the deflection-displacement curve on the bare HOPG substrate. When the tip is far away from the substrate (‘in liquid’), the deflection is zero. The deflection then increases linearly as the tip comes into contact with the HOPG substrate (‘substrate’); the slope of the deflection-displacement curve gives a measure of the effective stiffness of the substrate.
We next show the force curves when the tip comes into contact first with a nanodroplet (Figure 4B) or a nanobubble (Figure 4C) before contacting the substrate.The tip-bubble interaction is characterised by a linear slope in the deflection-piezo displacement curve, which is consistent with theory 22 and experiments 25, 26. In our limited testing, this linear dependence occurs independent of the type of salt used in the electrolysis and probe wettability. Theory suggests that the tip-bubble interaction is linear 23 provided the magnitude of deformation by the tip is within a compliance regime 22, 27. We assume that nanobubbles fall within this regime because the maximum deformation of a spherically-capped nanobubble is its height nm, which is small compared to its radius of curvature m. We note the caveat that in very pure systems, the initial contact between the AFM tip and the bubble is marked with a pronounced snap-in 25, but this is suppressed in our case, perhaps due to disruption of electric double layer forces by electrolyte ions. However, the snap-in itself does not affect the linear dependence of the bubble-tip interaction. On the other hand, the tip-nanodroplet interaction is non-linear. Sharp kinks are observed in the approach curve in Figure 4b, representing a jump-to-contact with the substrate when the gradient of van der Waals forces between the oil and the tip overcomes the cantilever’s spring constant 28.
We were also able to distinguish between pure nanobubble and one that that was contaminated with a layer of oil. As with a pure nanobubble, the tip-contaminated bubble interaction is linear, but with a slope much smaller than for the pure nanobubble. Theory suggests that the slope of the deflection-displacement curve is proportional to the surface tension of the interface 23. This agrees well with our experimental observation that the ratio of the deflection curves on the contaminated bubble compared to the pure bubble (Figures 3C-D), , is approximately the ratio of the surface tensions of water and PDMS, .
3 Conclusions
In this Article, we identify a number of robust indicators to distinguish between nanobubbles and nanodroplets when they are imaged in AFM, such as differences in contact angles, force curves and response to different types of imaging forces. Our central result is that bubbles and drops exhibit very different responses under vertical and lateral forces. In PeakForce mode, we find that nanobubbles disappear cleanly from the AFM height images under large vertical imaging forces, but nanodroplets maintain a nanometric molecular layer under imaging forces in the order of tens of nN. In the standard contact mode AFM, we observe that nanobubbles are very strongly pinned onto their substrates and survive violent, lateral imaging forces of up to 50 nN without being moved or destroyed. Nanodroplets, on the other hand, are weakly pinned to their substrates and are easily depinned during contact mode imaging.
Our findings address a very urgent need in the field of nanobubbles to distinguish between gaseous objects and polymeric contamination which occurs easily during nucleation experiments. Although other methods of distinguishing between nanobubbles and contamination already exist, these tests are destructive and require specialised optical techniques inaccessible to the majority of research groups which image nanobubbles with AFM. We anticipate that our Article will equip researchers and engineers in the field of nanobubbles with a new perspective to judge previous work, as well as a diagnostic to verify the quality of their existing nucleation protocols.
4 Materials and methods
4.1 Nucleation of nanobubbles and nanodroplets
Hydrogen nanobubbles were generated by the electrolysis of aqueous solutions on highly ordered pyrolytic graphite (HOPG) substrate, the details of which are well-documented in previous work 29, 30. Here, HOPG was used as the cathode and a copper wire as an anode within sodium phosphate solution (10 mM), and a DC voltage of 1.5 V was applied for 90 s.
To create oil nanodroplets, polydimethylsiloxane (PDMS) (Sylgard 184, Dow Corning, United States) was diluted with de-ionized water to 1:10,000 (vol/vol) (as described in 9) and then directly deposited on HOPG.
4.2 AFM imaging
Atomic force microscopy scans were captured with a Bioscope Catalyst AFM (Bruker Corporation, United States). A V-shaped cantilever (SNL-10 A, Bruker) with a nominal spring constant of 0.35 N m-1 was used in an open liquid system. Before experiments, the AFM tip was treated with oxygen plasma for 15 s to render it hydrophilic, and the cantilever’s spring constant was calibrated by a thermal method using built-in software.
To provide a baseline distribution of nanobubbles and nanodroplets that can be compared with previous work (Figure 1), nanobubbles and nanodroplets were independently imaged in the commonly-used tapping mode at a setpoint ratio of , where nm is the free amplitude of the cantilever.
We studied the influence of primarily vertical imaging forces on the objects (Figure 2) by imaging in PeakForce tapping mode. In PeakForce mode, the cantilever is oscillated at a machine-selected frequency of about 1-2 kHz, far below its resonance in water ( kHz) 21.
4.3 Calculation of contact angle
All contact angles reported in the manuscript are calculated with a custom algorithm in Python with the scipy package. The left and right boundaries of the bubble were determined using a peak finding algorithm 31, before all the height points between the two detected boundaries were fitted using a standard least squares algorithm to a circle (spherical cap in axis symmetry). Finally, to determine the contact angle, a chord was constructed by interpolating points on the substrate outside the bubble. From the position of this chord relative to the circle, an elementary geometrical relation yields the contact angle.
We acknowledge funding from a competitive research programme under the auspices of the Singapore government’s National Research Foundation (programme no. NRF-CRP9-2011-04). B.H.T. acknowledges financial support from the Agency of Science, Technology and Research in Singapore.
The Supporting Information consists of a single file with four additional figures and one table.
References
- Craig 2010 Craig, V. S. J. Very small bubbles at surfaces–the nanobubble puzzle. Soft Matter 2010, 7, 40–48
- Seddon and Lohse 2011 Seddon, J. R. T.; Lohse, D. Nanobubbles and micropancakes: gaseous domains on immersed substrates. J. Phys.: Condens. Matter 2011, 23, 133001
- Lohse and Zhang 2015 Lohse, D.; Zhang, X. Surface nanobubbles and nanodroplets. Rev. Mod. Phys. 2015, 87, 981–1035
- Zhang et al. 2015 Zhang, X.; Lu, Z.; Tan, H.; Bao, L.; He, Y.; Sun, C.; Lohse, D. Formation of surface nanodroplets under controlled flow conditions. Proc. Natl. Acad. Sci. U.S.A. 2015, 112, 9253–9257
- Karatay et al. 2013 Karatay, E.; Haase, A. S.; Visser, C. W.; Sun, C.; Lohse, D.; Tsai, P. A.; Lammertink, R. G. H. Control of slippage with tunable bubble mattresses. Proc. Natl. Acad. Sci. U.S.A. 2013, 110, 8422–8426
- Zhang and Ducker 2007 Zhang, X. H.; Ducker, W. Formation of Interfacial Nanodroplets through Changes in Solvent Quality. Langmuir 2007, 23, 12478–12480
- German et al. 2014 German, S. R.; Wu, X.; An, H.; Craig, V. S. J.; Mega, T. L.; Zhang, X. Interfacial Nanobubbles Are Leaky: Permeability of the Gas/Water Interface. ACS Nano 2014, 8, 6193–6201
- Chan and Ohl 2012 Chan, C. U.; Ohl, C.-D. Total-Internal-Reflection-Fluorescence Microscopy for the Study of Nanobubble Dynamics. Phys. Rev. Lett. 2012, 109, 174501
- Berkelaar et al. 2014 Berkelaar, R. P.; Dietrich, E.; Kip, G. A. M.; Kooij, E. S.; Zandvliet, H. J. W.; Lohse, D. Exposing nanobubble-like objects to a degassed environment. Soft Matter 2014, 10, 4947–4955
- An et al. 2014 An, H.; Liu, G.; Craig, V. S. J. Wetting of nanophases: Nanobubbles, nanodroplets and micropancakes on hydrophobic surfaces. Adv. Colloid Interfac. 2014, 222, 9–12
- Carr et al. 2012 Carr, J. A.; Nalwa, K. S.; Mahadevapuram, R.; Chen, Y.; Anderegg, J.; Chaudhary, S. Plastic-Syringe Induced Silicone Contamination in Organic Photovoltaic Fabrication: Implications for Small-Volume Additives. ACS Appl. Mater. Interfaces 2012, 4, 2831–2835
- Buettner et al. 1991 Buettner, G. R.; Scott, B. D.; Kerber, R. E.; Mügge, A. Free radicals from plastic syringes. Free Rad. Bio. Med. 1991, 11, 69–70
- Siniawski et al. 2015 Siniawski, M. T.; Felts, J.; Kurilich, D.; Lopez, A.; Malik, A. Method for testing sliding frictional response of lubricious thin films used in plastic medical syringes. Tribology S 2015,
- Curtis and Colas 2013 Curtis, J.; Colas, A. In Biomaterials Science (Third Edition); Ratner, B. D., Ed.; Academic Press, 2013; pp 1106–1116
- Chan et al. 2015 Chan, C. U.; Chen, L.; Arora, M.; Ohl, C.-D. Collapse of Surface Nanobubbles. Phys. Rev. Lett. 2015, 114, 114505
- Seo et al. 2015 Seo, D.; German, S. R.; Mega, T. L.; Ducker, W. A. The Phase State of Interfacial Nanobubbles. J. Phys. Chem. C 2015, 119, 14262–14266
- Yang et al. 2013 Yang, C.-W.; Lu, Y.-H.; Hwang, I.-S. Imaging surface nanobubbles at graphite-water interfaces with different atomic force microscopy modes. J. Phys.: Condens. Matter 2013, 25, 184010
- Walczyk et al. 2013 Walczyk, W.; Schön, P. M.; Schönherr, H. The effect of PeakForce tapping mode AFM imaging on the apparent shape of surface nanobubbles. J. Phys. Cond. Mat. 2013, 25, 184005
- Zhao et al. 2013 Zhao, B.; Song, Y.; Wang, S.; Dai, B.; Zhang, L.; Dong, Y.; Lü, J.; Hu, J. Mechanical mapping of nanobubbles by PeakForce atomic force microscopy. Soft Matter 2013, 9, 8837–8843
- Heslot et al. 1989 Heslot, F.; Fraysse, N.; Cazabat, A. M. Molecular layering in the spreading of wetting liquid drops. Nature 1989, 338, 640–642
- Kaemmer 2011 Kaemmer, S. B. Application note 133: introduction to Bruker’s ScanAsyst and PeakForce Tapping AFM Technology. Bruker Corporation, 2011
- Attard and Miklavcic 2001 Attard, P.; Miklavcic, S. J. Effective Spring Constant of Bubbles and Droplets. Langmuir 2001, 17, 8217–8223
- Attard 2015 Attard, P. Direct Measurement of the Surface Tension of Nanobubbles. arXiv:1505.02217 [cond-mat, physics] 2015,
- Ismail et al. 2009 Ismail, A. E.; Grest, G. S.; Heine, D. R.; Stevens, M. J.; Tsige, M. Interfacial Structure and Dynamics of Siloxane Systems: PDMS-Vapor and PDMS-Water. Macromolecules 2009, 42, 3186–3194
- Zhang et al. 2006 Zhang, X. H.; Maeda, N.; Craig, V. S. J. Physical Properties of Nanobubbles on Hydrophobic Surfaces in Water and Aqueous Solutions. Langmuir 2006, 22, 5025–5035
- An et al. 2015 An, H.; Liu, G.; Atkin, R.; Craig, V. S. J. Surface Nanobubbles in Nonaqueous Media: Looking for Nanobubbles in DMSO, Formamide, Propylene Carbonate, Ethylammonium Nitrate, and Propylammonium Nitrate. ACS Nano 2015, 9, 7596–7607
- Chan et al. 2001 Chan, D.; Dagastine, R.; White, L. Forces between a rigid probe particle and a liquid interface: I. The repulsive case. J. Colloid Interfac. Sci. 2001, 236, 141–154
- Connell et al. 2002 Connell, S. D. A.; Allen, S.; Roberts, C. J.; Davies, J.; Davies, M. C.; Tendler, S. J. B.; Williams, P. M. Investigating the Interfacial Properties of Single-Liquid Nanodroplets by Atomic Force Microscopy. Langmuir 2002, 18, 1719–1728
- Wu et al. 2008 Wu, Z.; Chen, H.; Dong, Y.; Mao, H.; Sun, J.; Chen, S.; Craig, V. S.; Hu, J. Cleaning using nanobubbles: defouling by electrochemical generation of bubbles. J. Colloid Interfac. Sci. 2008, 328, 10–14
- Yang et al. 2009 Yang, S.; Tsai, P.; Kooij, E. S.; Prosperetti, A.; Zandvliet, H. J.; Lohse, D. Electrolytically generated nanobubbles on highly orientated pyrolytic graphite surfaces. Langmuir 2009, 25, 1466–1474
- Duarte 2015 Duarte, M. Notes on Scientific Computing for Biomechanics and Motor Control. \urlhttps://github.com/demotu/BMC, 2015