Coauthorship and citation networks for statisticians: Comment
1 Introduction
Analyses of coauthorship and citation networks offer a fertile ground for studying research and collaboration patterns of scientific communities. Ji and Jin’s efforts of collecting, cleaning and summarizing in various ways citation and coauthorship networks for statisticians is a great step forward to provide the community with a first such data set for self-study. They perform several descriptive analyses of the underlying networks to extract interesting patterns: they study trends of productivity over time, extract most prolific authors and research areas using various centrality measures, and find communities in these networks. We look forward to seeing this dataset serving as a yardstick for fitting social network models to large datasets. Perhaps more interestingly, we see it as raising new research questions from the modeling, data representation and computational points of view and becoming a standard testbed for evaluating network models – both old and new – and testing scalability of inference procedures. In this regard, it is with great pleasure that we write this comment.
Here we take a model-based approach and consider the effects of various types of author interactions on the analysis and inference about the citation and coauthorship datasets. We are generally interested in three types of questions, two of which we discuss here: what are well-fitting models for the data? Is a simple network representation is best for answering questions we ask, or should we be considering alternative representations? How can we scale existing network model fitting and goodness-of-fit testing procedures to networks of this size, as well as larger networks that the authors intend to collect? These forthcoming data sets should reduce sampling bias, but of course come at a price of a dramatic increase in network size and computational cost. We expect that availability of the datasets Ji and Jin have provided the community will encourage methodological research to push the limits of performing non-asymptotic inference in large and sparse networks.
We became aware of their data collection effort at a time when we were developing a basic exponential family model for hypergraphs, placing probabilities on occurrence of connected groups of nodes of arbitrary size instead of pairs of nodes in a random graph. Indeed, in Stasi et al. (2014), a mock example of a coauthorship dataset is used as a motivation for the new model. Subsequently, we introduced an ERGM that is based on a summary of a global connectivity structure called -core decomposition (Karwa et al., ). Hence, we reconsider Ji and Jin’s data through the lens of these two network models, but first let us begin with some more classical models.
2 Fitting dyad-independent models based on node degrees
The data collected by Ji and Jin contains two key datasets: (1) a bipartite graph of authors and papers where a link exists from node to node if author wrote paper ; (2) a network of citations of papers where a link exists from node to node if paper cites paper . From these two datasets, Ji and Jin extract two networks whose nodes are authors: two coauthorship networks and one citation network. In the “Coauthorship network A” there is an undirected edge between nodes and if author coauthored at least papers with author . In the “Coauthorship network B” there is an undirected edge between nodes and if author coauthored at least paper with author . In the citation network of authors, there is a directed edge from author to author if has cited at least paper by .
It is important to note that, strictly speaking, the number of citations between authors and the number of coauthors are counts greater than . They are converted to a binary network by using thresholding, a popular technique in network analysis used to avoid multiple edges. Moreover, in the citation network of authors, the self citations are set to to avoid loops in the network representation, so that the result is a desirable simple graph.
Once a network representation is extracted from the data, there are many ways to analyze it using descriptive statistics. For instance, Ji and Jin consider degree centrality of these extracted networks to measure the importance of nodes. In the coauthorship network, they use node degrees to identify most collaborative authors, while in the citation network of authors, they use the number of citers – the in-degree of the corresponding directed graph – to identify top authors. From the point of view of modeling, it is natural to ask whether degree-based analysis is sufficient for these networks; in particular, models based on degrees exhibit dyadic independence and we question whether such an assumption is valid. In other words, when a statistic is used to summarize a dataset, we see it as a sufficient statistic of some model and then ask what that model is and how well it fits the data.
We investigate the above question for node degrees of both citation and coauthorship networks. The simplest but nicely interpretative model for random directed graphs whose sufficient statistics are the node in- and out-degrees is the model (Holland and Leinhardt, 1981). The model assumes that dyads (i.e., citation pairs) are independent and assigns probabilities to four types of citations: outgoing, incoming, reciprocated, and none, represented by , , , and , respectively. Node-specific parameters represent attractiveness and expansiveness, and there is an additional parameter for the overall tendency of the network to reciprocate citations. This parameter can be set to be zero or a nonzero constant; Holland and Leinhardt consider both versions of the model. Fienberg and Wasserman (1981) represent in log-linear form, turning networks into contingency tables, and extend the model to allow for the differential reciprocity effect by including dyad-specific reciprocation parameters. (The model was later extended to fit within the block model framework; see Fienberg, Meyer and Wasserman (1985).) For undirected graphs such as the coauthorship network, reduces to the model (Blitzstein and Diaconis, 2010) that has had a long history in various literatures.
The log-linear representation allows the use of tools from algebraic statistics introduced in Diaconis and Sturmfels (1998) to fit the model and perform a non-asymptotic goodness-of-fit test; see Petrović, Rinaldo and Fienberg (2010) for the basic theoretical results for the model and Gross, Petrović and Stasi (2015) for generalizations and implementation.
Results of goodness-of-fit tests.
We perform an exact test of model fit for the model with dyad-dependent reciprocation (the most general version) to the largest connected component of the citation network of authors. The test is done by running the Markov chain from Gross, Petrović and Stasi (2015). After steps, the resulting -value is . This result indicates that the model does not fit the citation network of authors.
The lack of fit of the model suggests that the network of citations may have tendencies to be transitive and the dyads may not be independent. While counting citations is a natural way to perform rankings, such a count – corresponding to the directed degree sequence of the citation network – does not offer a good summary statistic for the citation network data. Instead, we need to look for other more complex measures of centrality, for example those that are also able to capture triadic or transitive effects.
Another comment is in order. The variants of the model are naturally set up to test the reciprocation effect: do authors reciprocate citations? That is, if author cites author , is author likely to cite a paper by author ? The lack of fit of the model that captures the reciprocation effect means that the answer to this question is ‘no’, however, it does not directly imply that there are no transitive effects of other kinds that we are unable to test at the moment.
Similarly, we perform an exact test of model fit of the model to the largest connected component of the coauthorship network . The -value from the goodness-of-fit test obtained by running the Markov chain on steps is , indicating a pretty good fit. The dyads in the coauthorship network can be assumed to be independent, and the network does not have any triadic closure effects; i.e., if author wrote a paper with author , and author wrote a paper with author , then it is not necessary that author has written a paper with author . This result is somewhat surprising since experience suggests that collaborators of an author may tend to collaborate with each other, including . On a closer look, perhaps it is less surprising: forgetting the structure of the original data set and converting it to the underlying graph (by recording only the dyadic relationships) results in independence and node degrees being a good summary of the graph.
3 What lies beyond node degrees?
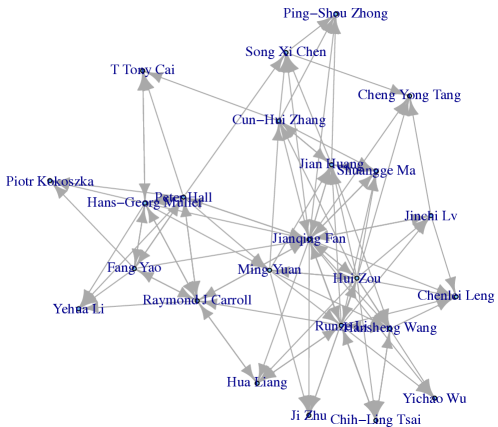
As we saw above, the model based on node degrees does not fit the citation network and, hence, degree-based analyses may be of suspect. It is well-known that, in general, degree-based models may fail to capture certain vital connectivity information about the network. In applications such as the present one, we may be interested in the type of global connectedness effectively captured by the cores decomposition of a graph introduced by Seidman (1983) (see Karwa et al. for statistical considerations). For the directed citation network, we compute the -core using the in-degree which measures the number of times an author is cited. Intuitively, the -core captures the innermost core of “highly cited” authors. To be in the innermost core, it is not sufficient to have the highest number of citations, but one must receive citations from authors who are themselves cited by many.
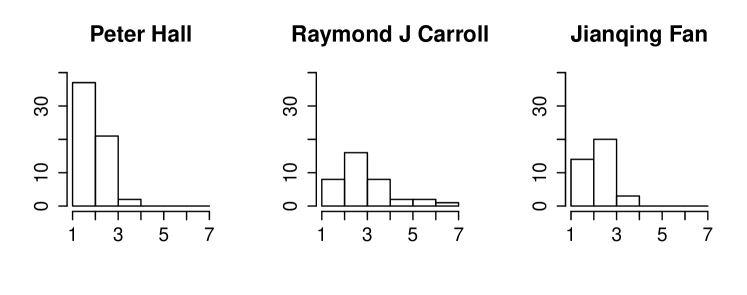
To convert the citation counts between authors to a directed network of author citations, we use varying threshold values . A directed edge exists from node to node if author cites author at least times. We consider , providing different networks. Table 1 shows results of selecting the top highly cited authors based on their degree in the respective cores.
| 1 | 2 | 3 | 4 | 5 |
|---|---|---|---|---|
| Jianqing Fan | Jianqing Fan | Jianqing Fan | Jianqing Fan | Peter Hall |
| Hui Zou | Hui Zou | Hui Zou | Hui Zou | Hans-Georg Muller |
| Ming Yuan | Peter Buhlmann | Peter Hall | Runze Li | Raymond J Carroll |
| Peter Buhlmann | Cun-Hui Zhang | Runze Li | Peter Hall | Fang Yao |
| Runze Li | Runze Li | Raymond J Carroll | Hans-Georg Muller | Jianqing Fan |
Compare the results of Table 1 to Column 3 of Table 2, where Ji and Jin identified the top 3 most cited authors,“Jianqing Fan”, “Hui Zou”, “Peter Hall”, using the in-degree. When “Jianqing Fan” and “Hui Zou” appear as the top 2 authors, and Peter Hall appears in the third place only when . However, when , Peter Hall is the most cited author. Our goal here is to simply illustrate the point the results depend on the type of centrality measure chosen, and the threshold used to create the network.
As an illustration, Figure 1 shows the innermost core of the citation network of authors when .
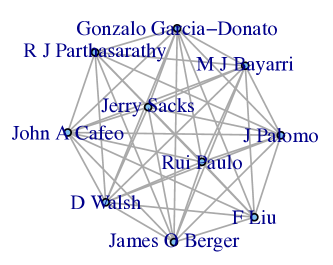
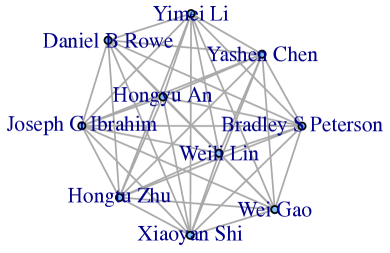
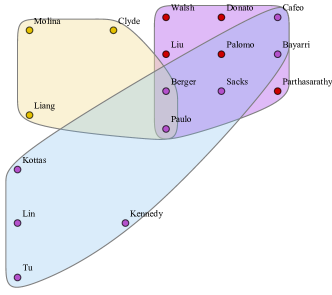
The -core decomposition of the coauthorship network is also instructive. For this case, we perform a core decomposition of the coauthorship network . Figure 2 shows the inner most core of the coauthorship network. The innermost core of the coauthorship network consists of two connected components and every node has degree 9! In other words, the innermost core consists of 2 cliques of size . On further exploration, it turns out that the two cliques correspond to two papers, Bayarri et al. (2007) and Zhu et al. (2009), each with authors. This example illustrates that a network representation of the coauthorship data can be misleading: it is not possible to distinguish between the cases of authors writing many joint papers and when many authors writing one.
4 Need for new models and representations
Both of the previous two sections motivate recording higher-order interactions from the data. In addition, Table 1 suggests the thresholding is not good as it looses information. There are several ways to represent the data, two common structures being a network (undirected, directed or bipartite) and a contingency table, each allowing for different analyses to be carried out. That is, the type of model that can be fitted to the data depends on the representation.
Contingency table representation.
For authors, research areas and journals, consider an contingency table where the entry counts the number of times author cites author in research area and journal . A similar representation can be obtained for the coauthorship network, where we count the number of times author and author wrote a joint paper. These representations preserve the citation and coauthorship count data. We can then collapse the table to an author-by-author table and fit log linear models to the citation counts. In essence, we seek to avoid thresholding, as in the generalized model discussed by Rinaldo, Petrović and Fienberg (2013) for weighted networks represented in table form.
Hypergraph representation.
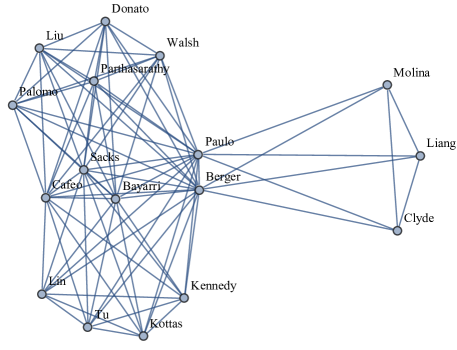
Coauthorship networks may not be measuring what they intend to measure; recall illustrative examples above. To prevent information loss and model higher-order interactions, we represent the raw coauthorship data via a hypergraph, which is a generalization of a graph. A random hypergraph is a collection of random hyperedges which are occurrence of groups of nodes of arbitrary size . For example, a hyperedge (for simplicity also called an edge) of size containing nodes exists if authors wrote a joint paper. Figures 3, 4, and Table 2 highlight different aspects of the data that can be extracted from the hypergraph representation.
Stasi et al. (2014) introduce models for random hypergraphs. Lunagómez et al. (to appear) give a geometric representation of hypergraphs. Clearly, more complex statistical models for random hypergraphs are necessary, as the degree-based model is sure to have similar shortcomings on hypergraphs as it did on graphs. In addition, Figure 4 suggests placing heterogeneous weights on hypergraph degrees with respect to edge size. Furthermore, we may wish to preserve edge multiplicities representing multiple joint papers by same groups in contingency table form here as well.
| 1 | 2 | 3 | 4 | 5 |
|---|---|---|---|---|
| Peter Hall | Peter Hall | Raymond J Carroll | Raymond J Carroll | Joseph G Ibrahim |
| Raymond J Carroll | Raymond J Carroll | Peter Hall | Joseph G Ibrahim | Raymond J Carroll |
| Jianqing Fan | Jianqing Fan | Jianqing Fan | Hongtu Zhu | Hongtu Zhu |
References
- Bayarri et al. (2007) {barticle}[author] \bauthor\bsnmBayarri, \bfnmMJ\binitsM., \bauthor\bsnmBerger, \bfnmJO\binitsJ., \bauthor\bsnmCafeo, \bfnmJohn\binitsJ., \bauthor\bsnmGarcia-Donato, \bfnmG\binitsG., \bauthor\bsnmLiu, \bfnmF\binitsF., \bauthor\bsnmPalomo, \bfnmJ\binitsJ., \bauthor\bsnmParthasarathy, \bfnmRJ\binitsR., \bauthor\bsnmPaulo, \bfnmR\binitsR., \bauthor\bsnmSacks, \bfnmJerry\binitsJ. and \bauthor\bsnmWalsh, \bfnmD\binitsD. (\byear2007). \btitleComputer model validation with functional output. \bjournalThe Annals of Statistics \bpages1874–1906. \endbibitem
- Blitzstein and Diaconis (2010) {barticle}[author] \bauthor\bsnmBlitzstein, \bfnmJoseph\binitsJ. and \bauthor\bsnmDiaconis, \bfnmPersi\binitsP. (\byear2010). \btitleA sequential importance sampling algorithm for generating random graphs with prescribed degrees. \bjournalInternet Math \bvolume6 \bpages489-522. \endbibitem
- Diaconis and Sturmfels (1998) {barticle}[author] \bauthor\bsnmDiaconis, \bfnmPersi\binitsP. and \bauthor\bsnmSturmfels, \bfnmBernd\binitsB. (\byear1998). \btitleAlgebraic algorithms for sampling from conditional distributions. \bjournalAnnals of Statistics \bvolume26 \bpages363–397. \endbibitem
- Fienberg, Meyer and Wasserman (1985) {barticle}[author] \bauthor\bsnmFienberg, \bfnmStephen E\binitsS. E., \bauthor\bsnmMeyer, \bfnmMichael M\binitsM. M. and \bauthor\bsnmWasserman, \bfnmStanley S\binitsS. S. (\byear1985). \btitleStatistical analysis of multiple sociometric relations. \bjournalJournal of the american Statistical association \bvolume80 \bpages51–67. \endbibitem
- Fienberg and Wasserman (1981) {barticle}[author] \bauthor\bsnmFienberg, \bfnmStephen E.\binitsS. E. and \bauthor\bsnmWasserman, \bfnmS. S.\binitsS. S. (\byear1981). \btitleDiscussion of Holland, P. W. and Leinhardt, S. “An Exponential Family of Probability Distributions for Directed Graphs.”. \bjournalJournal of the American Statistical Association \bvolume76 \bpages54–57. \endbibitem
- Gross, Petrović and Stasi (2015) {barticle}[author] \bauthor\bsnmGross, \bfnmElizabeth\binitsE., \bauthor\bsnmPetrović, \bfnmSonja\binitsS. and \bauthor\bsnmStasi, \bfnmDespina\binitsD. (\byear2015). \btitleGoodness-of-fit for log-linear network models: Dynamic Markov bases using hypergraphs. \bjournalAnnals of the Institute of Statistical Mathematics. \bnoteDOI: 10.1007/s10463-016-0560-2. \endbibitem
- Holland and Leinhardt (1981) {barticle}[author] \bauthor\bsnmHolland, \bfnmPaul W.\binitsP. W. and \bauthor\bsnmLeinhardt, \bfnmSamuel\binitsS. (\byear1981). \btitleAn exponential family of probability distributions for directed graphs (with discussion). \bjournalJournal of the American Statistical Association \bvolume76 \bpages33–65. \endbibitem
- (8) {bunpublished}[author] \bauthor\bsnmKarwa, \bfnmVishesh\binitsV., \bauthor\bsnmPelsmajer, \bfnmMichael\binitsM., \bauthor\bsnmPetrović, \bfnmSonja\binitsS., \bauthor\bsnmStasi, \bfnmDespina\binitsD. and \bauthor\bsnmWilburne, \bfnmDane\binitsD. \btitleStatistical models for cores decomposition of an undirected random graph. \bnoteSubmitted; in revision. \endbibitem
- Lunagómez et al. (to appear) {barticle}[author] \bauthor\bsnmLunagómez, \bfnmSimón\binitsS., \bauthor\bsnmMukherjee, \bfnmSayan\binitsS., \bauthor\bsnmWolpert, \bfnmRobert L.\binitsR. L. and \bauthor\bsnmAiroldi, \bfnmEdoardo M.\binitsE. M. (\byearto appear). \btitleGeometric representations of random hypergraphs. \bjournalJournal of the American Statistical Association \bvolume0 \bpages1-66. \bdoi10.1080/01621459.2016.1141686 \endbibitem
- Petrović, Rinaldo and Fienberg (2010) {binproceedings}[author] \bauthor\bsnmPetrović, \bfnmSonja\binitsS., \bauthor\bsnmRinaldo, \bfnmAlessandro\binitsA. and \bauthor\bsnmFienberg, \bfnmStephen E.\binitsS. E. (\byear2010). \btitleAlgebraic statistics for a directed random graph model with reciprocation. In \bbooktitleAlgebraic Methods in Statistics and Probability II (\beditor\bfnmMarlos A. G.\binitsM. A. G. \bsnmViana and \beditor\bfnmHenry\binitsH. \bsnmWynn, eds.). \bseriesContemporary Mathematics \bvolume516. \bpublisherAmerican Mathematical Society. \endbibitem
- Rinaldo, Petrović and Fienberg (2013) {barticle}[author] \bauthor\bsnmRinaldo, \bfnmAlessandro\binitsA., \bauthor\bsnmPetrović, \bfnmSonja\binitsS. and \bauthor\bsnmFienberg, \bfnmStephen E.\binitsS. E. (\byear2013). \btitleMaximum Likelihood Estimation in the Beta model. \bjournalAnnals of Statistics \bvolume41 \bpages1085-1110. \endbibitem
- Seidman (1983) {barticle}[author] \bauthor\bsnmSeidman, \bfnmStephen B.\binitsS. B. (\byear1983). \btitleNetwork structure and minimum degree. \bjournalSocial Networks \bvolume5 \bpages269-287. \endbibitem
- Stasi et al. (2014) {binproceedings}[author] \bauthor\bsnmStasi, \bfnmDespina\binitsD., \bauthor\bsnmSadeghi, \bfnmKayvan\binitsK., \bauthor\bsnmRinaldo, \bfnmAlessandro\binitsA., \bauthor\bsnmPetrović, \bfnmSonja\binitsS. and \bauthor\bsnmFienberg, \bfnmStephen E.\binitsS. E. (\byear2014). \btitleBeta models for random hypergraphs with a given degree sequence. In \bbooktitleProceedings of 21st International Conference on Computational Statistics. \endbibitem
- Zhu et al. (2009) {barticle}[author] \bauthor\bsnmZhu, \bfnmHongtu\binitsH., \bauthor\bsnmLi, \bfnmYimei\binitsY., \bauthor\bsnmIbrahim, \bfnmJoseph G\binitsJ. G., \bauthor\bsnmShi, \bfnmXiaoyan\binitsX., \bauthor\bsnmAn, \bfnmHongyu\binitsH., \bauthor\bsnmChen, \bfnmYashen\binitsY., \bauthor\bsnmGao, \bfnmWei\binitsW., \bauthor\bsnmLin, \bfnmWeili\binitsW., \bauthor\bsnmRowe, \bfnmDaniel B\binitsD. B. and \bauthor\bsnmPeterson, \bfnmBradley S\binitsB. S. (\byear2009). \btitleRegression models for identifying noise sources in magnetic resonance images. \bjournalJournal of the American Statistical Association \bvolume104 \bpages623–637. \endbibitem