Topic Grids for Homogeneous Data Visualization
Abstract
We propose the topic grids to detect anomaly and analyze the behavior based on the access log content. Content-based behavioral risk is quantified in the high dimensional space where the topics are generated from the log. The topics are being projected homogeneously into a space that is perception- and interaction-friendly to the human experts.
I Introduction
To make the data points in the high dimensional space visible to human, a word embedding (or dimension reduction) technique is employed to map the data points to a lower dimensional space . The word embedding technique of choice attempts to preserve some relationship among the data points in after mapping them to .
The output from the dimension reduction algorithm is a set of data points that are non-uniformly scattered around the visualization space. This helps to explain the clustering behavior, including inter-cluster and intra-cluster, among the data points. However, there are also some drawbacks:
-
1.
The clusters tangle with others; some data points overlap with others. Overlap makes the information less perceivable.
-
2.
The data points are denser in some area. The heterogeneity makes human interaction with the data points more difficult.
In order to better utilize the visualization space, we propose to distribute the data points evenly over the visualization space. The cloud of data points is deformed in the same space defined by the dimension reduction algorithm of choice.
II Method
The algorithm we propose is called the split-diffuse (SD) algorithm (Algorithm 1). It attempts to realize the strategy above.
Input: data points of length , depth , allocation string
split-diffuse (, , )
| return | ( | [split-diffuse (, +1, +'L')], |
| [split-diffuse (, +1, +'R')]) |
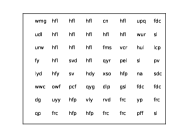
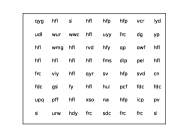
We keep track of the splitting path in string . At the end of the recursion, the placement each single point is resolved. The indexes of the SD-mapped points, , are all integers, and forms a array. This means that the mapped data points are equally spaced in a square. To achieve this uniformity in the space , the data points are essentially diffused from the denser area to the coarser area by the SD algorithm — hence the name split-diffuse.
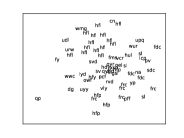
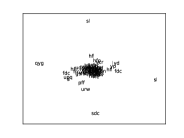
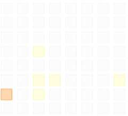
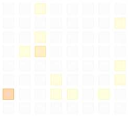
In Figure 1, we generate topics regarding to the content of some repository access logs. A topic is represented by the first three letters of the most descriptive word. The three letters are then encrypted. There are topics sharing the same most descriptive word, but they are different topics, and can further be distinguished by the less descriptive words.
In the high dimensional space (in our case has 19K+ dimensions) where the topics are created, the topics sharing the same representative word tend to stay close to each other. The topics are mapped from to a 2D space , via MDS [1] and t-SNE [2]. The SD algorithm follows to produce the uniform placement. Having the topics sharing the same representative word stay close to each other after the SD mapping is another desirable feature.
III Performance
| Layout | Sampling | Constraints | ||
|---|---|---|---|---|
| 240 | 0.2042 | 0.0292 | ||
| 4,032 | 0.1347 | 0.0270 | ||
| 65,280 | 0.0776 | 0.0192 | ||
| 1,047,552 | 0.0426 | 0.0124 | ||
| 16,773,120 | 0.0228 | 0.0074 | ||
| 240 | 0.2368 | 0.0618 | ||
| 4,032 | 0.1845 | 0.0769 | ||
| 65,280 | 0.1459 | 0.0875 | ||
| 1,047,552 | 0.1242 | 0.0940 | ||
| 16,773,120 | 0.1131 | 0.0977 |
In order to measure the performance of the SD algorithm, we randomly generate the topics in the 2D space . We define to be the ratio of violated topology constraints. For example, when is to the right of , the placement of not being to the right of is a violation. There are totally such constraints in a 2D space . A loosen metric is defined so that the constraint in dimension is not violated when .
The random topics are generated over a 2D space via the uniform approach , where topics are sampled within a square; and the Gaussian approach , where topics are sampled from two-variate Gaussian distribution with the magnitude in one variant doubling the other, and then rotated by .
decreases as the grid set size increases on both and samplings. However, only decreases as the grid set size increases on the sampling. increases as the grid set size increases on the sampling. Moreover, although decreases as the grid set size increases on both and samplings, the decrease rate varies. On the sampling, decreases almost when the layout increase from to . However, only decreases around half of its value during the same layout increase for the sampling.
IV Application and Conclusion
We apply the SD algorithm to help analyzing behavioral content in the cyber security domain. The goal of the system is to detect behavioral anomaly based on the access logs. A log entry usually has a timestamp, a unique identifier of a user, an action, and the content on which the action was performed. After proper punctuation, the path, the content, and/or any meta data regarding to this access can be viewed as a document, called the content document. We use the latent Dirichlet allocation (LDA) model [3] to decide the topics among all these content documents over a benchmark period of time.
In our system, topics are generated at a word vector space of dimensions. The relevance between a content document and each individual topic is measured. The anomaly, or risk, of an access is quantified by comparing the topics involved in this access with the topics involved in the historical accesses of the same user, as well as the topics involved in the accesses of the peers of this user.
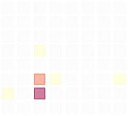
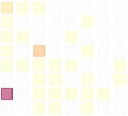
The output of the SD algorithm for our system is a set of topic grids, where the topics are placed over a layout. The same set of topic grids is used to render the amount of activities on each topic and the risk on each topic. One use case is presented in Figure 2. The human expert can interact with the grids and get detailed explanation about the topic (e.g., mouse over for topic content and click for access detail). Such type of interaction is hard to achieve with the conventional word embedding techniques. like the ones in Figure 1 (a) and (c).
In addition to the cyber security domain, the topic grids can be applied to other domains like e-commerce, credit card transaction, customer service, wherever the content document can be derived from the log files.
References
- [1] W. S. Torgerson, “Multidimensional scaling: I. theory and method,” Psychometrika, vol. 17, no. 4, pp. 401–419, 1952.
- [2] L. Van der Maaten and G. E. Hinton, “Visualizing data using t-SNE,” Journal of Machine Learning Research, vol. 9, no. 2579-2605, p. 85, 2008.
- [3] D. M. Blei, A. Y. Ng, and M. I. Jordan, “Latent dirichlet allocation,” Journal of Machine Learning Research, vol. 3, pp. 993–1022, 2003.