Capillary fracture of ultrasoft gels: heterogeneity and delayed nucleation
Abstract
A droplet of surfactant spreading on an ultrasoft ( Pa) gel substrate will produce capillary fractures at the gel surface; these fractures originate at the contact-line and propagate outwards in a starburst pattern. There is an inherent variability in both the number of fractures formed and the time delay before fractures form. In the regime where single fractures form, we observe a Weibull-like distribution of delay times, consistent with a thermally-activated process. The shape parameter is close to 1 for softer gels (a Poisson process), and larger for stiffer gels (indicative of aging). For single fractures, the characteristic delay time is primarily set by the elastocapillary length of the system, calculated from the differential in surface tension between the droplet and the substrate, rather than the elastic modulus as for stiffer systems. For multiple fractures, all fractures appear simultaneously and long delay times are suppressed. The delay time distribution provides a new technique for probing the energy landscape and fracture toughness of ultrasoft materials.
pacs:
83.80.Kn, 81.70.Bt, 47.20.Dr, 47.55.ndThe failure of soft materials is highly relevant to many biological and medical processes such as cellular dynamics (Levental et al., 2007; Beaune et al., 2014) or drug delivery over mucus membranes (Khanvilkar et al., 2001; Haitsma et al., 2001). These highly-deformable materials, which include gels, elastomers, and biological tissues, can have elastic moduli as low as Pa, and are sufficiently soft that they cannot support their own weight when freestanding. Material strength comes from cross-linked polymers that are known to have heterogeneous mechanical properties (Goldbart and Goldenfeld, 1989; Meyers et al., 2008), which makes performing traditional materials tests challenging. In this paper, we present a novel method for probing the strength of ultrasoft materials on the millimeter scale by using the surface tension (capillarity) of liquid droplets to provide well-controlled, but weak, surface forces. Our technique draws on both prior experiments on delayed fracture Bonn et al. (1998) and recent advances in understanding the spreading, wetting, and material failure in this elastocapillary regime (Jerison et al., 2011; Das et al., 2011a; Bostwick and Daniels, 2013; Bostwick et al., 2014).
In our experiments, we deposit a droplet of surfactant-water solution on the surface of an agar substrate and observe the formation of starburst-shaped capillary fractures that propagate radially outward from the contact-line. It has previously been observed that the number of fractures formed is controlled by the ratio of the surface tension contrast between the droplet and the gel and the elastic modulus of the gel substrate (Daniels et al., 2007). Similar instabilities have been observed on various gel/fluid combinations (Spandagos et al., 2012a, b; Foyart et al., 2013). Typical fracture experiments use increasing stress to find a fracture threshold or cyclic load to determine fatigue. In contrast, we apply a constant force in a technique similar to that of Bonn et al. (1998), where agarose gel rods ( kPa) were bent to a fixed strain and held until material failure arose through a thermally-activated process. This method allows for probing the energetics of the crosslinks from the statistical distribution of the delay times. We measure histograms for the delay time and number of fractures, revealing that the nucleation process is thermally-activated; this method allows for estimating the typical size of energy barriers Pomeau (1992).
It is helpful to contrast our approach with classic droplet-spreading experiments on solid (Tanner, 1979), strong gel (Szabo et al., 2000; Kaneko et al., 2005; Banaha et al., 2009; Kajiya et al., 2013) ( kPa) or liquid (Hoult, 1972) substrates. The elastocapillary length sets the scale of elastic deformation in problems involving the interactions between liquids and compliant substrates. (For reference, a droplet of water ( mN/m) wetting a glass substrate ( GPa) produces negligible deformations of size m.) Recently, attention has shifted to soft substrates (Pericet-Cámara et al., 2008; Kajiya et al., 2011; Das et al., 2011b; Jerison et al., 2011; Style and Dufresne, 2012; Marchand et al., 2012; Weijs et al., 2013; Henann and Bertoldi, 2014; Park et al., 2014; Style et al., ; Andreotti and Snoeijer, 2016), where these deformations are no longer negligible. For example, Jerison et al. (2011) used fluorescence confocal microscopy to quantify the deformations produced by a droplet of water on a silicone gel substrate ( kPa); these deformations are on the scale of m. The substrates we use in our experiments have an elastic modulus Pa with deformations m, which is a length scale on the same order as the droplet radius. Therefore, we refer to these materials as ultrasoft, with the resulting elastocapillary deformations large enough to cause the fracture of the substrate. Understanding the various regimes in which elastocapillary deformations are significant will aid in understanding the physics of fracture for soft materials.
Experiment:
We investigate the fracture of ultrasoft gel substrates, composed of agar (polysaccharide with galactose subunits) dissolved in deionized water. The concentrations investigated range from %w agar, which is above the gel transition at at C (Tokita and Hikichi, 1987). These concentrations correspond to an elastic modulus Pa; values of are obtained from the shear modulus measurements of Tokita and Hikichi (1987) under the assumption that the Poisson ratio due to the incompressibility of the water phase. Due to the strong dependence and the aging of gels (Scherer, 1988; Hodge, 1995), we find that repeatability of experiments requires careful control of the preparation process. Gels are prepared by dissolving agar powder into mL of deionized water at a temperature of C. The solution is poured into individual Petri dishes (diameter cm) and cooled overnight at room temperature C. The final thickness of each substrate was measured to be mm.
| Series | [%] | [Pa] | [ppm] | [mN/m] | [mm] | [mm] |
| 1 | 0.115 | 41.1 | 80 | 61.2 | 0.19 | 1.49 |
| 2 | 0.115 | 41.1 | 200 | 59 | 0.24 | 1.44 |
| 3 | 0.123 | 52.5 | 250 | 58 | 0.21 | 1.10 |
| 4 | 0.127 | 59.1 | 300 | 57 | 0.20 | 0.96 |
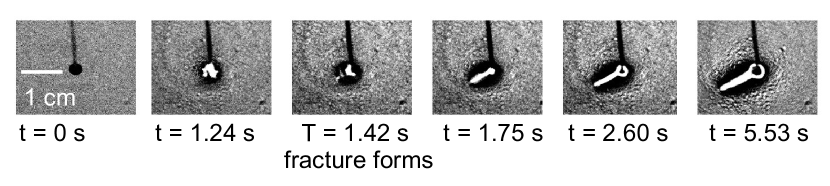
When a liquid droplet is placed on the surface of the gel, surface forces cause fractures to form, as shown in Fig. 1. To control the magnitude of these forces, we utilize Triton X-305 surfactant (Dow Chemical, octylphenoxy polyethoxy ethanol) dissolved in deionized water at concentration ranging from ppm. The droplet surface tension varies from mN/m with larger yielding smaller (Zhang et al., 2005). A volume-controlled syringe pump releases droplets of volume L from a height cm directly above the center of the gel substrate. For simplicity, we assume the surface tension of the gel is constant and we observe that the wetting behavior is primarily controlled by the surface tension contrast . Note that the shape of the droplet (and hence the contact line radius and surface force) are also important factors; this consideration is discussed in more detail in Bostwick and Daniels (2013).
Fractures are visualized using shadowgraphy: a point source of light passes through a converging lens resulting in parallel light that is transmitted through the sample, which is subject to refraction due to the variations in the index of refraction for the gel and the droplet. The image is captured on a ground glass screen located above the sample using a digital camera operating at frequency Hz. Our technique allows for the measurement of both the number of fractures and the delay time before fractures initiate. We calculate both the time when the droplet first contacts the substrate, and the delay time when a fracture forms, via an ad hoc image-processing code that identifies changes in the standard deviation of the image light intensity.
In previous work, Daniels et al. (2007) observed significant variation in the number of fractures observed for a fixed set of experimental parameters (, ). In order to probe how such variation arises, as well as the statistics of thermal activation, we minimize this variability. In addition to the strategies mentioned above (correcting agar concentration during pouring, aging gels for a consistent time, and using a syringe pump to deposit droplets), we embed the entire apparatus in a sandbox to damp out the acoustic noise and building vibrations that can prematurely initiate fractures. To obtain statistics to quantify these variations, we perform experiments on approximately samples divided among the four series listed in Table 1. This range of values covers a regime in which starbursts with to fractures are formed.
Results:
It has been previously reported (Daniels et al., 2007) that the mean number of fractures increases as a function of the quantity
| (1) |
This quantity is related to the elastocapillary length described above, since is approximately constant. However, note that and have the opposite trend as a function of . We quantify our results using both and , and determine that is the more natural choice for these experiments. For agar, is just slightly less (Daniels et al., 2007) than the value for pure water (72 mN/m) and is difficult to measure accurately. In the analyses that follow we use mN/m.
As illustrated in Fig. 1, fractures do not necessarily nucleate immediately after the droplet is placed on the gel substrate, but after some delay . We can understand this observation by considering the elastic deformations within the substrate, induced by the wetting forces between the droplet and the gel (Das et al., 2011b; Jerison et al., 2011; Bostwick and Daniels, 2013; Bardall et al., ). In general, the state of stress within the substrate is not quite large enough to cause material failure. Instead, the gel remains in this deformed elastic state until something triggers a failure, either an external perturbation or a thermal fluctuation.
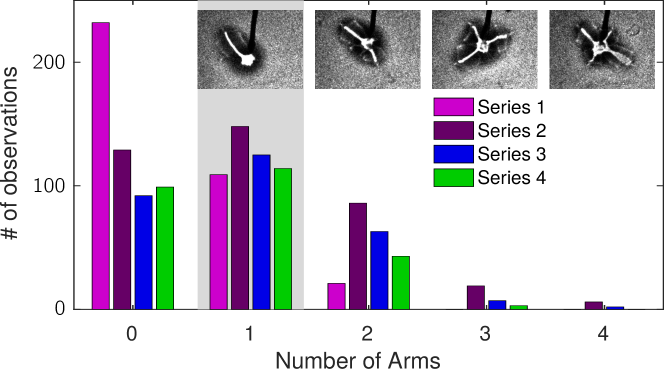
To quantify the dependence of the delay time on the properties of the gel substrate, we select three pairs of values for which is highly likely (see Fig. 2). (This was done empirically by selecting three values of , and varying (and hence ) until we observed fractures in approximately of the trials.) These pairs correspond to approximately constant mm, a length consistent with the size of observed surface deformations (Daniels et al., 2007). One set of parameters (Series 1) provides a control series, by matching the value of for Series 2, while still having as a highly likely outcome. Series 3 and 4 increase and decrease in order to maintain an approximately consistent histogram . Series 2 contains enough fractures with to allow for a semi-quantitative investigation of the delay statistics of multiarm starbursts.
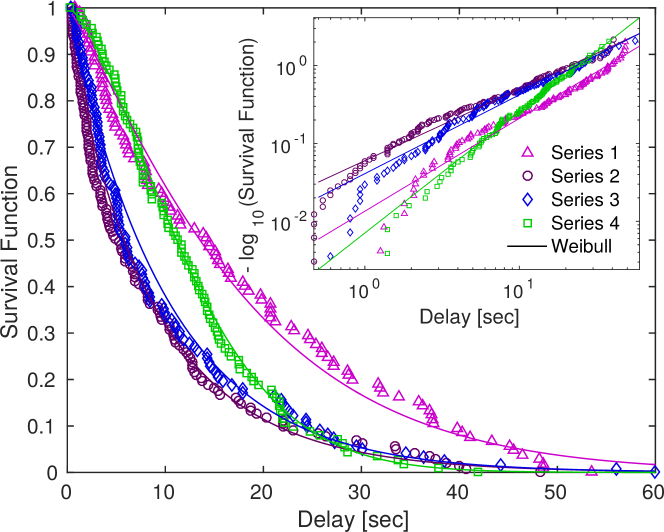
For each droplet deposited, we record the delay time . Survival functions for each series are shown in Fig. 3. The survival function (or complementary cumulative distribution) is the probability that a droplet survives less than time before producing fracture(s). We first focus on the set of starbursts with . For all four series, we observe delay times as long as a minute, with the Weibull plot (inset) revealing all datasets to be highly linear for large . Inevitably, the low- portion of the histogram contains an excess of data, triggered by non-thermal noise. For example, when we collect data in the presence of additional room noise, we observe that the delay times are systematically reduced from the observations shown here. Using Matlab’s wblfit() tool, we fit each waiting time distribution to a Weibull distribution: as shown in Fig 3. The corresponding form for the survival function is a stretched exponential ; this function takes the form of a straight line on a double-logarithmic plot (see Fig 3).
The fit parameters () carry two important interpretations to aid in understanding delayed fracture. The parameter represents a characteristic delay time and the parameter is a shape parameter. For the special case , the Weibull distribution reduces to an exponential distribution; this corresponds to Poisson-distributed events and constant failure rate. For this case (only), is identical to the mean delay time . A shape parameter indicates that the system ages such that failure is more likely the longer the delay.
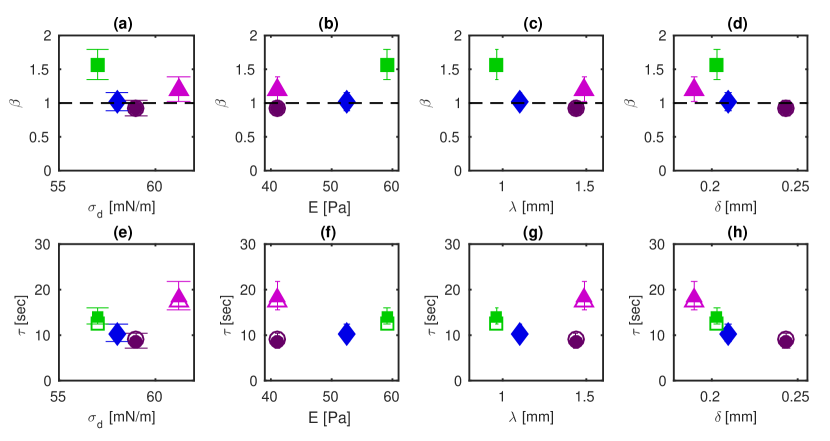
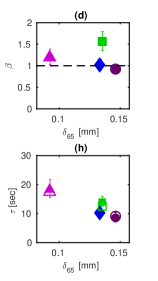
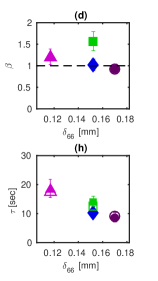
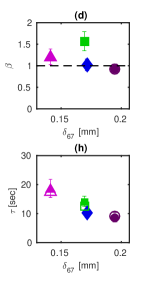
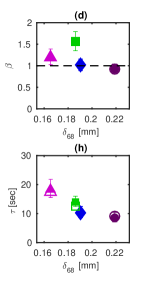
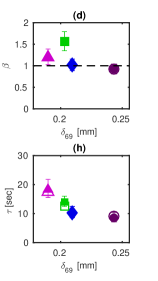
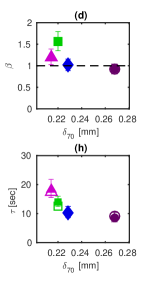
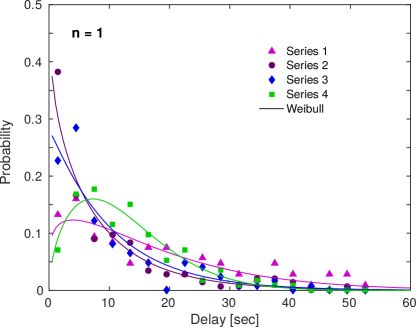
In Fig. 4, we examine how the material parameters set the failure dynamics, as parameterized by and . For all experiments, ; this indicates that the fracture dynamics are close to a Poisson process. This finding is consistent with what is expected for thermally-activated processes (Bonn et al., 1998). Additionally, we observe for all four data series, with larger deviations when is further from , as expected. In two cases (Series 1 & 4), we observe ; for these values the histograms are non-monotonic (see Supp. Mat.) This indicates that these gels age in a way that weakens them as a function of time elapsed since loading. Interestingly, Series 1 & 4 have the least in common when examined in light of their materials parameters (Table 1). We additionally observe (see Fig. 4b) that increases with , and does not monotonically depend on any of the other materials parameters.
The characteristic delay time is observed to decrease for increasing elastocapillary length , as shown in Fig. 4h. One possible interpretation of this result is that larger deformations (larger , equivalently larger stresses/strains inside the gels Bostwick and Daniels (2013); Bostwick et al. (2014)), lead to shorter delays before fracture. This decreasing trend is robust when considering other reasonable values of the gel surface tension in the range mN/m (see Supp. Mat.). Over this same range of values, no such systematic trend is observed for the traditional elastocapillary length , based only on . This result strongly suggests the surface tension differential determines the size of the characteristic force in our experiment. Our observation sheds light on identifying the appropriate traction force boundary condition for partially-wetting substrates in relevant elastocapillary phenomena (Roman and Bico, 2010).
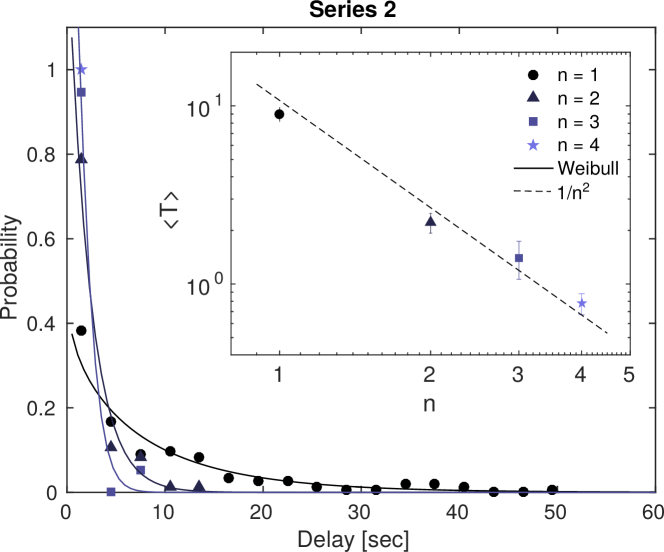
For starbursts with multiple arms, we observe that all of the fractures occur simultaneously, and that delay times are shorter than for the case analyzed above. This suggests that once one fracture is initiated by a thermal fluctuation, it triggers the simultaneous nucleation of the other fractures. Using the data from Series 2, for which up to fractures were observed, we have sufficient statistics to perform a semi-quantitative investigation. As shown in Fig. 5, we observe that delay times are reduced by a factor proportional to for starbursts with multiple arms. For , the dynamics are consistent with a Poisson process ( within error bars); for there is insufficient data.
Discussion:
A liquid droplet deforms an ultrasoft agar substrate to the point of material failure, resulting in the nucleation of fractures at the contact line. Once nucleated, these capillary fractures propagate radially outward in a starburst formation, with the mean number of fractures controlled by the ratio of the surface tension contrast to the elastic modulus of the gel substrate (Daniels et al., 2007). We quantify both variations in the delay time before fractures form, and variations in the number of fractures within the starburst.
For a given set of experimental parameters (fixed , droplet volume ), the number of fractures within each starburst has a well-defined mean, but is not deterministic. Instead, there is a range of values observed; it is likely that this variability arises from both the inherent heterogeneity of the gels (Goldbart and Goldenfeld, 1989) and the presence of multiple unstable deformation modes (Bostwick and Daniels, 2013). The observed increase in heterogeneity for small (small agar concentration ) is consistent with models of critical fluctuations on approach to the gel transition (Goldbart and Goldenfeld, 1989).
By isolating the case of single-arm starbursts (), we infer from the exponential (or Weibull) distribution of delay times that the fracture process is thermally-activated. This effect has previously been observed in systems which are 1000 times stiffer and subject to different loading conditions (Bonn et al., 1998), and this result highlights the universality of delayed fracture dynamics, even for ultrasoft materials.
For a purely thermally-activated process, the delay time distribution would be exponential, with set by the height of the energy barriers in the material. We note that the mean delay time is inversely proportional to the thermal nucleation probability , and is thereby a measure of the activation energy Bonn et al. (1998); Pomeau (1992). Because (or ) are not constant as function of agar concentration (or modulus ), our results suggest that the energy associated with the crosslinking of agar is not the only effect. Instead, we observe a trend in which the length scale controls the timescale . We interpret this finding as highlighting the importance of the differential in surface tension between the droplet and the gel substrate, rather than just the surface tension of the droplet itself (for which would have been the key parameter). Although traditionally appears in elastocapillary phenomena such as wrinkling, blistering, and stiction (Roman and Bico, 2010), future work is needed to understand whether or better-describes the degree of deformation, with other material parameters being held constant. Intriguingly, it appears that is additionally important in controlling the shape parameter of the Weibull distribution, not just the energy barriers, due to its effects on gel aging Scherer (1988); Hodge (1995). Future experiments could use this technique to map out, and disentangle, the effects of aging on the energy barrier landscape in soft materials.
Acknowledgements:
We would like to thank Michael Shearer and Carlos Ortiz for useful discussions, and Mark Schillaci for crucial upgrades to the experimental protocol. We are grateful for support from the National Science Foundation under grant number DMS-0968258.
References
- Levental et al. (2007) I. Levental, P. Georges, and P. Janmey, Soft Matter 3, 299 (2007).
- Beaune et al. (2014) G. Beaune, T. V. Stirbat, N. Khalifat, O. Cochet-Escartin, S. Garcia, V. V. Gurchenkov, M. P. Murrell, S. Dufour, D. Cuvelier, and F. Brochard-Wyart, Proceedings of the National Academy of Sciences 111, 8055 (2014).
- Khanvilkar et al. (2001) K. Khanvilkar, M. D. Donovan, and D. R. Flanagan, Advanced Drug Delivery Reviews 48, 173 (2001).
- Haitsma et al. (2001) J. J. Haitsma, U. Lachmann, and B. Lachmann, Advanced Drug Delivery Reviews 47, 197 (2001).
- Goldbart and Goldenfeld (1989) P. Goldbart and N. Goldenfeld, Physical Review A 39, 1402 (1989).
- Meyers et al. (2008) M. A. Meyers, P.-Y. Chen, A. Y.-M. Lin, and Y. Seki, Progress in Materials Science 53, 1 (2008).
- Bonn et al. (1998) D. Bonn, H. Kellay, M. Prochnow, K. Ben-Djemiaa, and J. Meunier, Science 280, 265 (1998).
- Jerison et al. (2011) E. R. Jerison, Y. Xu, L. A. Wilen, and E. R. Dufresne, Physical Review Letters 106, 186103 (2011).
- Das et al. (2011a) S. Das, A. Marchand, B. Andreotti, and J. H. Snoeijer, Physics of Fluids 23, 072006 (2011a).
- Bostwick and Daniels (2013) J. B. Bostwick and K. E. Daniels, Physical Review E 88, 042410 (2013).
- Bostwick et al. (2014) J. B. Bostwick, M. Shearer, and K. E. Daniels, Soft Matter 10, 7361 (2014).
- Daniels et al. (2007) K. E. Daniels, S. Mukhopadhyay, P. J. Houseworth, and R. P. Behringer, Physical Review Letters 99, 124501 (2007).
- Spandagos et al. (2012a) C. Spandagos, T. B. Goudoulas, P. F. Luckham, and O. K. Matar, Langmuir 28, 7197 (2012a).
- Spandagos et al. (2012b) C. Spandagos, T. B. Goudoulas, P. F. Luckham, and O. K. Matar, Langmuir 28, 8017 (2012b).
- Foyart et al. (2013) G. Foyart, L. Ramos, S. Mora, and C. Ligoure, Soft Matter 9, 7775 (2013).
- Pomeau (1992) Y. Pomeau, Comptes rendus de l’Académie des sciences. Série 2, Mécanique, Physique, Chimie, Sciences de l’univers, Sciences de la Terre 314, 553 (1992).
- Tanner (1979) L. Tanner, Journal of Physics D: Applied Physics 12, 1473 (1979).
- Szabo et al. (2000) D. Szabo, S. Akiyoshi, T. Matsunaga, J. P. Gong, Y. Osada, and M. Zrinyi, Journal Of Chemical Physics 113, 8253 (2000).
- Kaneko et al. (2005) D. Kaneko, J. P. Gong, M. Zrinyl, and Y. Osada, Journal Of Polymer Science Part B-polymer Physics 43, 562 (2005).
- Banaha et al. (2009) M. Banaha, A. Daerr, and L. Limat, The European Physical Journal Special Topics 166, 185 (2009).
- Kajiya et al. (2013) T. Kajiya, A. Daerr, T. Narita, L. Royon, F. Lequeux, and L. Limat, Soft Matter 9, 454 (2013).
- Hoult (1972) D. P. Hoult, Annual Review of Fluid Mechanics 4, 341 (1972).
- Pericet-Cámara et al. (2008) R. Pericet-Cámara, A. Best, H. J. Butt, and E. Bonaccurso, Langmuir 24, 10565 (2008).
- Kajiya et al. (2011) T. Kajiya, A. Daerr, T. Narita, L. Royon, F. Lequeux, and L. Limat, Soft Matter 7, 11425 (2011).
- Das et al. (2011b) S. Das, A. Marchand, B. Andreotti, and J. H. Snoeijer, Physics of Fluids 23, 072006 (2011b).
- Style and Dufresne (2012) R. W. Style and E. R. Dufresne, Soft Matter 8, 3177 (2012).
- Marchand et al. (2012) A. Marchand, S. Das, J. H. Snoeijer, and B. Andreotti, Physical Review Letters 108, 094301 (2012), eprint 1201.4268.
- Weijs et al. (2013) J. H. Weijs, B. Andreotti, and J. H. Snoeijer, Soft Matter (2013).
- Henann and Bertoldi (2014) D. L. Henann and K. Bertoldi, Soft Matter 10, 709 (2014).
- Park et al. (2014) S. J. Park, B. M. Weon, J. J. S. Lee, J. J. S. Lee, J. Kim, and J. H. Je, Nature Communications 5, 4369 (2014).
- (31) R. W. Style, A. Jagota, C.-Y. Hui, and E. R. Dufresne, http://arxiv.org/abs/1604.02052.
- Andreotti and Snoeijer (2016) B. Andreotti and J. H. Snoeijer, Europhysics Letters 113, 66001 (2016).
- Tokita and Hikichi (1987) M. Tokita and K. Hikichi, Physical Review A 35, 4329 (1987).
- Scherer (1988) G. W. Scherer, Journal of Non-Crystalline Solids 100, 77 (1988).
- Hodge (1995) I. M. Hodge, Science 267, 1945 (1995).
- Zhang et al. (2005) J. Zhang, C. Daubert, and E. Foegeding, Journal of Food Science 70, e425 (2005).
- (37) A. Bardall, K. E. Daniels, and M. Shearer, http://arxiv.org/abs/1607.01637.
- Roman and Bico (2010) B. Roman and J. Bico, Journal of Physics: Condensed Matter 22, 493101 (2010).
Supplementary Material
mN/m mN/m mN/m mN/m mN/m mN/m