The Shape of Dark Matter Haloes
IV. The Structure of Stellar Discs in Edge-on Galaxies
Abstract
We present optical and near-infrared archival observations of eight edge-on galaxies. These observations are used to model the stellar content of each galaxy using the FitSKIRT software package. Using FitSKIRT, we can self-consistently model a galaxy in each band simultaneously while treating for dust. This allows us to accurately measure both the scale length and scale height of the stellar disc, plus the shape parameters of the bulge. By combining this data with the previously reported integrated magnitudes of each galaxy, we can infer their true luminosities. We have successfully modelled seven out of the eight galaxies in our sample. We find that stellar discs can be modelled correctly, but have not been able to model the stellar bulge reliably. Our sample consists for the most part of slow rotating galaxies, and we find that the average dust layer is much thicker than what is reported for faster rotating galaxies.
keywords:
galaxies: haloes, galaxies: kinematics and dynamics, galaxies: photometry, galaxies: spiral, galaxies: structure1 Introduction
This is the fourth paper in a series of five where we try to constrain the flattening of dark matter haloes from observations of the thickness and velocity dispersion of the HI layer in edge-on late-type dwarf galaxies. For this analysis we need to correct for the influence of the stellar disks on the dynamics of the gas and therefore we provide in this paper fits to the light distribution in the stellar disks of our sample galaxies.
Edge-on galaxies offer a unique perspective on the distribution of stars and dust in galaxies. A major advantage of the edge-on view is the ability to resolve the vertical distribution of both the stars and the dust, and this is exactly the reason that in this series of papers we study edge-ons. A well-known feature of edge-on spiral galaxies are truncations at the outer edge of their stellar discs, as discovered in edge-on galaxies back in 1979 (van der Kruit, 1979). Subsequent authors have confirmed the presence of truncations, such as the study of 34 edge-on galaxies by Kregel et al. (2002a), who found that at least 20 of these galaxies ( of the sample) have truncations. Not all galaxies are truncated. Some even appear to have an upturn in their radial profiles (Erwin et al., 2008), although van der Kruit & Freeman (2011) noted that many of these, e.g. NGC 3310, show signs of merging or other distortions in the outer parts. Some galaxies extend out to many scalelengths, such as NGC3́00 (Bland-Hawthorn et al., 2005). In this series op papers we do not concern ourselves with the outer features, as we model the HI only in the inner parts in order to set limits of the three-dimensional shape of dark matter halos. In Paper V we determine out to which radius we feel our data justify fitting for the shape of the dark matter halos; the actual radii adopted for analysis vary from less than 1 out to typically 4 or 5 scalelengths, so we do not go out into these areas of extended stellar disks or upturns. Also, if any of our systems would have a truncation, our analysis is restricted to the areas within that truncation.
A major drawback to the edge-on perspective is the more complex geometry, which implies that each position along the major axis is a superposition of light emitted at a range of radii . Various authors have therefore set out to disentangle edge-on galaxies and extract their radial structure. One approach to this is to deproject the edge-on image using the inverse Abel transform (Binney & Tremaine, 1987). This method was first applied by Florido et al. (2001, 2006) in a study of the mid-plane of edge-on galaxies in the near infrared. Pohlen et al. (2007) extended the method to study both the radial and vertical distribution of eleven edge-on galaxies. UGC 7321 was studied in this way by O’Brien et al. (2010).
Dust can seriously hamper this type of deprojection, as there is no simple way to incorporate its complex interplay of scattering, absorption and emission, in the inverse Abel transform. An alternative strategy for deriving the radial properties of the galaxy is to model the entire galaxy including the dust. By using appropriate fitting algorithms, the model can be tweaked in various ways until it matches the observations. Various authors applied this method to edge-on galaxies, such as Xilouris et al. (1999) and Bianchi (2007).
FitSKIRT was developed by de Geyter et al. (2013) as an automatic fitting extension for the SKIRT 3D-continuum Monte-Carlo radiative transfer code (Baes & Dejonghe, 2001a, b; Baes et al., 2003, 2011). FitSKIRT makes use of the GAlib genetic algorithm to fit a parameterised model of a galaxy (Wall, 1996). In the so-called oligochromatic mode, the code can fit multiple bands simultaneously. This mode was used by de Looze et al. (2012) to model edge-on galaxy NGC 4565 from the UV to the mid-infrared in a self-consistent manner. This method has been applied by de Geyter et al. (2014) to a set of twelve edge-on galaxies selected from the CALIFA survey.
In the previous paper (number III in thsi series), we have modelled the HI structure and kinematics of eight edge-on dwarf galaxies, as part of our project to model their dark matter halo by inferring its properties from the baryonic content. In the current paper, we continue this project by modelling the stellar and dust components of these eight edge-on galaxies. We have collected a large set of observations, which we present in Section 2. The models and strategy by which we fit the data are presented in Section 3. The fits to the data using FitSKIRT are presented in Section 4, after which we discuss the results in Section 5 and conclude the paper in Section 6.
2 Data
FitSKIRT can model observations ranging from the UV to the infrared. The more bands are available to it, the better the models can be constrained. In this papers, we continue the analysis of the eight edge-on galaxies from the previous papers in this series. See Table 2 in Paper I for an overview of the sample. In order to get the largest dataset, a wide range of archives, both online and off-line, has been explored. For most galaxies, a large set of archived observations were found. Unfortunately, the signal-to-noise ratio in many of these (survey) observations was insufficient, as the low surface brightness nature of most of these galaxies necessitated longer exposure times than were used. In total, we use data from ten telescopes in nine bands, giving a minimum of three bands per galaxy, and a maximum of nine. A full overview of the observations that we used is shown in Table 2 in the online Appendix.
2.1 Data Reduction
FitSKIRT does not require the data to be calibrated, so we skipped that step in the reduction. As our observations come from a wide range of telescopes, each required its own, appropriate treatment.
- 2.3m ANU Advanced Technology Telescope
-
The 2.3m ANU Advanced Technology Telescope with the CASPIR near-IR camera, located at Siding Spring observatory in Australia, was used to observe several of the galaxies in the Kn- and H-bands. The data were archived on tape and was originally intended for use in O’Brien et al. (2010). The CASPIR instrument has dedicated software for reducing the data, which suffered from code-rot and did not work correctly any more. With support from Peter McGrergor at the Research School of Astronomy & Astrophysics in Canberra, Australia, along with the manual and source code for CASPIR, we managed to reconstruct the required workflow and re-implement this in Python.
During an observing run, various types of observations are being made: bias, dark, flat, sky and object. First, we create the combined bias and this from all other types of frames. CASPIR has a non-linear response and it was thus required to linearise the flat, dark sky and object frames. The dark currents were then removed from the sky, object and flat frames, after which the sky and object frames were flat-fielded. The sky in the near infrared is bright and varies rapidly. The main observations were therefore taken as one short object frame followed by a sky frame. The sky frames before and after each object frame were used to subtract the sky from a particular object frame. The field-of-view of CASPIR only covers a fraction of a galaxy, so a dithering pattern was used to cover the entire galaxy. The information on the exact dithering pattern was unavailable and we thus resorted to manually calibrating the coordinate system of each frame, using iraf. Each galaxy consisted of more than 50 object frames. Afterwards we use the Montage tool-kit111Available at montage.ipac.caltech.edu/. to automatically create a montage of all these frames. This process automatically performs background rectification between the various frames.
- 3.9m Anglo-Australian Telescope
-
The IRIS2 instrument on the 3.9m Anglo-Australian Telescope, located at Siding Spring observatory in Australia, was used for various Ks- and H-band observations. Observations were available on tape and were originally intended for use in O’Brien et al. (2010). In contrast to the 2.3m ANU Advanced Technology Telescope observations, the field-of-view is much larger and covers the entire galaxy and the surrounding patch of sky. The IRIS2 instrument has custom software, which automatically runs through the entire workflow and returns the reduced science-ready frame.
- ANU 40-inch Telescope
-
The Australian National University (ANU) 40-inch telescope, located at Siding Spring Observatory in Australia, was used to observe several of our galaxies, as intended for use in O’Brien et al. (2010). The data was archived on tapes. The traditional IRAF workflow of bias and flat-fielding removal was performed to reduce the data.
- CTIO 0.9-meter Telescope
-
The R-band image for ESO115-G021 was taken using the 0.9-meter Telescope located at the Cerro Tololo Inter-American Observatory (CTIO) in Chili. The observation was taken as part of the Spitzer Local Volume Legacy project and was provided science-ready online at the NASA/IPAC Extragalactic Database (NED)222Available at ned.ipac.caltech.edu/..
- Danish 1.54-meter Telescope
-
The Danish 1.54-m Telescope is located at the European Southern Observatory (ESO) La Silla site in Chili. The R-band image for ESO 274-G001 was previously published by Rossa & Dettmar (2003) and was available science-ready online via NED.
- ESO 1-meter Schmidt Telescope
-
The ESO-LV survey Lauberts & Valentijn (1988) digitised 606 blue and 606 red ESO photographic survey plates. The data was available science-ready through NED.
- ESO La Silla Schmidt telescope
-
The ESO red-band survey has been digitised using the MAMA microdensitometer and provided as science-ready data and available through a virtual-observatory (VO) interface. These images were originally part of the ESO(B) Atlas, taken with the ESO 1-m Schmidt telescope at La Silla, Chile (Lauberts, 1982).
- Palomar 48-inch Schmidt Telescope
-
The 48-inch Schmidt telescope at Palomar Observatory in the United States was used to create the Palomar Sky Survey (POSS). This survey was later digitised into the Digitized Sky Survey (DSS). The data was provided science-ready through a virtual-observatory interface.
- Spitzer Space Telescope IRAC
-
The Spitzer Space Telescope archive had m observations of all our galaxies and for several also m observations. The observations were taken for a range of projects (Dale et al., 2009; Sorce et al., 2012; Engelbracht et al., 2008; Sheth et al., 2010; Radburn-Smith et al., 2011; MacLachlan et al., 2011). The Spitzer Heritage Archive333Available at sha.ipac.caltech.edu/applications/Spitzer/SHA. provided direct online access to the science-ready frames.
- UK 48-inch Schmidt Telescope
-
The UK 48-inch Schmidt, located at Siding Spring in Australia, was used in an all-sky survey. This was digitised into the DSS and was available science-ready through a virtual-observatory interface.
2.2 Astrometric Calibration
The astrometric solution associated with the various observations would often be in disagreement between bands, causing galaxies to be offset slightly between bands. We therefore used the solve-field program, which is part of the astrometry.net project, to fit a new astrometric calibration to all the observations. The telescopes and cameras used in this study are of a large variety and consequnetly not a single limiting magnitudes in the bands can be given for our sample. In general, our photometry does not go as deep as the Comerón et al. (2011) study of edge-on galaxies, but our interest is in the brighter levels in order to constrain the light distribrutions for our modelling.
2.3 Masking
To avoid flux contamination, it was required to mask all fore- and background objects. For each galaxy, the band with the most prominent stars was selected. We used the ds9 display tool to draw regions on each object, after which a custom Python program set the pixels in these regions to a value of zero. Pixels with a value of zero are ignored by FitSKIRT, and we thus do not need to interpolate over them. We also used this program to draw a polygon around each galaxy, beyond which the image was masked. In most cases there was only little masking required. The galaxies closer to the galactic plane, however, required far more extensive masking, with the total amount of masks drawn for ESO 274-G001 well beyond a thousand. The region masks were copied to the other bands using ds9. The files were then inspected and additional masking applied where required.
2.4 Normalization
To avoid overly long computations, all images were rotated to align their major axis with the horizontal image axis, and then shrunk down to a width of pixels. We subtract the average background from the image. The image was then divided by the total flux, such that the sum of the image became one. This last step is required by FitSKIRT, as it prevents a particularly bright band from dominating the fitting result.


3 Data Fitting
The data will be modelled using FitSKIRT with the following components (de Geyter et al., 2013). The disc of each galaxy is modelled as a double-exponential disc. No truncation was included in the model, as this is currently not supported by FitSKIRT. Truncations are known to occur near the onset of the HI warp (van der Kruit, 2007) and this region is not of interested for our goal of measuring the mid-plane hydrostatics (see also Section 2 of Paper III). Developing a truncated model was discussed, but considering the quality of the data, the current research questions and the computational cost associated with additional free parameters, we have decided not to develop such an option. The disc thus follows the luminosity distribution
| (1) |
with the total disc luminosity, and the disc scale length and scale height, and and as the radial and vertical coordinates.
The assumption of a double-exponential model in our fits is a simplification of reality. It is well-known that better fits are possible; van der Kruit (1988) proposed a sech-function as a compromise between the isothermal sech2 distribution of van der Kruit & Searle (1981), which ignores the real situation that there are most likely age groups of stars with different velocity dispersions, and the mathematically convenient, but unphysical exponential. We believe our fits are sufficiently satisfactory that any further sophistication is not necessary, also in view of the fact that at low , where the exponential and the sech deviate most, dust extinction would need to be fitted more realistically then the crude way we apply here, namely also with a double exponential. Also the scaleheight of the stars may very well change with galactocentric distance, as found by de Grijs & Peletier (1997) and Narayan & Jog (2002). Again our fits work very well with a constant scaleheight, and we therefore believe these are adequate for our purposes. We return to this issue in section 5.2.
Our galaxies are close to edge-on and already van der Kruit & Searle (1981) showed that small variation in invclination away from perfectly edge-on do not affect the determined scale height. Nevertheless, we leave the inclination in as a parameter (see below).
A bulge was also included, which follows the luminosity density (de Geyter et al., 2013)
| (2) | |||||
| (3) |
with the total bulge luminosity , the effective radius , the Sérsic function
(with the proper normalization) and the flattening of the bulge . In general our photometry is not deep enough to look for thick disks and what we fit as bulges may very well be the brighter parts of suchgcomponents.
The dust is also modelled as a double-exponential disc
| (4) |
with the dust density , the total dust mass , and the dust scale length and scale height and . The galaxies in our sample are late-type dwarfs and we do not expect them to have a lot of dust. We include dust in the results for completeness, but stress that we are skeptical about the exact quantities returned by the fitting. The inclination can vary between and to get the best fit. However, with the absence of dust bands in most of our galaxies, we cannot confirm the exact inclination.
Including the inclination and the exact central position, the model has a total of 11 global free parameters, plus two additional free parameters per band (the disc luminosity and bulge-to-disc ratio ). FitSKIRT fits the data using the GaLib genetic algorithm (Wall, 1996). We use a population of 200 individuals and evolve the model for 100 iterations. We run five fits for each galaxy. The Millipede Cluster of the University of Groningen was used to perform all fits. A fit typically takes 30 hours.
Due to the random path that the light follows in the model, no two instances of the model will be the same. As such, both the observation and the model contain Poisson distributed noise. The objective function to measure the error is therefore
| (5) | |||||
| (6) |
The lowest value is adopted as the true value. The error in each parameter is taken as the standard deviation from the five runs.
4 Results
The results for each galaxy are shown in Table 1. The quality of the individual fits can be seen in Table 3 in the online Appendix. When available, we also list the published integrated magnitude . Where needed, these have been corrected for Galactic foreground extinction using the Schlafly & Finkbeiner (2011) re-calibration of the Schlegel et al. (1998) infrared-based dust map, as calculated in NED. Before the disc luminosity produced in FitSKIRT can be used for further analysis, it first needs to be calibrated. This can be done by multiplying it with , where is the integrated luminosity, expressed in W/m2, as measured without dust absorption.
4.1 IC 2531
Galaxy IC 2531 is the only Sb galaxy in our sample, and has the highest maximum circular velocity at km/s (Table 1). This is nearly twice the maximum circular velocity of the other galaxies in our sample. The central brightness component has not been reproduced correctly. This bulge is most likely peanut-shaped or boxy, which requires a different bulge model than adopted here (Jarvis, 1986; de Souza & Dos Anjos, 1987). The scale length is pc and the scale height pc. Kregel et al. (2002a) report a much longer pc and pc. The galaxy features a very prominent dust lane, which Kregels I-band model does not treat for and so their scale length might be overestimated. Xilouris et al. (1999) has also performed a fit to the galaxy that did include a treatment for the dust. They report a K-band scale length of kpc and a scale height of kpc. The dust is found to have a (K-band) scale length of kpc and a scale height of kpc, which is similar to the kpc and kpc reported here.
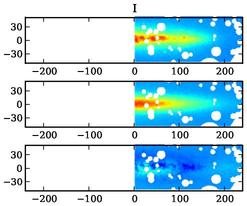
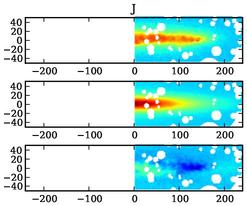
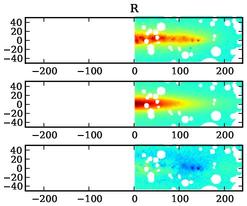
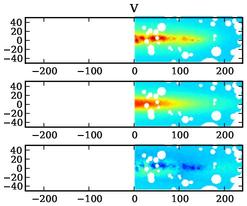
4.2 IC 5052
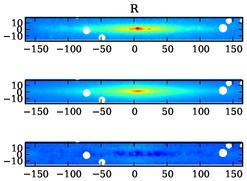
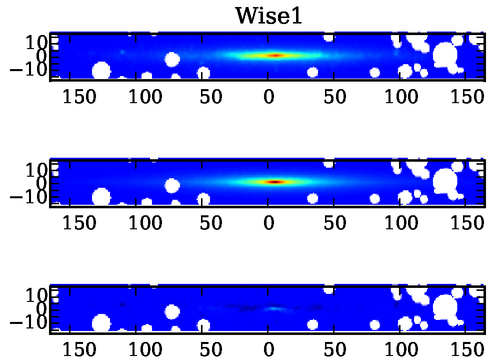
Galaxy IC 5052 has proven hard to model, as the galaxy showed clear asymmetries. We therefore opted to model both sides of the galaxy separately (Figures 2, 3, 4 and 5). This forced us to fix the centre of the galaxy, which has clearly hampered the results. From an inspection of the images, we conclude that the left side better represents the galaxy, although the fit is far from perfect. The scale length for the left side is pc and the scale height is pc, which makes this the galaxy with the shortest scale length in our sample. Comerón et al. (2011) has also modelled this galaxy using a double disc approach, and report a thick disc scale length of 470-530 pc and a thin disc scale length of 140-170 pc. They note that the galaxy can also be modelled successfully with a single disc. Overall, we find that the galaxy is very clumpy in its light distribution, which cannot be fit properly by the models. Our fitted scalelength differs considerably between the two sides, and both are much larger than the determined value of Comerón et al. (2011). Our result should be treated with much cuation. This galaxy proven to be too difficult to model for our purposes and it has been deleted from our sample in Paper V, where we do the final analysis.
4.3 IC 5249
The overall quality of the fit is very good. The scale length is pc, while the scale height is pc. Similar results have also been found in previous studies. Carignan (1983) analysed the galaxy in the B-band and distinguished two components wityh scale lengths 18 kpc and 2.5 kpc. Wainscoat (1986) confirmed these results using H, I and K-band data. The galaxy was also analysed by Byun (1992) in the B, R and I (van der Kruit et al., 2001). Abe et al. (1999) discovered a very sharp truncation at two scale lengths. We do not find any indication of a second disc component as Carignan (1983), although their second component might well have been the bulge we find here. This galaxy is an example of a so-called superthin galaxy. van der Kruit et al. (2001), who found a scale lenght of about 7 kpc attributed this to the relatively long scale length combined with the low (face-on) surface brightness.
4.4 ESO 115-G021
A large amount of masking was required for ESO 115-G021 (Figure 8). The dwarf galaxy has been modelled successfully, although it is still clumpy. The stellar disc scale length is only pc, while the scale height is only parsec. The galaxy is very faint and emits only L⊙ in the R-band. In comparison to the neutral hydrogen mass, the is 12.5, the highest in our sample.
4.5 ESO 138-G014
4.6 ESO 146-G014
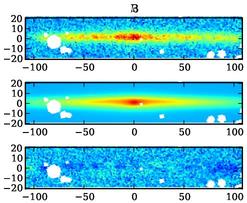
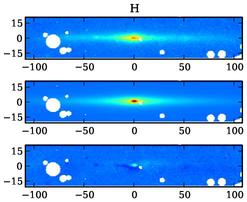
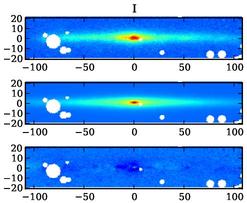
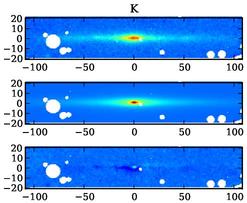
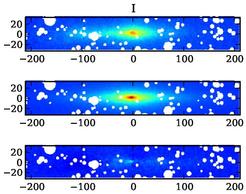
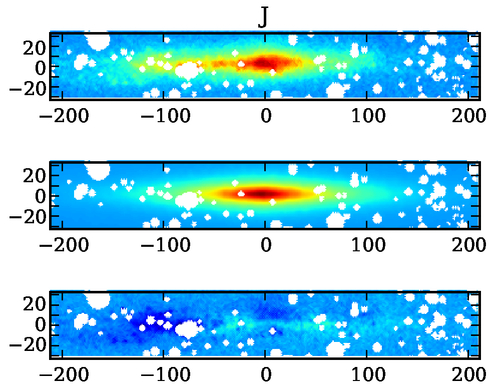
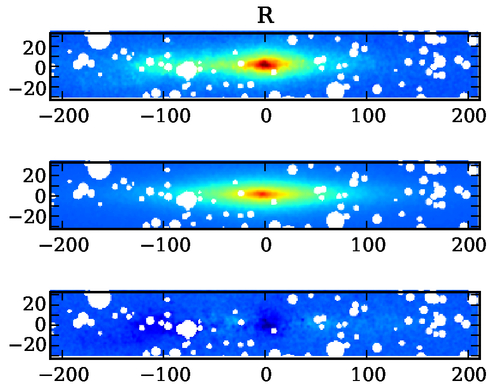
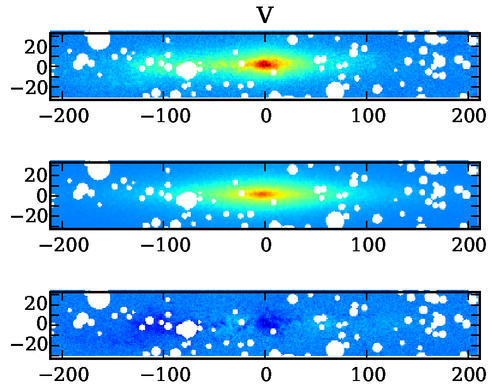
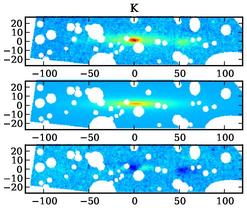
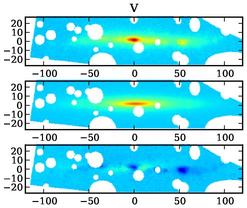
ESO 146-G014 is a known low-surface brightness galaxy and is extremely metal poor (Roennback & Bergvall, 1995; Morales-Luis et al., 2011). The galaxy is a slow rotator km/s and is very patchy in nature, as can be seen in Figure 10. Because of this, the fit is far from perfect. As can be seen in all three bands, the galaxy has a very bright central region, but also has a bright spot 50” east of the centre. The galaxy is also asymmetric, as can be seen most clearly in the V-band image.
4.7 ESO 274-G001
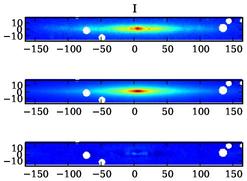
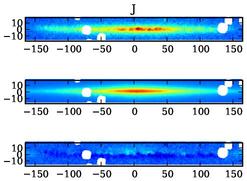
Galaxy ESO 274-G001 is very close to the Galactic plane, with a Galactic latitude of only . The four bands therefore required an exceptional amount of masking (Figure 11), but the fit was still successful. The galaxy has a stellar disc scale length of pc and a scale height of pc, which is very similar to ESO 115-G021. The overall appearance is different from that galaxy, as ESO 274-G001 has a far more flattened bulge. Similar to the ESO 115-G021 and ESO 146-G014, the galaxy is a slow rotator, with a maximum circular velocity of km/s. Moreover, similar to those two galaxies, ESO 274-G001 is patchy in nature. The galaxy has the highest luminosity compared to its optically thin HI mass:
4.8 UGC 7321
UGC 7321 has been modelled using five bands (Figure 12), the results of which have the lowest combined error in this sample. The scale length has been measured at pc and the scale height at pc. This is in agreement with O’Brien et al. (2010), who applied the deprojection method and reported pc and pc. The scale-height was reported as 140-150 pc by Matthews et al. (1999), who did not discern a bulge. We emphasize that our fitted bulge may also correspond to the brighter parts of a thick disk,
O’Brien et al. (2010) performed a rotation-curve decomposition on the galaxy and found a mass to light upper limit of 1.05. This implies a recent burst of star formation in the galaxy, which matches the detection of a significant fraction of young stars in the disc (Matthews et al., 1999). O’Brien et al. (2010) also performed a fit to the vertical hydrostatics of the disc and found a good fit at of 0.2.
5 Discussion
5.1 Quality of the Fits
What can we conclude about the overall quality of the fits? Comparing to the available literature, we see that IC 2531, IC 5249 and UGC 7321 are in agreement with the results by others. The slower rotating galaxies, e.g. ESO 115-G021, ESO 146-G014 and ESO 274-G001 all have a clumpy nature, which makes fitting harder. For IC 5052 and ESO 138-G014, the parameters reported by other authors are different. As we noted before, IC 5052 gave us problems to model, so our results could well be wrong. ESO 138-G014 also required extensive masking. It is a low surface brightness galaxy, but the fit we have performed still looks acceptable (see Figure 9). As such, we feel that the derived stellar disc scale lengths and scale heights are reasonably accurate, with the possible exception of IC 5052.
A similar endeavor as the work done in this paper has been previously undertaken by de Geyter et al. (2014), who set out to model edge-on galaxies in the Calar Alto Legacy Integral Field Area Survey (CALIFA), which showed a clear dust band. In total they settled on a sample of 12 –mostly early-type– galaxies for which they performed an oligochromatic fit to the , , and bands. While their data is of higher quality, their results are very similar to ours, and they “conclude that in general most galaxies are modelled accurately, especially when keeping in mind that the FitSKIRT models only consist of three basic components and they were determined by an automated procedure over a large parameters space without strong initial boundary conditions” (de Geyter et al., 2014).
| Stellar | Stellar | Dust | Dust | Dust | Bulge | Bulge | Sérsic | |||
|---|---|---|---|---|---|---|---|---|---|---|
| Name | scale length | scale height | scale length | scale height | mass | Radius | flattening | Inclination | Index | QOF |
| [pc] | [pc] | [pc] | [pc] | [ M⊙] | [pc] | ∘ | ||||
| IC 2531 | G | |||||||||
| IC 5052 (left) | M | |||||||||
| IC 5052 (right) | B | |||||||||
| IC 5249 | G | |||||||||
| ESO 115-G021 | G | |||||||||
| ESO 138-G014 | G | |||||||||
| ESO 146-G014 | G | |||||||||
| ESO 274-G001 | G | |||||||||
| UGC 7321 | G |
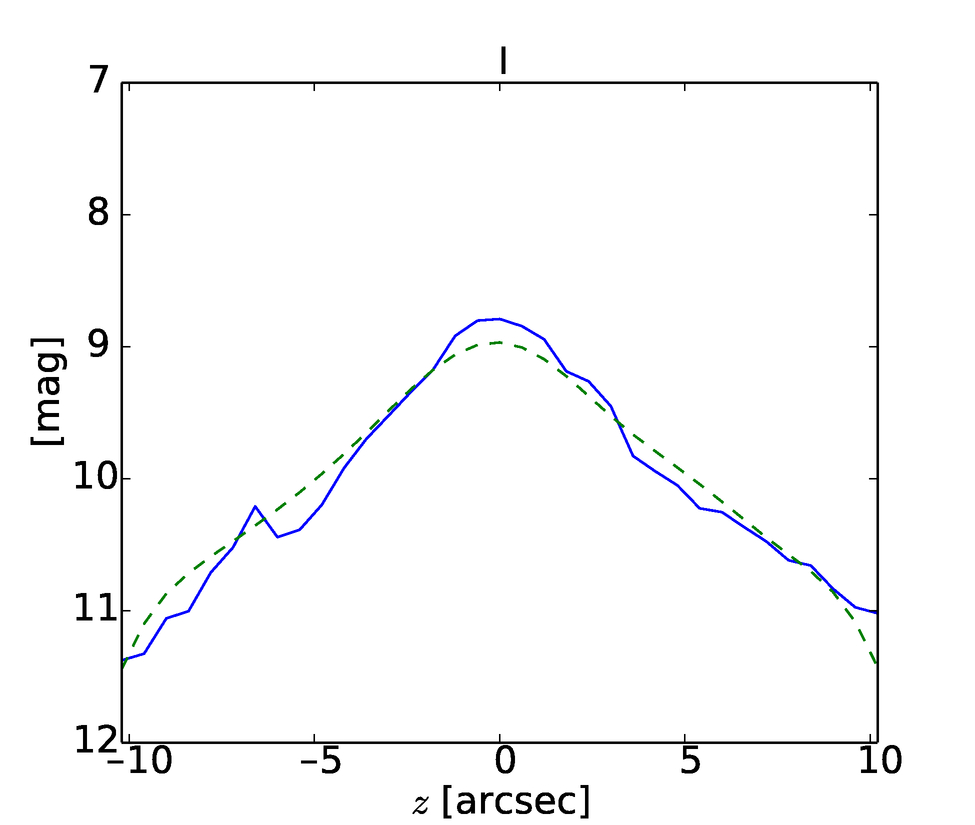
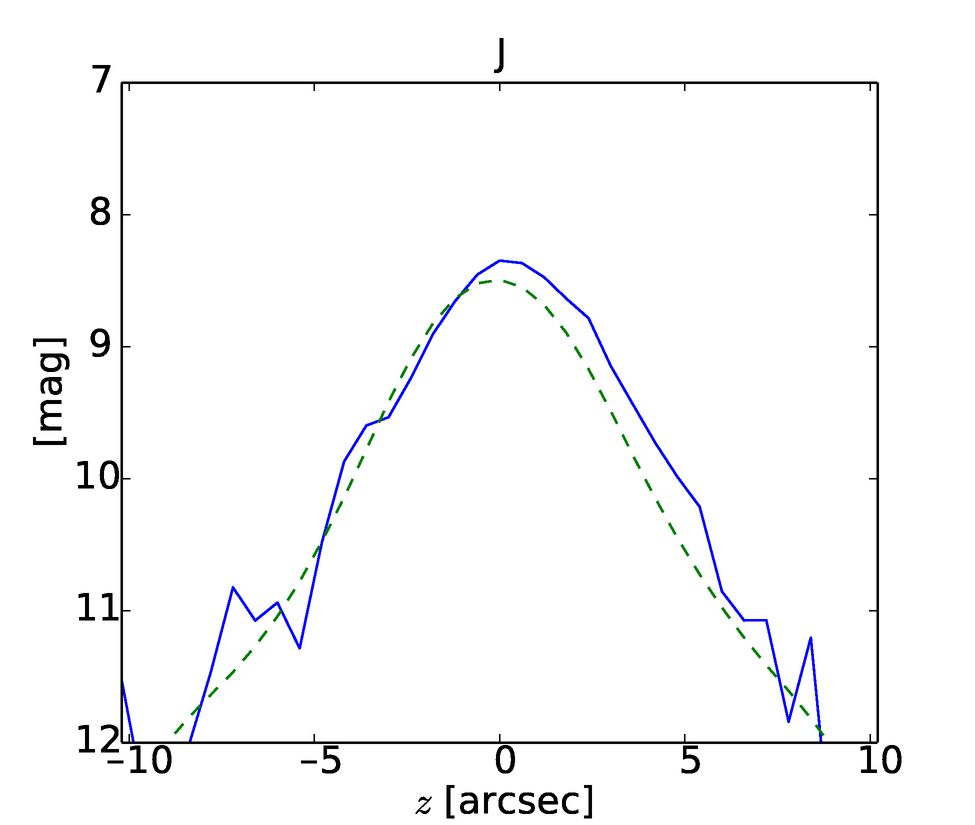
5.2 On the -distribution
A key assumption in our model is the use of a double-exponential disk (see Equation 1). This choice was made as a basis for the hydrostatic equilibrium calculations in Paper V. Other functional forms for the vertical distribution were available, but were rejected as the quality of the observations does not allow us to distinguish accurately enough between the various forms.
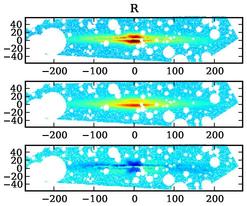
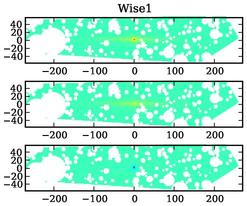
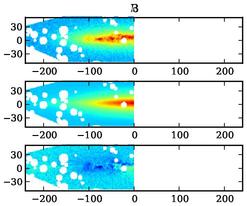
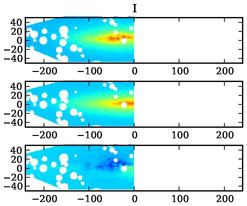
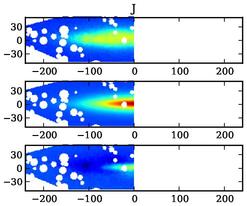
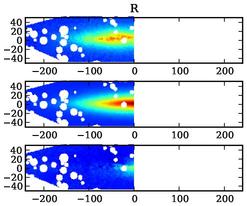
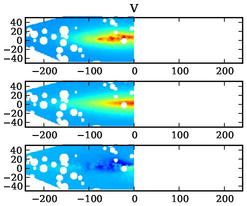
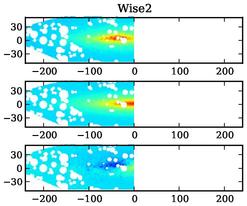
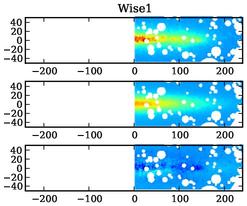
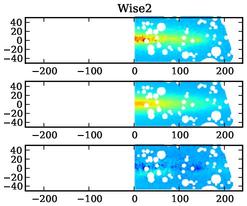
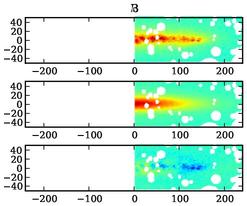
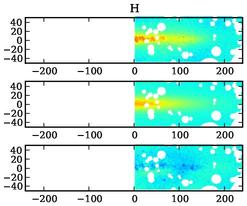
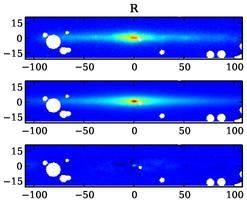
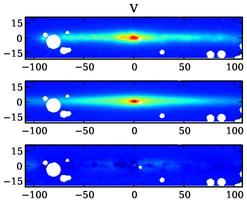
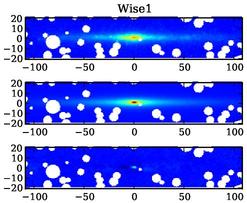
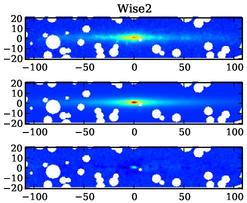
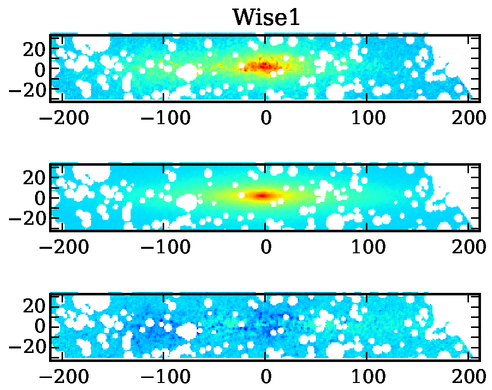
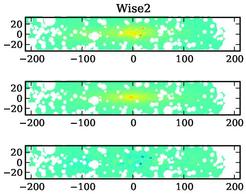
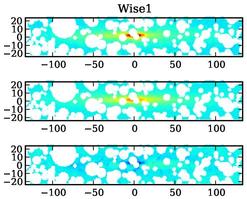
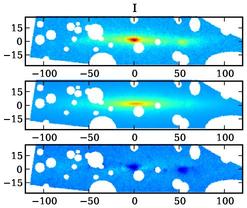
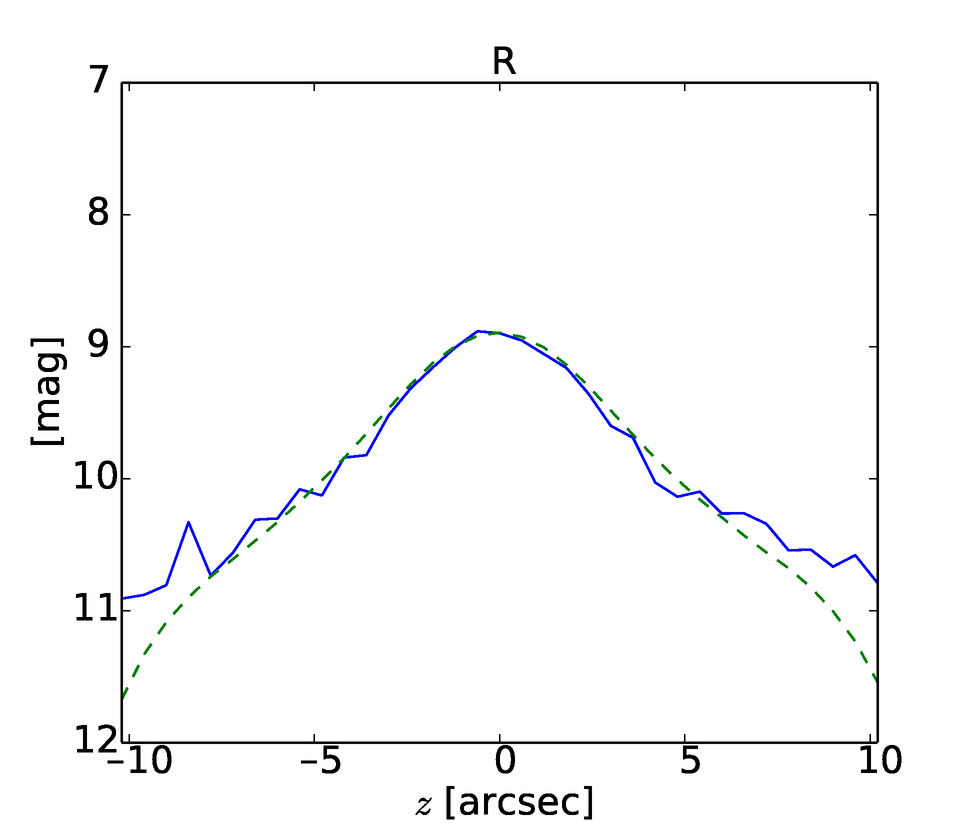
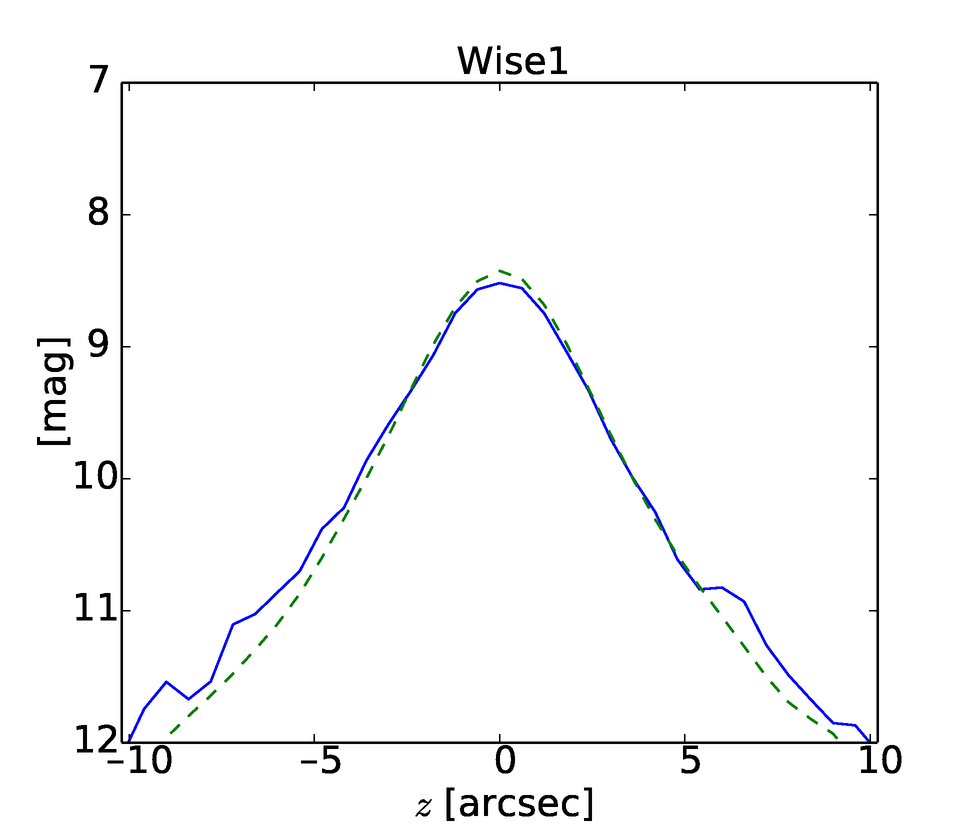
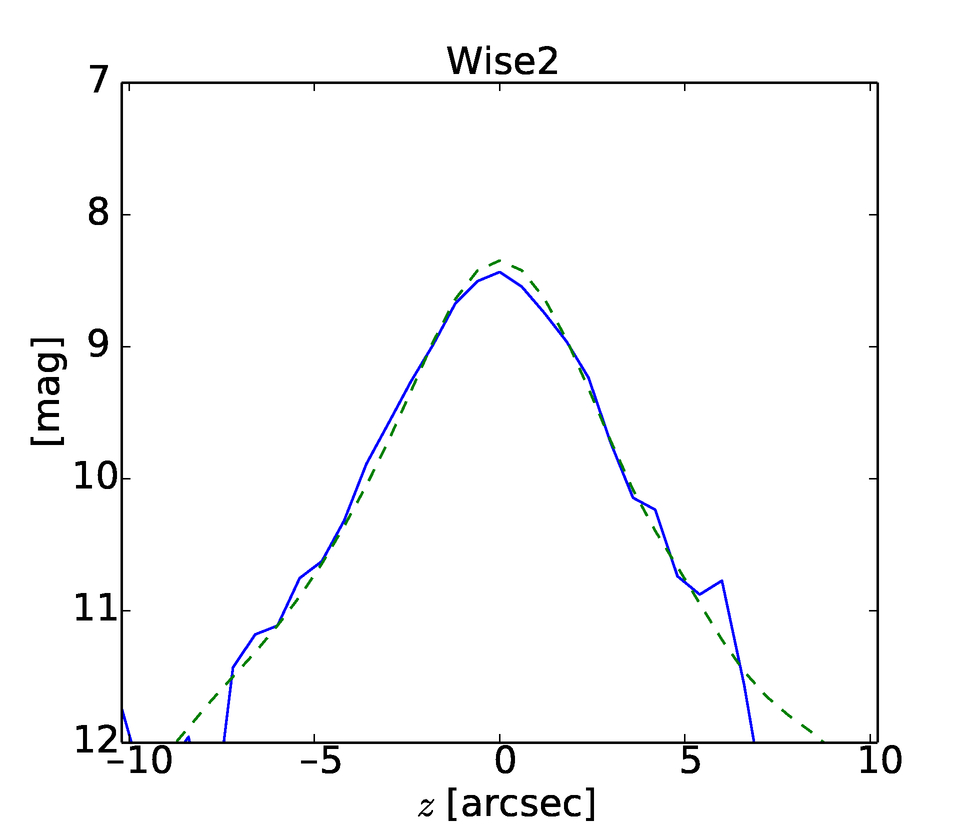
To demonstrate this, we have present the vertical distribution of UGC 7321 along a slice of the galaxy in Figure 13. UGC 7321 was one of our most succesful fits, and as such the profiles between the model and the observation match sufficiently well. But even in this slice, there is difference in the quality of the fit. The Wise2 fit has been very well reproduced. Yet the R-band profile has been reproduced considerably less well, showing excess light futher above and beyond the plane. The fits are influenced by the fact that the program tries to compensate for the local structures and contaminations (e.g. stray light due to field stars). More accurate and less contaminated observations are required to accurately test which functional form of the vertical distribution works best.
5.3 Discs and Bulges
Let us now compare the global properties of the stellar discs. Focusing on the seven good fits, the average stellar disc scale length in our sample is kpc, while the average scale height of the stellar disc is kpc. As a comparison de Geyter et al. (2014) report kpc and kpc for their 12 edge-on sample. They also calculate the mean values for the 34 edge-on galaxies in Kregel et al. (2002b), reporting kpc and scale height of kpc. That sample consists of Sa, Sb and Sc type galaxies, while ours consists of mostly of Sd type galaxies (Table 2 of Paper I of this series). IC 5249 appears to be a unique galaxy in terms of scale length to scale height ratio. If we remove it from the sample, the averages becomes even more distinct with kpc and kpc. It is typically not expected that the scale lengths for disc galaxies depend on Hubble morphological types between Sa and Sc (de Jong, 1996; Graham & de Blok, 2001). However, for Scd and Sd galaxies, it was demonstrated using face-on galaxies that the scale length tends to be significantly shorter (Fathi et al., 2010) and our results are within expectations, although the range we find is large, the mean is still less than the values we just quoted for Sa to Sc galaxies.
If we now focus on the scale length over scale height ratio, we find an average of . IC 5249 has the by far highest value at 28.2, which makes it a ‘super thin’ disc. Removing this one galaxy, the average ratio becomes . A very similar value of was reported by de Geyter et al. (2014) for their own sample, and a value of for the Kregel et al. (2002b) sample. We conclude that our measurements are, with the possible exception of IC 5249, in good agreement with their samples.
Looking at the bulges, we find a typical bulge effective radius of kpc. This is longer than reported by de Geyter et al. (2014), who reports the value of kpc. This was already large compared to the 1000 galaxies sample of Gadotti (2009), who reported kpc. It was argued by de Geyter et al. (2014) that this difference is due to the lack of dust attenuation correction in Gadotti (2009), and due to the lack of a treatment of bars in their own work. The Gadotti (2009) sample does not contain many Sd galaxies; there might be different averages that apply for an Sd sample. However, given our results from the previous section, we argue that it is more likely that our bulges are not fitted very reliably. The average Sérsic index we find is , which is consistent with the reported by de Geyter et al. (2014). As we poinbted out above, there is a real possibility that our bulge components really are the brighter parts of a thick disk.
5.4 Dust
Most of the galaxies in our sample are slow rotators. The Sd type galaxies have a maximum circular rotation of km/s. Only IC 2531 has a much higher rotation of km/s (Table 4 of Paper I). Dalcanton et al. (2004) found that for galaxies rotating slower than a circular velocity of km/s, no dust lane forms. Instead, the dust settles in more clumpy structure. Inspecting the images of the galaxies, we can confirm this distinction as well in our own sample, although it is hard to distinguish for the discs just above 120 km/s. The average dust scale length and scale height are kpc and kpc, while the ratio between the two is on average . A typical dust scale length and height of and was reported by de Geyter et al. (2014). For the scale height similar values of kpc and were reported by Xilouris et al. (1999) and Bianchi (2007). Our galaxies thus typically have a thicker dust layer than the samples of these authors.
Dalcanton et al. (2004) argued that for discs rotating slower than a circular velocity of km/s the dust would follow a thicker distribution than the faster rotating sample. Indeed, most of our galaxies are below or near a circular velocity of 120 km/s. Taking the three galaxies with circular velocities above 130 km/s, we have an average scale length to scale height ratio of , compared to for the other four. The sample of de Geyter et al. (2014) has a mean ratio of , which is much closer to our fast rotating galaxy at .
However, UGC 7321 with a maximum circular velocity of km/s has a very different ratio of . This galaxy also has the most dust mass of the sample, with M⊙, compared to the average of M⊙ for the entire sample. There is no distinction in terms of dust mass to be made between the slow and quick rotators.
The dust scale length to stellar scale length ratio is on average in our sample. This is compatible to the reported by de Geyter et al. (2014). Xilouris et al. (1999) reports and Bianchi (2007) finds , both values are compatible with ours. The dust scale height to stellar scale height ratio we report is . Although compatible, this is much higher than the value of reported by de Geyter et al. (2014), the reported by Xilouris et al. (1999) and the reported by Bianchi (2007). We thus find that the dust to stellar scale length ratio of our late-type galaxies sample is compatible to more early-type samples; the dust to stellar scale height ratio is far higher. The dust in our slow rotating galaxies sample forms into a much thicker disc, as predicted by Dalcanton et al. (2004).
6 Conclusions
In this paper, we have attempted to fit the bulge and disc of eight edge-on dwarf galaxies using FitSKIRT automatically. The quality of our fit varies, mostly due to limited quality of the available data and the intrinsic low luminosity of these galaxies. Despite this, we have successfully recovered the stellar discs in seven out of eight of the galaxies in our sample. The results for the bulges are less reliable, which is most likely due to a lack of an accurate description for bars in the code. We have also successfully measured the dust distribution in these seven galaxies. The average dust scale length to stellar scale length is compatible with other samples, but our dust scale height to stellar scale height ratio is far higher than in typical other samples. The HI mass to light ratio varies drastically between the various galaxies. It is only 0.2 in ESO 274-G001, yet 12.5 in ESO 115-G021.
Acknowledgments
SPCP is grateful to the Space Telescope Science Institute, Baltimore, USA, the Research School for Astronomy and Astrophysics, Australian National University, Canberra, Australia, and the Instituto de Astrofisica de Canarias, La Laguna, Tenerife, Spain, for hospitality and support during short and extended working visits in the course of his PhD thesis research. He thanks Roelof de Jong and Ron Allen for help and support during an earlier period as visiting student at Johns Hopkins University and the Physics and Astronomy Department, Krieger School of Arts and Sciences for this appointment.
PCK thanks the directors of these same institutions and his local hosts Ron Allen, Ken Freeman and Johan Knapen for hospitality and support during many work visits over the years, of which most were directly or indirectly related to the research presented in this series op papers.
Work visits by SPCP and PCK have been supported by an annual grant from the Faculty of Mathematics and Natural Sciences of the University of Groningen to PCK accompanying of his distinguished Jacobus C. Kapteyn professorhip and by the Leids Kerkhoven-Bosscha Fonds. PCK’s work visits were also supported by an annual grant from the Area of Exact Sciences of the Netherlands Organisation for Scientific Research (NWO) in compensation for his membership of its Board.
References
- Abe et al. (1999) Abe F., Bond I. A., Carter B. S., et al., 1999, AJ, 118, 261
- Baes et al. (2003) Baes M., Davies J. I., Dejonghe H., et al., 2003, MNRAS, 343, 1081
- Baes & Dejonghe (2001a) Baes M., Dejonghe H., 2001a, MNRAS, 326, 722
- Baes & Dejonghe (2001b) Baes M., Dejonghe H., 2001b, MNRAS, 326, 733
- Baes et al. (2011) Baes M., Verstappen J., De Looze I., et al. 2011, ApJS, 196, 22
- Bianchi (2007) Bianchi S., 2007, A&A, 471, 765
- Binney & Tremaine (1987) Binney J., Tremaine S., 1987, Galactic Dynamics. Princeton Univ. Press.
- Bland-Hawthorn et al. (2005) Bland-Hawthorn J., Vlajić M., Freeman K. C., Draine B. T., 2005, ApJ, 629, 239
- Byun (1992) Byun Y.-I., 1992, PhD thesis, Austral. Nat. Univ., Canberra.
- Carignan (1983) Carignan C., 1983, PhD thesis, Austral. Nat. Univ., Canberra.
- Comerón et al. (2011) Comerón S., Elmegreen B. G., Knapen J. H., et al., 2011, ApJ, 741, 28
- Dalcanton et al. (2004) Dalcanton J. J., Yoachim P., Bernstein R. A., 2004, ApJ, 608, 189
- Dale et al. (2009) Dale D. A., Cohen S. A., Johnson L. C., et al., 2009, ApJ, 703, 517
- de Geyter et al. (2014) de Geyter G., Baes M., Camps P., et al., 2014, MNRAS, 441, 869
- de Geyter et al. (2013) de Geyter G., Baes M., Fritz J., Camps P., 2013, A&A, 550, A74
- de Grijs & Peletier (1997) de Grijs R., Peletier R. F., 1997, A&A, 320, L21
- de Jong (1996) de Jong R. S., 1996, A&A, 313, 45
- de Looze et al. (2012) de Looze I., Baes M., Bendo G. J., et al., 2012, MNRAS, 427, 2797
- de Souza & Dos Anjos (1987) de Souza R. E., Dos Anjos S., 1987, A&AS, 70, 465
- de Vaucouleurs & Longo (1988) de Vaucouleurs A., Longo G., 1988, Catalogue of visual and infrared photometry of galaxies from 0.5 [microns] to 10 [microns] (1961-1985). Dept. of Astron., Univ. of Texas, Austin.
- de Vaucouleurs et al. (1991) de Vaucouleurs G., de Vaucouleurs A., Corwin Jr. H. G., et al. 1991, Third Reference Catalogue of Bright Galaxies. Volume I, II & III.. Springer, New York.
- Doyle et al. (2005) Doyle M. T., Drinkwater M. J., Rohde D. J., et al., 2005, MNRAS, 361, 34
- Engelbracht et al. (2008) Engelbracht C. W., Rieke G. H., Gordon K. D., et al., 2008, ApJ, 678, 804
- Erwin et al. (2008) Erwin P., Pohlen M., Beckman J. E., 2008, AJ, 135, 20
- Fathi et al. (2010) Fathi K., Allen M., Boch T., et al., 2010, MNRAS, 406, 1595
- Florido et al. (2006) Florido E., Battaner E., Guijarro A., Garzón F., Castillo-Morales A., 2006, A&A, 455, 467
- Florido et al. (2001) Florido E., Battaner E., Guijarro A., Garzón F., Jiménez-Vicente J., 2001, A&A, 378, 82
- Gadotti (2009) Gadotti D. A., 2009, MNRAS, 393, 1531
- Graham & de Blok (2001) Graham A. W., de Blok W. J. G., 2001, ApJ, 556, 177
- Jarrett et al. (2003) Jarrett T. H., Chester T., Cutri R., Schneider S. E., Huchra J. P., 2003, AJ, 125, 525
- Jarvis (1986) Jarvis B. J., 1986, AJ, 91, 65
- Kregel et al. (2002a) Kregel M., van der Kruit P. C., de Grijs R., 2002a, MNRAS, 334, 646
- Kregel et al. (2002b) Kregel M., van der Kruit P. C., de Grijs R., 2002b, MNRAS, 334, 646
- Lauberts (1982) Lauberts A., 1982, ESO/Uppsala survey of the ESO(B) atlas. Europ. South. Obs., Garching.
- Lauberts & Valentijn (1988) Lauberts A., Valentijn E. A., 1988 Vol. 28 of ESO Conf. Workshop Proc., . pp 37–42
- MacLachlan et al. (2011) MacLachlan J. M., Matthews L. D., Wood K., Gallagher J. S., 2011, ApJ, 741, 6
- Makarova (1999) Makarova L., 1999, A&AS, 139, 491
- Matthews et al. (1999) Matthews L. D., Gallagher III J. S., van Driel W., 1999, AJ, 118, 2751
- Morales-Luis et al. (2011) Morales-Luis A. B., Sánchez Almeida J., Aguerri J. A. L., Muñoz-Tuñón C., 2011, ApJ, 743, 77
- Narayan & Jog (2002) Narayan C. A., Jog C. J., 2002, A&A, 390, L35
- O’Brien et al. (2010) O’Brien J. C., Freeman K. C., van der Kruit P. C., 2010, A&A, 515, A63
- Pohlen et al. (2007) Pohlen M., Zaroubi S., Peletier R. F., Dettmar R.-J., 2007, MNRAS, 378, 594
- Radburn-Smith et al. (2011) Radburn-Smith D. J., de Jong R. S., Seth A. C., et al., 2011, ApJS, 195, 18
- Roennback & Bergvall (1995) Roennback J., Bergvall N., 1995, A&A, 302, 353
- Rossa & Dettmar (2003) Rossa J., Dettmar R.-J., 2003, A&A, 406, 505
- Schlafly & Finkbeiner (2011) Schlafly E. F., Finkbeiner D. P., 2011, ApJ, 737, 103
- Schlegel et al. (1998) Schlegel D. J., Finkbeiner D. P., Davis M., 1998, ApJ, 500, 525
- Sheth et al. (2010) Sheth K., Regan M., Hinz J. L., et al., 2010, PASP, 122, 1397
- Skrutskie et al. (2006) Skrutskie M. F., Cutri R. M., Stiening R., et al., 2006, AJ, 131, 1163
- Sorce et al. (2012) Sorce J. G., Tully R. B., Courtois H. M., 2012, ApJl, 758, L12
- Taylor et al. (2005) Taylor V. A., Jansen R. A., Windhorst R. A., et al., 2005, ApJ, 630, 784
- van der Kruit (1979) van der Kruit P. C., 1979, A&AS, 38, 15
- van der Kruit (1988) van der Kruit P. C., 1988, A&A, 192, 117
- van der Kruit (2007) van der Kruit P. C., 2007, A&A, 466, 883
- van der Kruit & Freeman (2011) van der Kruit P. C., Freeman K. C., 2011, ARA&A, 49, 301
- van der Kruit et al. (2001) van der Kruit P. C., Jiménez-Vicente J., Kregel M., Freeman K. C., 2001, A&A, 379, 374
- van der Kruit & Searle (1981) van der Kruit P. C., Searle L., 1981, A&A, 95, 105
- Wainscoat (1986) Wainscoat R. J., 1986, PhD thesis, Austr. Nat. Univ., Canberra.
- Wall (1996) Wall M., 1996, Mech. Engin. Dept., MIT, 87, 54
- Xilouris et al. (1999) Xilouris E. M., Byun Y. I., Kylafis N. D., et al., 1999, A&A, 344, 868
- Zackrisson et al. (2006) Zackrisson E., Bergvall N., Marquart T., Östlin G., 2006, A&A, 452, 857
Appendix A Tabular material
The following pages show the details of the observations in Table 2 and the quality of the fit for each filter band in Table 3.
| Galaxy | Filter | Telescope | Observer/Project | Date |
|---|---|---|---|---|
| IC 2531 | I | ANU 40inch Telescope | J.C. O’Brien | 02-03-2002 |
| R | ESO La Silla | ESO(B) Atlas | 04-02-1986 | |
| m | Spitzer IRAC | B. Tully | 06-03-2013 | |
| IC 5052 | B | ESO 1m Schmidt | ESO-LV project | |
| H | 3.9m Anglo-Australian Telescope | S. Ryder & C. Tinney | 27-07-2002 | |
| I | ANU 40inch Telescope | J.C. O’Brien | 10-07-2002 | |
| J | UK 48-inch Schmidt | Digitized Sky Survey | 14-09-1976 | |
| R | ESO 1m Schmidt | ESO-LV project | ||
| V | ANU 40inch Telescope | J.C. O’Brien | 12-07-2002 | |
| m | Spitzer IRAC | R. de Jong | 18-09-2005 | |
| m | Spitzer IRAC | R. de Jong | 18-09-2005 | |
| IC 5249 | B | ESO 1m Schmidt | ESO-LV project | |
| H | 3.9m Anglo-Australian Telescope | S. Ryder & C. Tinney | 28-07-2002 | |
| I | ANU 40inch Telescope | J.C. O’Brien | 15-07-2002 | |
| J | UK 48-inch Schmidt | Digitized Sky Survey | 30-07-1978 | |
| Ks | 3.9m Anglo-Australian Telescope | S. Ryder & C. Tinney | 28-07-2002 | |
| R | ANU 40inch Telescope | J.C. O’Brien | 11-07-2002 | |
| V | ANU 40inch Telescope | J.C. O’Brien | 12-07-2002 | |
| m | Spitzer IRAC | K. Sheth | 31-07-2010 | |
| m | Spitzer IRAC | K. Sheth | 31-07-2010 | |
| ESO 115-G021 | I | ANU 40inch Telescope | J.C. O’Brien | 10-07-2002 |
| J | UK 48-inch Schmidt | Digitized Sky Survey | 09-09-1975 | |
| R | CTIO 0.9 meter telescope | J. Funes | 14-09-2001 | |
| V | ANU 40inch Telescope | J.C. O’Brien | 12-07-2002 | |
| m | Spitzer IRAC | R. Kennicutt | 12-09-2007 | |
| m | Spitzer IRAC | R. Kennicutt | 12-09-2007 | |
| ESO 138-G014 | B | ESO 1m Schmidt | ESO-LV project | |
| H | 2.3m Advanced Technology Telescope | J.C. O’Brien | 16-07-2002 | |
| I | ANU 40inch Telescope | J.C. O’Brien | 10-07-2002 | |
| R | ESO 1m Schmidt | ESO-LV project | ||
| V | ANU 40inch Telescope | J.C. O’Brien | 12-07-2002 | |
| m | Spitzer IRAC | B. Tully | 09-05-2012 | |
| ESO 146-G014 | I | ANU 40inch Telescope | J.C. O’Brien | 10-07-2002 |
| Ks | 3.9m Anglo-Australian Telescope | S. Ryder & C. Tinney | 28-07-2002 | |
| m | Spitzer IRAC | G. Rieke | 31-10-2006 | |
| ESO 274-G001 | J | UK 48-inch Schmidt | Digitized Sky Survey | 14-03-1975 |
| R | Danish 1.54m | J. Rossa | 01-08-2000 | |
| V | ANU 40inch Telescope | J.C. O’Brien | 12-07-2002 | |
| m | Spitzer IRAC | B. Tully | 10-05-2012 | |
| UGC 7321 | I | ANU 40inch Telescope | J.C. O’Brien | 04-03-2002 |
| J | Palomar 48-inch Schmidt | Digitized Sky Survey | 23-03-1990 | |
| R | ANU 40inch Telescope | J.C. O’Brien | 11-07-2002 | |
| m | Spitzer IRAC | L. Matthews | 26-12-2005 | |
| m | Spitzer IRAC | L. Matthews | 26-12-2005 |
| Galaxy | Band | Magnitude | [] | [] | [] | Source | |||
| IC 2531 | R | 12.5 | 0.01 | 3.49E+09 | 3.49E+07 | 3.52E+09 | 2.1 | 0.47 | Doyle et al. (2005) |
| I | 11.9 | 0.07 | 2.97E+09 | 1.99E+08 | 3.17E+09 | 2.3 | 0.18 | Doyle et al. (2005) | |
| Wise1 | 0.07 | ||||||||
| IC 5052 (left) | B | 11.6 | 0.64 | 2.05E+09 | 1.31E+09 | 3.36E+09 | 0.3 | 0.26 | Doyle et al. (2005) |
| H | 9.1 | 2.00 | 9.41E+08 | 1.88E+09 | 2.82E+09 | 0.3 | 0.20 | Jarrett et al. (2003) | |
| I | 11.4 | 2.00 | 2.23E+08 | 4.46E+08 | 6.69E+08 | 1.3 | 0.14 | Doyle et al. (2005) | |
| J | 9.7 | 2.00 | 7.70E+08 | 1.54E+09 | 2.31E+09 | 0.4 | 0.13 | Jarrett et al. (2003) | |
| R | 11.7 | 2.00 | 2.79E+08 | 5.58E+08 | 8.37E+08 | 1.1 | 0.10 | Doyle et al. (2005) | |
| V | 11.0 | 0.69 | 1.76E+09 | 1.22E+09 | 2.98E+09 | 0.3 | 0.14 | de Vaucouleurs et al. (1991) | |
| Wise1 | 0.12 | ||||||||
| Wise2 | 0.16 | ||||||||
| IC 5052 (right) | B | 11.6 | 1.49 | 6.77E+08 | 1.01E+09 | 1.69E+09 | 0.5 | 0.14 | Doyle et al. (2005) |
| H | 9.1 | 2.00 | 8.62E+08 | 1.72E+09 | 2.59E+09 | 0.3 | 0.17 | Jarrett et al. (2003) | |
| I | 11.4 | 1.62 | 1.92E+08 | 3.10E+08 | 5.02E+08 | 1.8 | 0.07 | Doyle et al. (2005) | |
| J | 9.7 | 2.00 | 6.74E+08 | 1.35E+09 | 2.02E+09 | 0.4 | 0.07 | Jarrett et al. (2003) | |
| R | 11.7 | 0.93 | 3.46E+08 | 3.21E+08 | 6.67E+08 | 1.3 | 0.08 | Doyle et al. (2005) | |
| V | 11.0 | 2.00 | 5.96E+08 | 1.19E+09 | 1.79E+09 | 0.5 | 0.06 | de Vaucouleurs et al. (1991) | |
| Wise1 | 0.07 | ||||||||
| Wise2 | 0.06 | ||||||||
| IC 5249 | B | 13.9 | 0.26 | 2.33E+09 | 5.96E+08 | 2.93E+09 | 1.9 | 0.42 | Doyle et al. (2005) |
| H | 12.3 | 0.85 | 6.40E+08 | 5.42E+08 | 1.18E+09 | 4.7 | 0.18 | Skrutskie et al. (2006) | |
| I | 13.7 | 0.46 | 5.26E+08 | 2.42E+08 | 7.68E+08 | 7.3 | 0.30 | Doyle et al. (2005) | |
| J | 13.1 | 0.10 | 7.60E+08 | 7.60E+07 | 8.36E+08 | 6.7 | 0.11 | Skrutskie et al. (2006) | |
| K | 12.6 | 0.86 | 5.67E+08 | 4.85E+08 | 1.05E+09 | 5.3 | 0.41 | Skrutskie et al. (2006) | |
| R | 13.9 | 0.72 | 5.37E+08 | 3.86E+08 | 9.23E+08 | 6.1 | 0.11 | Doyle et al. (2005) | |
| V | 0.06 | ||||||||
| Wise1 | 0.15 | ||||||||
| Wise2 | 0.19 | ||||||||
| ESO 115-G021 | I | 13.1 | 2.00 | 1.21E+07 | 2.42E+07 | 3.63E+07 | 17.1 | 0.11 | Doyle et al. (2005) |
| J | 14.1 | 0.01 | 7.01E+06 | 7.01E+04 | 7.08E+06 | 87.6 | 0.13 | Jarrett et al. (2003) | |
| R | 13.1 | 0.54 | 3.21E+07 | 1.75E+07 | 4.96E+07 | 12.5 | 0.08 | Doyle et al. (2005) | |
| V | 12.6 | 0.58 | 8.89E+07 | 5.18E+07 | 1.41E+08 | 4.4 | 0.15 | de Vaucouleurs & Longo (1988) | |
| Wise1 | 10.5 | 1.08 | 1.03E+08 | 1.11E+08 | 2.14E+08 | 2.9 | 0.19 | Dale et al. (2009) | |
| Wise2 | 10.4 | 1.23 | 1.05E+08 | 1.30E+08 | 2.35E+08 | 2.6 | 0.35 | Dale et al. (2009) | |
| ESO 138-G014 | B | 12.8 | 0.10 | 4.17E+09 | 4.04E+08 | 4.57E+09 | 0.6 | 0.32 | Doyle et al. (2005) |
| H | 10.6 | 0.30 | 1.98E+09 | 5.88E+08 | 2.57E+09 | 1.1 | 0.43 | Jarrett et al. (2003) | |
| I | 12.4 | 2.00 | 3.81E+08 | 7.62E+08 | 1.14E+09 | 2.5 | 0.07 | Doyle et al. (2005) | |
| R | 12.7 | 0.01 | 1.40E+09 | 1.40E+07 | 1.41E+09 | 2.1 | 0.27 | Doyle et al. (2005) | |
| V | 0.08 | ||||||||
| Wise1 | 0.14 | ||||||||
| ESO 146-G014 | I | 13.9 | 0.39 | 1.78E+08 | 6.87E+07 | 2.47E+08 | 7.7 | 0.14 | Doyle et al. (2005) |
| K | 0.87 | 1.08 | |||||||
| V | 14.6 | 1.98 | 1.23E+08 | 2.43E+08 | 3.66E+08 | 5.2 | 0.17 | Zackrisson et al. (2006) | |
| ESO 274-G001 | V | 10.1 | 0.56 | 9.91E+08 | 5.55E+08 | 1.55E+09 | 0.2 | 0.04 | de Vaucouleurs et al. (1991) |
| J | 8.7 | 0.55 | 9.01E+08 | 4.96E+08 | 1.40E+09 | 0.2 | 0.08 | Jarrett et al. (2003) | |
| R | 10.9 | 0.73 | 2.42E+08 | 1.77E+08 | 4.19E+08 | 0.8 | 0.07 | Doyle et al. (2005) | |
| Wise1 | 0.13 | ||||||||
| UGC 7321 | R | 12.7 | 1.04 | 2.92E+08 | 3.05E+08 | 5.97E+08 | 1.6 | 0.05 | Taylor et al. (2005) |
| I | 12.4 | 1.08 | 2.00E+08 | 2.16E+08 | 4.16E+08 | 2.4 | 0.04 | Makarova (1999) | |
| J | 11.5 | 0.01 | 5.00E+08 | 5.00E+06 | 5.05E+08 | 1.9 | 0.09 | Jarrett et al. (2003) | |
| Wise1 | 10.3 | 2.00 | 2.51E+08 | 5.02E+08 | 7.53E+08 | 1.3 | 0.02 | Dale et al. (2009) | |
| Wise2 | 10.3 | 2.00 | 2.57E+08 | 5.14E+08 | 7.71E+08 | 1.3 | 0.05 | Dale et al. (2009) |