Strong exciton-photon coupling with colloidal nanoplatelets in an open microcavity
Abstract
Colloidal semiconductor nanoplatelets exhibit quantum size effects due to their thickness of only few monolayers, together with strong optical band-edge transitions facilitated by large lateral extensions. In this article we demonstrate room temperature strong coupling of the light and heavy hole exciton transitions of CdSe nanoplatelets with the photonic modes of an open planar microcavity. Vacuum Rabi splittings of and are observed for the heavy and light hole excitons respectively, together with a polariton-mediated hybridisation of both transitions. By measuring the concentration of platelets in the film we compute the transition dipole moment of a nanoplatelet exciton to be D. The large oscillator strength and fluorescence quantum yield of semiconductor nanoplatelets provide a perspective towards novel photonic devices, combining polaritonic and spinoptronic effects.
pacs:
Strong light-matter coupling results in the formation of new eigenstates, called polaritons, that consist of an admixture of the uncoupled states. Such coupling, well known from atomic physics, was first demonstrated for an excitonic solid state system at cryogenic temperatures in GaAlAs/AlAs quantum wells weisbuch_observation_1992. More recently room temperature polariton formation in organic molecules lidzey_strong_1998; agranovich_cavity_2003 and two-dimensional materials dufferwiel_exciton-polaritons_2015; liu_strong_2015 has been achieved. Strong coupling of colloidal nanocrystals in the form of quantum dots has been previously demonstrated in evanescently coupled bilayer microcavities giebink_strong_2011. The incorporation of polaritons in semiconducting devices allows intriguing technological advances such as threshold-less polariton lasing christopoulos_room-temperature_2007; kena-cohen_room-temperature_2010, the formation of polariton solitons sich_observation_2012 and a feasible route to interesting phenomena such as polariton condensation, superfluidity and vortex formation amo_superfluidity_2009; byrnes_exciton-polariton_2014.
Most of these systems require cryogenic temperatures and complex device fabrication. Recent advances in nanoparticle synthesis have reinforced the prospect for improving on these systems, allowing more facile polariton implementations even at room temperature. Prominent examples are colloidal nanoparticles, which are the subject of active research due to their relatively simple chemical preparation and precisely tunable spectral properties ekimov_quantum_1985; yin_colloidal_2005. Zero-dimensional quantum dots guyot-sionnest_colloidal_2008 and one-dimensional nanorodscarbone_synthesis_2007 are ubiquitous in the field of nanophotonics. Interestingly, progress in chemical synthesis have allowed the preparation of colloidal, atomically-thin, quasi-two-dimensional nanoplatelets (NPLs) ithurria_quasi_2008 with remarkable spectral properties such as narrow absorption and emission linewidths at room temperature () and quantum yields close to 50 ithurria_colloidal_2011; tessier_spectroscopy_2012. The large coherence area of the exciton causes an increased oscillator strength and fast exciton recombination rates down to picosecond values, exceeding that observed in traditional quantum dots by three orders of magnitude naeem_giant_2015. Indeed, it is this large oscillator strength and the large exciton binding energy of naeem_giant_2015 that makes semiconducting nanoplatelets good candidates for entering the strong exciton-photon coupling regime at room temperature.
Here we give the first experimental evidence for polariton formation at room temperature with quasi two-dimensional NPLs. We use a planar microcavity environment to create photonic modes of sufficient intensity to cause reversible coupling to the exciton dipole moments. Our experiment allows for in-situ tunability of the photon-exciton coupling by variation of the cavity length flatten_room-temperature_2016. We analyse the polariton dispersion and probe the state population after off-resonant, optically pumped excitation. These results establish polariton formation in colloidal NPLs, a technological feature that could ne used in broad fields such as laser and semiconductor physics.
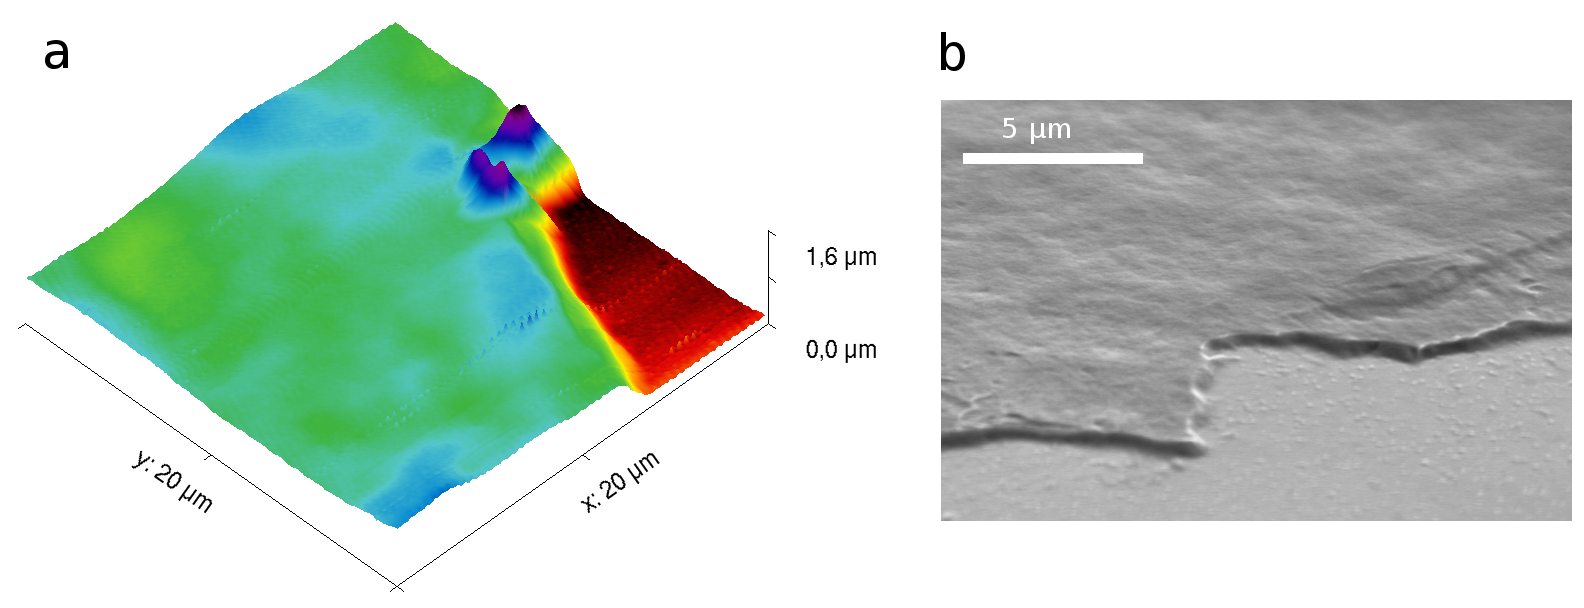
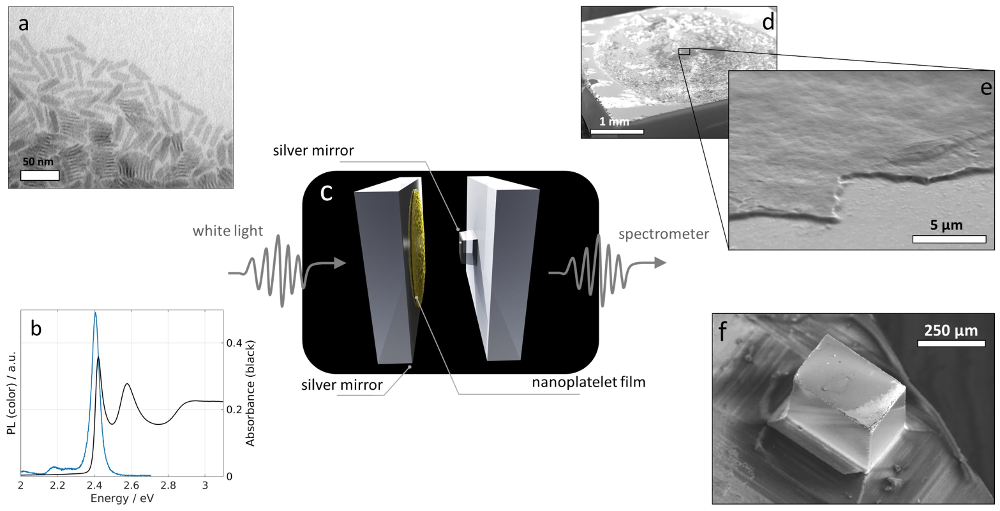
The microcavity consists of two semitransparent silver mirrors ( 90% reflectivity) thermally evaporated onto fused silica substrates. One of the cavity mirrors is on a raised plinth of dimensions by . A concentrated nanoplatelet dispersion is dropcast onto one of the mirrors, forming a dense nanoplatelet film approximately thick (see Fig. 1). The mirrors are brought to within of each other to form the optical cavity. The cavity length, and hence the cavity photon energy can be scanned in-situ with a piezoelectric actuator attached to one of the cavity mirrors (for details on the experimental setup, see additional information). It is thus possible to access the whole polariton dispersion with different degrees of hybridisation between heavy and light hole excitons.
Results
The optical absorption spectrum of the nanoplatelets displayed in Fig. 1b reveals two transitions, which correspond to the lower energy heavy hole (hh) exciton with and the higher-energy light hole (lh) exciton with . These states have binding energies of and respectively naeem_giant_2015.
To probe the mode structure of the strongly coupled nanoplatelet-cavity system the cavity length is varied which leads to a shift in the energy of the cavity mode by , where is the energy of the original cavity mode with longitudinal mode number and the variation in cavity length.
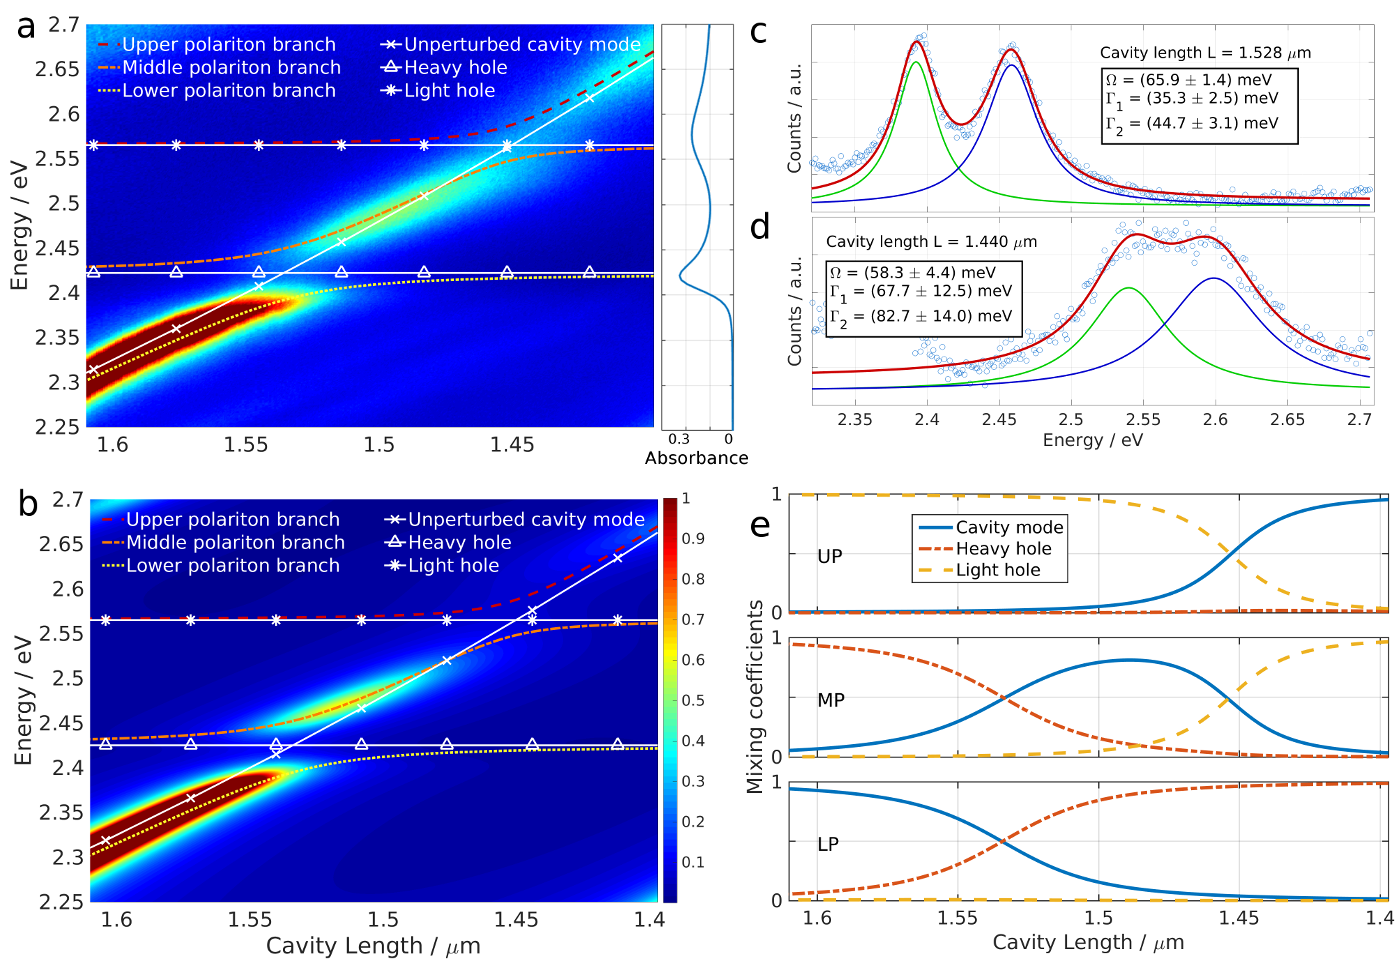
The cavity length dependent optical transmission of the nanoplatelet-cavity system is shown in figure 2a. For the maximum cavity length of a transmission peak corresponding to the lower polariton branch (LPB) is visible at , which moves to higher energy with reducing the cavity length (note the reversed -axis of 2a). As the LPB peak approaches the energy of the hh exciton at , a second transmission peak, corresponding to the middle polariton branch (MPB), of energy appears above . The LPB and MPB energies display an anticrossing about . As the cavity length is decreased further, a third higher energy transmission peak above appears (the upper polariton branch (UPB)) which undergoes an anticrossing with the MPB about .
This system of one cavity mode simultaneously coupled to two excitonic transitions is described by the Hamiltonian
| (1) |
where and are the interaction potentials between the cavity mode and heavy and light hole excitons. and are the photon, hh exciton and lh exciton annihilation operators respectively. In the stationary case the system can be reduced to:
| (2) |
Here the state is defined by the three coefficients , and , which quantify the contribution of photon, hh exciton and lh exciton respectively.
Using the known values of , and , and treating and as free variables, we fit equation 2 to the observed polariton dispersion. At the crossing between unperturbed cavity mode and exciton energy the polaritons are half-light, half-matter quasi-particles. The splitting at this point is the Rabi splitting which corresponds to twice the interaction potential . In our system the splitting is well resolved for the heavy hole exciton, where we obtain with linewidths of and for lower and middle polariton branch respectively. The light hole transition shows a similar avoided crossing with but the corresponding linewidths of and for middle and upper polariton branch respectively result in a splitting that is not fully resolved. The linewidths and splitting values are obtained by fitting two superposed Lorentzian lineshapes to the transmission spectra at the maximal photon-exciton mixing point (see Fig. 2c-d), which correspond to vertical cuts through the data presented in Fig. 2a at cavity lengths and .
Equation 2 allows us to determine the polariton mixing coefficients as a function of cavity length, as shown in Fig. 2e. For a longitudinal cavity mode with mode number (in Fig 2a-e we have ) the LPB is largely photon like for cavity lengths , becoming more hh exciton-like as the cavity mode energy crosses the exciton energy. The UPB similarly is lh exciton-like when the cavity length , becoming more photon-like for smaller cavity lengths. Meanwhile, the MPB has hh and lh exciton-like character when close in energy to the hh and lh exciton energies respectively. For cavity lengths it has mostly photonic character, however, it also is composed of approximately 10% of both exciton states, hence it is called a hybridised polariton state. We note that in a transmission experiment, light couples into and out of the cavity via the polariton photon component resulting in greater visibility of photon-like polariton states and observation of a mode structure as shown in Fig. 2a.
If the number of randomly aligned platelets coupled to the mode is known, it is possible to deduce the transition dipole moment of a single platelet from the equation fox_quantum_2006:
| (3) |
Here is the exciton energy, is the effective refractive index within the cavity and is the electric field mode volume. We can then infer the dipole moment of the excitonic transition of a single platelet from the respective Rabi splitting. We find (see. Suppl. Inf.):
| (4) |
This compares to transition dipole moments of D found in epitaxially grown GaAs quantum dots guest_measurement_2002 and D in InGaN quantum dots with a diameter of ostapenko_large_2010. The lateral dimensions of the platelets studied here are and as obtained by TEM microscopy. The transition dipole moment translates to a lifetime of the heavy hole exciton of . Similarly the oscillator strength of the transition can be found as (see Suppl. Materials Eq. (9) and (10)). These results confirm the giant oscillator strength associated with the large exciton coherence area found in CdSe nanoplatelets naeem_giant_2015; achtstein_$p$-state_2016.
Fig. 2b shows the modelled dispersion curves obtained by Transfer-Matrix-Modelling with the experimentally obtained absorption for the nanoplatelet film. The modelled thickness of the film is (see Suppl. Mat. for AFM data) with a peak absorbance of the heavy hole transition of , as inferred directly from optical absorption measurement. The absorption curve was converted to complex refractive index values with a classical Lorentz oscillator modelfox_optical_2010 for both transitions, neglecting the continuum of states above . The modelled transmission through the device is in excellent agreement with the experimental data presented in Fig. 2a.
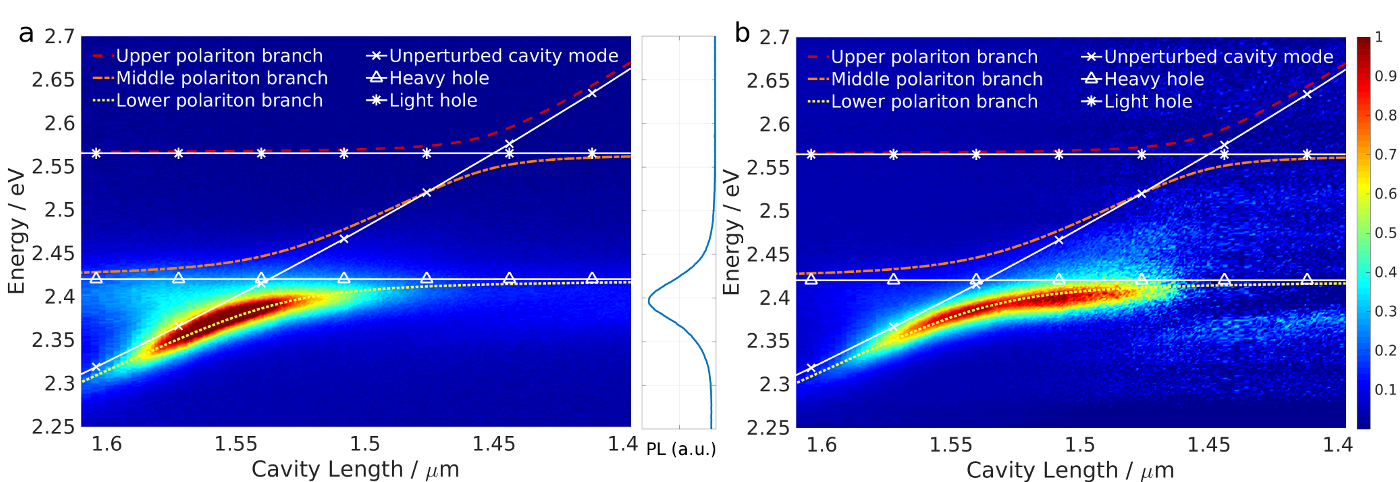
Fig. 3a shows the cavity length dependent photoluminescence collected at normal incidence, following non-resonant high energy excitation with a continuous wave laser with . We observe bright emission from the lower polariton branch at cavity lengths between and , corresponding to a LPB energy of to . Some weak residual PL is also visible at the energy of the nanoplatelet PL (shown to right of Fig. 3a). This signal results from the recombination of excitons that are not coupled to the cavity mode, some of which leaks directly though the mirrors. Emission from the MPB and UPB is not visible, as has previously been shown to be a result of fast relaxation pathways between polariton and lower lying exciton states virgili_polariton_relaxation. Scaling the photoluminescence intensity with the square of the inverse of the photonic coefficient of the polariton branch allows to see changes in the polariton population along the dispersion, as shown in Fig. 3b. We note that before scaling the PL intensity to obtain the polariton population, we subtract the uncoupled exciton emission (i.e. the PL spectrum at shortest cavity length). The maximum polariton population occurs at the same energy as the peak exciton emission, suggesting that polariton states are populated primarily through ‘optical pumping’ from uncoupled exciton decaylidzey_experimental_2002; litinskaya_fast_2004; litinskaya_excitonpolaritons_2006; michetti_exciton-phonon_2009; michetti_simulation_2008. Here, the radiative decay of excitons directly populates the photonic component of polariton states, however there must be an energetic overlap between the exciton emission and polariton. The small Stokes shift of naeem_giant_2015 therefore limits this population mechanism to polariton states close to the exciton energy.
Conclusion and Outlook
We have demonstrated the strong coupling between photonic cavity modes and excitons in quasi-two-dimensional colloidal nanoplatelets. The coherent exchange of energy between those two constituents results in the formation of hybridised exciton-polaritons at room temperature with a vacuum Rabi splittings of and associated with the heavy hole and light hole exciton transitions respectively. We find that the polariton states are emissive due to the high fluorescence quantum yield of the nanoplatelets, and that polariton states appear to mostly be populated through an optical pumping from uncoupled exciton states. Nanoplatelets represent a promising candidate for polariton based devices due to their large exciton binding energies allowing for room temperature operation. Compared to other colloidal nanoparticles, they are more efficient light absorbers and could become an integral part of future photonic devices.
Acknowledgements
We thank Radka Chakalova at the Begbroke Science Park for helping with the thermal evaporation and dicing of the mirrors. L.F. acknowledges funding from the Leverhulme Trust. D.M.C. acknowledges funding from the Oxford Martin School and EPSRC grant EP/K032518/1. The authors declare no competing financial interest.
References
Supplemental Materials: Strong exciton-photon coupling with colloidal nanoplatelets in an open microcavity
Appendix A Materials
Synthesis of CdSe nanoplatelets emitting around : In a three-neck round bottom flask 170 mg of Cadmium Myristate, 24 mg of Selenium powder (99,999%) and 15 ml Octadecene (ODE) were introduced and degassed under vacuum for 30 min at 120 ∘C. Then the temperature was raised gradually up to 240 ∘C under Argon flow. When the solution turns orange (around 210 ∘C) 90 mg of Cadmium Acetate were swiftly added to the reaction. After 10 min of the reaction time the heating mantle was removed and 2.5 ml of Oleic Acid were injected. When the solution had cooled down to 80 ∘C 15 ml of Hexane were added. The CdSe nanoplatelets were then separated by selective precipitation.
Figure 1a shows a TEM micrograph of dispersed platelets. While platelets towards the edges of the agglomeration tend to lay flat of the substrate, other platelets are stacked and lay sideways. The platelets have an average length of , a width of and a thickness of , obtained by taking the inter-plane distance along the 100 direction (13.6 ) and 4.5ML of CdSe. Fig. 1b shows the photoluminescence and absorbance lineshape of the platelets.
Appendix B Methods
The substrate for both sides of the cavity is fused silica. On one side the material is removed with a dicer to form a free standing plinth (Fig. 1f in main text). The plinth and the plain substrate are then coated with a semi-transparent silver layer via thermal evaporation. Now the nanoplatelets are dispersed on the main mirror by dropcasting. In the process of drying residual oleic acid acting as a passivating ligand helps in creating a homogeneous film (see Fig. 1d-e in main text). To form a tunable microcavity the two mirrors are mounted opposite each other, one on a Thorlabs kinematic mount, the other onto a ring piezo-actuator from Piezomechanik. The mirrors are then brought close to each other () and made parallel with the help of fabry-perot fringes visible in a transmission experiment with a light emitting diode (Thorlabs MWWHF1). The angular detuning after this procedure is less than . The piezo-actuator allows for a length tunability of and is driven by a Keithley 2400. Optical access to the sample is given by a standard ojective lens and the collected light is focused on an Andor combined spectrograph/CCD with a 300 grooves/mm grating. For the photoluminescence experiment the sample is excited with a continuous wave GaN diode laser with at power densities around .
Appendix C Elementary analysis in CdSe NPL
The concentration of the CdSe NPL has been determined with inductively coupled plasma optical emission spectrometry (ICP-OES). Two measurements of the same sample has been performed and the average has been used to determine the concentration of the CdSe NPL. The results can be summarized in the following table :
| Element | Avg | Stddev | RSD |
| Cd1 | 1.304 ppm | 0.003279 | 0.2514 |
| Se1 | 0.6582 ppm | 0.002482 | 0.3771 |
| Cd2 | 1.281 ppm | 0.002070 | 0.1616 |
| Se2 | 0.6536 ppm | 0.001062 | 0.1625 |
| Cd | 1.2925 ppm | 0.002674 | 0.2065 |
| Se | 0.6560 ppm | 0.001772 | 0.2698 |
The concentration of the CdSe NPL has been determined using the Selenium atoms because the solution has an excess of cadmium oleate.
Appendix D Measuring the dipole moment
In the following we show how to obtain the dipole moment of a single nanoplatelet. The Rabi splitting for an ensemble of randomly aligned dipoles with transition dipole moment is given as fox_quantum_2006:
| (S1) |
Here is the exciton energy, is the effective refractive index within the cavity and is the electric field mode volume. The factor is obtained by evaluating the integral:
| (S2) |
We have measured the thickness of the drop casted nanoplatelet film with an AFM to (see Fig. S1a). We deduce the effective refractive index in accordance with our TMM calculations by taking the weighted average of the refractive index of the film and air within the cavity (, mainly composed of oleic acid). To compute , we take the expression for the effective mode volume for a planar cavity from ujihara_spontaneous_1991 as
| (S3) |
with and the mirror reflectivity .
Now, the only missing parameter is the number of platelets coupled to the mode. To obtain it, we first measure the average size of nanoplatelets on the basis of a TEM micrograph , and . We then obtain the concentration of selenium atoms in solution by inductively coupled plasma optical emission spectroscopy (ICP-OES), from which we infer a concentration of M. To compare this volume concentration of platelets in solution to the volume concentration in a dried film , we measure the weight difference of a drop of before and after evaporation of the solvent hexane with the known density of . Note that the uncertainty in the volume pipetted () dominates the end result. With this we find the volume concentration of platelets in the dried film as:
| (S4) |
With the platelet dimensions () above this concentration translates into a volume fraction of platelets in the film of ( is the Avogadro number):
| (S5) |
For the number of platelets coupled to the cavity mode this equates to :
| (S6) |
Taking this value and using we solve Eq. S1 for and obtain:
| (S7) |
Note that the value for is independent of the exact choice for the mode volume (and thus the mirror reflectivity) since:
| (S8) |
Assuming a two level system with energy difference and transition dipole moment , the radiative lifetime of the heavy-hole exciton can be expressed as fox_quantum_2006:
| (S9) |
With as found above this expression results in . Similarly the oscillator strength of the transition can be expressed as:
| (S10) |
where is the reduced mass of the exciton. These results confirm the giant oscillator strength associated with the large exciton coherence area reported previously naeem_giant_2015.