Electron Spin Resonance at the Level of 104 Spins
Using Low Impedance Superconducting Resonators
Abstract
We report on electron spin resonance (ESR) measurements of phosphorus donors localized in a 200 m2 area below the inductive wire of a lumped element superconducting resonator. By combining quantum limited parametric amplification with a low impedance microwave resonator design we are able to detect around spins with a signal-to-noise ratio (SNR) of 1 in a single shot. The 150 Hz coupling strength between the resonator field and individual spins is significantly larger than the 1 – 10 Hz coupling rates obtained with typical coplanar waveguide resonator designs. Due to the larger coupling rate, we find that spin relaxation is dominated by radiative decay into the resonator and dependent upon the spin-resonator detuning, as predicted by Purcell.
Electron and nuclear spin magnetic resonance are widely used to characterize a diverse set of paramagnetic materials in biology, chemistry, and physics Chizhik et al. (2014). They also play an important role in the control and readout of spin qubits as highly coherent carriers of quantum information Tyryshkin et al. (2011); Maurer et al. (2012). Improving the sensitivity of spin resonance is an outstanding goal, which has triggered research on a variety of measurement schemes such as optical Wrachtrup et al. (1993); Sage et al. (2013), electrical Elzerman et al. (2004); Hoehne et al. (2010); Morello et al. (2010), and mechanical Barfuss et al. (2015) detection.
Important progress has also been made by inductively coupling spins to superconducting resonators through the magnetic dipole interaction Kubo et al. (2010) and by adopting ideas and techniques from circuit quantum electrodynamics Wallraff et al. (2004); Blais et al. (2004). Strong collective spin coupling with superconducting resonators and qubits has been demonstrated in various materials such as nitrogen vacancy and P1 centers in diamond Kubo et al. (2010); Schuster et al. (2010); Zhu et al. (2011), rare earth ions Probst et al. (2013), ferromagnets Tabuchi et al. (2015), and dopants in silicon Zollitsch et al. (2015). The number of spins involved in most of these experiments is typically to , far from the single spin limit. In an effort to reduce the number of spins and improve ESR sensitivity, remarkable achievements have recently been made by coupling bismuth donors in silicon to resonators with quality factors exceeding 105 Bienfait et al. (2016a, b).
In this Letter, we demonstrate a complementary approach to improve ESR sensitivity that is based on the enhancement of the single spin coupling strength to the resonator field by using lumped element resonators Probst et al. (2013); Bienfait et al. (2016a) with reduced characteristic impedance. Increasing the coupling strength is particularly helpful when only moderate quality factors are achievable. This is often the case in the presence of large magnetic fields that are required to achieve spin transitions in the microwave frequency range for the majority of spin species. The measurements presented here are performed in magnetic fields 180 mT with phosphorus donors in isotopically purified 28Si, which are representative of the class of spin systems with a -factor close to 2. By integrating a Josephson parametric amplifier (JPA) into the detection chain we demonstrate the detection of about electron spins with a SNR of 1, which exceeds previously reported sensitivities in phosphorus doped silicon by more than two orders of magnitude Sigillito et al. (2014). We also measure the dependence of the spin lifetime on the spin-resonator detuning and find it to be limited by Purcell decay Purcell (1946), in accordance with previous observations Bienfait et al. (2016b); Putz et al. (2014).
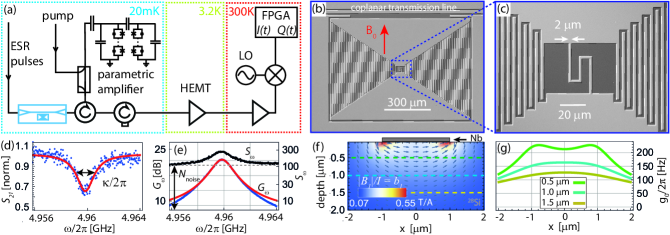
Our experiments take place using the cryogenic setup depicted in Fig. 1(a). Measurements are performed using planar superconducting microwave resonators with low characteristic impedance 8 [see Fig. 1(b)]. The triangular shaped regions form interdigitated finger capacitors that shunt an inductive wire of length m and width m, as shown in Fig. 1(c). The oscillating magnetic field associated with photons in the resonator is thus strongly confined in the region below the inductive wire. The resonator is fabricated from a niobium thin film sputtered on top of a 2m thick layer of epitaxially grown 28Si uniformly doped during growth with phosphorus donor atoms per cubic centimeter and with a residual 29Si content of 800 ppm. The coupling strength between the resonator and individual spins is proportional to the oscillating magnetic field per unit current , of which we show the simulated cross-sectional distribution in the spin doped area below the inductive wire [see Fig. 1(f)]. The non-uniform distribution of together with the resonator’s estimated characteristic impedance Eichler2016SM results in a position-dependent spin-resonator coupling strength [see Fig. 1(g)]. Here is the resonator frequency, is the electron -factor in silicon, and is the Bohr magneton.
The resonator is side-coupled to a coplanar transmission line that is used for spin control and readout. We apply pulsed and continuous microwave fields through a highly attenuated input line and use a linear detection chain to detect the two field quadratures and of the radiation emitted from the sample, see Fig. 1(a). A static in-plane magnetic field is applied by a superconducting magnet. With mT and low probe powers dBm we measure a resonance frequency close to GHz. The resonator linewidth MHz corresponds to a loaded quality factor of 3100, see Fig. 1(d). The reduction in the transmission at resonance allows us to distinguish between the internal loss rate MHz and the loss rate due to coupling to the transmission line MHz Gardiner and Collett (1985). The internal loss rate is most likely limited by magnetic field-induced losses due to a finite out-of-plane component and by dielectric losses in the substrate. Even at a constant internal loss rate the sensitivity could be enhanced further by designing the external loss rate to be equal and by using asymmetrically coupled drive and readout ports.
An essential aspect of our experiments is the incorporation of a JPA in the detection chain Bienfait et al. (2016a). By pushing the linear detection efficiency to its ultimate quantum limit, these amplifiers have recently triggered a paradigm shift in microwave frequency measurements at mK temperatures Yurke and Buks (2006); Castellanos-Beltran et al. (2008), with applications in superconducting Vijay et al. (2011); Ristè et al. (2012); Eichler et al. (2012b), semiconducting Stehlik et al. (2015), and electromechanical systems Teufel et al. (2011). The JPA used in this experiment is based on coupled nonlinear resonators and amplifies incoming signals independent of their phase Eichler et al. (2014). The JPA gain, shown as blue dots in Fig. 1(e), exhibits a Lorentzian shaped frequency dependence (red line) and is tuned such that the maximum power gain of dB coincides with the resonator frequency. To characterize the improvement in the detection efficiency enabled by the JPA we measure the noise power spectral density at the end of the detection chain [black dots in Fig. 1(e)]. On top of the frequency independent noise offset originating from the secondary amplifier stages, the parametric amplifier causes a noise rise proportional to its gain Eichler2016SM . This noise contribution has been demonstrated to arise from vacuum fluctuations at the input of the amplifier Eichler et al. (2014). By comparing the background noise offset with the parametrically amplified vacuum noise contribution, we approximate the detection efficiency of the amplification chain to be at . Based on room temperature measurements of cable attenuations, we estimate a transmission efficiency between the resonator output and parametric amplifier input. This leads to a combined detection efficiency of for the entire detection chain, which is about 60 times larger than the detection efficiency with the JPA turned off.
We probe the phosphorus donors by employing spin echo measurement techniques. The spins are initially spin polarized due to the large Zeeman field. An initial -pulse is then applied at frequency to rotate the spins to the equator of the Bloch sphere, where they precess at the Larmor frequency for a time . A -pulse is applied to reverse the phase accumulation from the preceding free evolution interval. The resulting build-up of a large total spin coherence , where denote spin lowering operators of individual spins, is known as the spin echo Hahn (1950). In the limit where the effective echo duration is large compared to the resonator decay time , the resonator field follows the total spin coherence quasi-instantaneously, so that the two are approximately proportional with being the average coupling strength between the participating spins and the resonator Bienfait et al. (2016a).
We measure the spin echo by detecting the quadratures and of the resonator output field as shown in Fig. 2(a). To maximize the SNR we apply a mode-matched filter function to the time-resolved data and extract the integrated echo signal for each measurement trace recorded in a single shot fashion with a repetition rate of Hz. Here, corresponds to an ensemble average over multiple single shot time-traces. The average data shown in the inset are in very good agreement with the time-dependent total spin coherence (gray line), which we have simulated by taking into account the inhomogeneous distribution of both the spin transition frequencies and the coupling strengths as illustrated in Fig. 1(f) and (g) Eichler2016SM . For the chosen pulse parameters and donor density the simulated spin echo signal at its maximum is about as shown in Fig. 2(a). This corresponds to an average of spins contributing to the echo. While inhomogeneities in the transition frequencies predominantly arise from the non-uniform field , the inhomogeneous coupling strength is caused by the position dependent field . The latter could be improved with further advances in the resonator design Mohebbi et al. (2014).
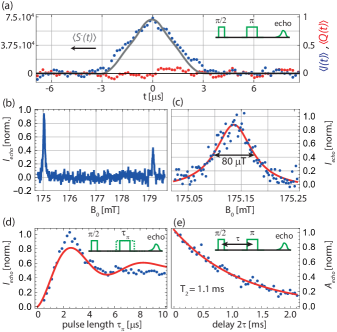
We first perform magnetic field spectroscopy by measuring the integrated echo signal as a function of . We observe two spin resonance transitions that are detuned by mT, which correspond to the two nuclear spin states of the phosphorus donor atom. The hyperfine coupling rate is in excellent agreement with the measured splitting. A higher resolution scan over the lower field transition [Fig. 2(c)] reveals a Lorentzian lineshape with an inhomogeneous linewidth of about 80 T, which is supposedly limited by inhomogeneity in the field and corresponds to a dephasing rate = 2.2 MHz. The Zeeman energy of the spin ensemble is tuned into resonance with by setting mT.
The optimal -pulse length is determined by measuring as function of . These data are shown in Fig. 2(d) for a pulse power dBm. The resulting Rabi oscillations plateau after about half a period due to the inhomogeneous distribution of coupling strengths in the device Sigillito et al. (2014). The maximum echo signal is obtained for = s, which we use for the following data sets. We measure the spin coherence time by varying the time delay between the -pulse and the refocusing -pulse. For this particular experiment we average the amplitude in order to compensate for decoherence caused by low frequency magnetic field noise. The resulting data points exhibit an exponential decay with a best fit of = 1.1 ms, which is most likely limited by dipolar interactions between neighboring spins leading to instantaneous diffusion Tyryshkin et al. (2011).
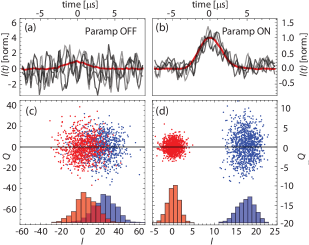
In order to study the ESR sensitivity and the improvements enabled by the use of a JPA, we repeatedly measure single shot time-traces of the echo response. From the characteristic time-traces, shown as black lines in Figs. 3(a) and (b), we immediately see the significant improvements in SNR with the JPA. With the JPA turned off the echo signal is only resolved after averaging (red line). The echo signal, however, clearly exceeds the noise level in single measurement shots when the JPA is turned on.
We further quantify the SNR by applying the optimal filter function to the time-resolved data resulting in one pair of quadratures for each time-trace. We plot 500 such pairs in the plane (red points) in comparison with measurements of the background noise (blue points), which is recorded after each spin echo [Figs. 3(c) and (d)]. The phase reference is chosen such that the echo signal is entirely in the quadrature. The and axes are scaled to correspond to the real and imaginary part of the detected mode referenced to the output of the cavity. From the standard deviation and the mean in the quadrature we extract a SNR of with the JPA turned off (on). The increase in the variations in the quadrature for the echo signal visible in Fig. 3(d) is explained by slow phase drifts during the time of data acquisition which is about 2 hours for the data points shown. In addition to the increased variance in the quadrature, we also find that the quadrature of the echo signal exhibits larger variations than the bare detection noise hinting at variations in the number of spins participating in the echo sequence from measurement to measurement.
Based on the SNR measurements and the simulated number of spins that are excited during the spin echo, we can estimate the ultimate spin sensitivity of the low impedance resonator. With the JPA on we find an ESR sensitivity of approximately . We can compare this value to the theoretically estimated value of Bienfait et al. (2016a), which for our sample parameters is and in reasonable agreement with the measured sensitivity.
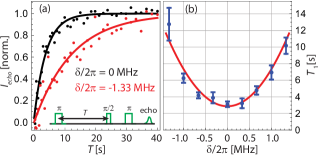
As demonstrated above, the increased ESR sensitivity that we achieve is predominantly due to the enhanced single spin coupling strength . As predicted by Purcell, the spin–resonator coupling induces an additional radiative decay channel for the excited spins with a Purcell enchanced decay rate , where is the spin-resonator detuning Butler and Weitekamp (2011). As has recently been demonstrated Bienfait et al. (2016b), this decay channel can significantly dominate over intrinsic decay mechanisms, which were shown many decades ago to yield lifetimes as long as hours Feher and Gere (1959). Acceleration of the spin relaxation rate may be useful for the initialization of spin states in quantum computing protocols.
To investigate the possibility of a Purcell enhancement we have measured the spin lifetime in a population recovery experiment for various detunings . The detuning is kept constant during each experiment by setting the magnetic field accordingly. The spin rotation pulses are applied resonantly with the spin transition and with powers adjusted to the detunings in order to account for pulse filtering by the resonator. As depicted in the inset of Fig. 4(a) an initial -pulse inverts the spin population. After a variable time the recovery of the spin population is probed with a standard Hahn echo sequence to determine what fraction of the spins have relaxed back to the ground state. As expected, the spin population is well fitted by an exponential function (solid lines) from which we extract the spin . At zero detuning the spin is about 3 seconds. However, the spin at MHz is measured to be about four times larger. We have repeated such population recovery measurements for various values of , see Fig. 4(b). A comparison with the expected Purcell lifetime (red solid line) shows good qualitative agreement with the data, which suggests that the is limited by Purcell decay into the resonator. Our measurements are in agreement with previous measurements of bismuth donors in silicon Bienfait et al. (2016b).
In conclusion, we have demonstrated significant improvements in the ESR detection sensitivity of phosphorus donors in silicon using lithographically defined resonators. This has been achieved by enhancing the single spin coupling strength with an optimized resonator design and by employing state-of-the-art parametric amplification. Further improvements in the sensitivity could be achieved by reducing the width of the inductive wire and by increasing the quality factor of the resonator. The increased coupling rate of the low impedance resonator design allows for significant tuning of the spin relaxation rate by taking advantage of the Purcell effect.
We acknowledge Thomas Schenkel for providing the isotopically enriched 28Si sample. Supported by the Gordon and Betty Moore Foundation’s EPiQS Initiative through Grant GBMF4535, with partial support from the National Science Foundation (DMR-1409556 and DMR-1420541). Devices were fabricated in the Princeton University Quantum Device Nanofabrication Laboratory.
References
- Chizhik et al. (2014) V. Chizhik, Y. Chernyshev, A. Donets, V. Frolov, A. Komolkin, and M. Shelyapina, Magnetic Resonance and its Applications (Springer International Publishing, 2014).
- Tyryshkin et al. (2011) A. M. Tyryshkin, S. Tojo, J. J. L. Morton, H. Riemann, N. V. Abrosimov, P. Becker, H.-J. Pohl, T. Schenkel, M. L. W. Thewalt, K. M. Itoh, and S. A. Lyon, Nat. Mat. 11, 143 (2011).
- Maurer et al. (2012) P. C. Maurer, G. Kucsko, C. Latta, L. Jiang, N. Y. Yao, S. D. Bennett, F. Pastawski, D. Hunger, N. Chisholm, M. Markham, D. J. Twitchen, J. I. Cirac, and M. D. Lukin, Science 336, 1283 (2012).
- Wrachtrup et al. (1993) J. Wrachtrup, C. von Borczyskowski, J. Bernard, M. Orritt, and R. Brown, Nature (London) 363, 244 (1993).
- Sage et al. (2013) D. L. Sage, K. Arai, D. R. Glenn, S. J. DeVience, L. M. Pham, L. Rahn-Lee, M. D. Lukin, A. Yacoby, A. Komeili, and R. L. Walsworth, Nature (London) 496, 486 (2013).
- Elzerman et al. (2004) J. M. Elzerman, R. Hanson, L. H. W. van Beveren, B. Witkamp, L. M. K. Vandersypen, and L. P. Kouwenhoven, Nature (London) 430, 431 (2004).
- Hoehne et al. (2010) F. Hoehne, H. Huebl, B. Galler, M. Stutzmann, and M. S. Brandt, Phys. Rev. Lett. 104, 046402 (2010).
- Morello et al. (2010) A. Morello, J. J. Pla, F. A. Zwanenburg, K. W. Chan, K. Y. Tan, H. Huebl, M. Mottonen, C. D. Nugroho, C. Yang, J. A. van Donkelaar, A. D. C. Alves, D. N. Jamieson, C. C. Escott, L. C. L. Hollenberg, R. G. Clark, and A. S. Dzurak, Nature (London) 467, 687 (2010).
- Barfuss et al. (2015) A. Barfuss, J. Teissier, E. Neu, A. Nunnenkamp, and P. Maletinsky, Nat. Phys. 11, 820 (2015).
- Kubo et al. (2010) Y. Kubo, F. R. Ong, P. Bertet, D. Vion, V. Jacques, D. Zheng, A. Dréau, J.-F. Roch, A. Auffeves, F. Jelezko, J. Wrachtrup, M. F. Barthe, P. Bergonzo, and D. Esteve, Phys. Rev. Lett. 105, 140502 (2010).
- Wallraff et al. (2004) A. Wallraff, D. I. Schuster, A. Blais, L. Frunzio, R.-S. Huang, J. Majer, S. Kumar, S. M. Girvin, and R. J. Schoelkopf, Nature (London) 431, 162 (2004).
- Blais et al. (2004) A. Blais, R.-S. Huang, A. Wallraff, S. M. Girvin, and R. J. Schoelkopf, Phys. Rev. A 69, 062320 (2004).
- Schuster et al. (2010) D. I. Schuster, A. P. Sears, E. Ginossar, L. DiCarlo, L. Frunzio, J. J. L. Morton, H. Wu, G. A. D. Briggs, B. B. Buckley, D. D. Awschalom, and R. J. Schoelkopf, Phys. Rev. Lett. 105, 140501 (2010).
- Zhu et al. (2011) X. Zhu, S. Saito, A. Kemp, K. Kakuyanagi, S.-i. Karimoto, H. Nakano, W. J. Munro, Y. Tokura, M. S. Everitt, K. Nemoto, M. Kasu, N. Mizuochi, and K. Semba, Nature 478, 221 (2011).
- Probst et al. (2013) S. Probst, H. Rotzinger, S. Wünsch, P. Jung, M. Jerger, M. Siegel, A. V. Ustinov, and P. A. Bushev, Phys. Rev. Lett. 110, 157001 (2013).
- Tabuchi et al. (2015) Y. Tabuchi, S. Ishino, A. Noguchi, T. Ishikawa, R. Yamazaki, K. Usami, and Y. Nakamura, Science 349, 405 (2015).
- Zollitsch et al. (2015) C. W. Zollitsch, K. Mueller, D. P. Franke, S. T. B. Goennenwein, M. S. Brandt, R. Gross, and H. Huebl, Appl. Phys. Lett. 107, 142105 (2015).
- Bienfait et al. (2016a) A. Bienfait, J. J. Pla, Y. Kubo, M. Stern, X. Zhou, C. C. Lo, C. D. Weis, T. Schenkel, M. L. W. Thewalt, D. Vion, D. Esteve, B. Julsgaard, K. Molmer, J. J. L. Morton, and P. Bertet, Nat. Nano. 11, 253 (2016a).
- Bienfait et al. (2016b) A. Bienfait, J. J. Pla, Y. Kubo, X. Zhou, M. Stern, C. C. Lo, C. D. Weis, T. Schenkel, D. Vion, D. Esteve, J. J. L. Morton, and P. Bertet, Nature (London) 531, 74 (2016b).
- Sigillito et al. (2014) A. J. Sigillito, H. Malissa, A. M. Tyryshkin, H. Riemann, N. V. Abrosimov, P. Becker, H.-J. Pohl, M. L. W. Thewalt, K. M. Itoh, J. J. L. Morton, A. A. Houck, D. I. Schuster, and S. A. Lyon, App. Phys. Lett. 104, 222407 (2014).
- Purcell (1946) E. M. Purcell, Phys. Rev. 69, 681 (1946).
- Putz et al. (2014) S. Putz, D. O. Krimer, R. Amsuss, A. Valookaran, T. Nobauer, J. Schmiedmayer, S. Rotter, and J. Majer, Nat. Phys. 10, 720 (2014).
- (23) See Supplemental Material [url], which includes Refs. [24-27].
- Stojanović et al. (2006) G. Stojanović, L. Živanov, and M. Damnjanović, COMPEL 25, 916 (2006).
- Clerk et al. (2010) A. A. Clerk, M. H. Devoret, S. M. Girvin, F. Marquardt, and R. J. Schoelkopf, Rev. Mod. Phys. 82, 1155 (2010).
- da Silva et al. (2010) M. P. da Silva, D. Bozyigit, A. Wallraff, and A. Blais, Phys. Rev. A 82, 043804 (2010).
- Eichler et al. (2012a) C. Eichler, D. Bozyigit, and A. Wallraff, Phys. Rev. A 86, 032106 (2012a).
- Gardiner and Collett (1985) C. W. Gardiner and M. J. Collett, Phys. Rev. A 31, 3761 (1985).
- Yurke and Buks (2006) B. Yurke and E. Buks, J. Lightwave Technol. 24, 5054 (2006).
- Castellanos-Beltran et al. (2008) M. A. Castellanos-Beltran, K. D. Irwin, G. C. Hilton, L. R. Vale, and K. W. Lehnert, Nat. Phys. 4, 929 (2008).
- Vijay et al. (2011) R. Vijay, D. H. Slichter, and I. Siddiqi, Phys. Rev. Lett. 106, 110502 (2011).
- Ristè et al. (2012) D. Ristè, J. G. van Leeuwen, H.-S. Ku, K. W. Lehnert, and L. DiCarlo, Phys. Rev. Lett. 109, 050507 (2012).
- Eichler et al. (2012b) C. Eichler, C. Lang, J. M. Fink, J. Govenius, S. Filipp, and A. Wallraff, Phys. Rev. Lett. 109, 240501 (2012b).
- Stehlik et al. (2015) J. Stehlik, Y.-Y. Liu, C. M. Quintana, C. Eichler, T. R. Hartke, and J. R. Petta, Phys. Rev. Applied 4, 014018 (2015).
- Teufel et al. (2011) J. D. Teufel, D. Li, M. S. Allman, K. Cicak, A. J. Sirois, J. D. Whittaker, and R. W. Simmonds, Nature (London) 471, 204 (2011).
- Eichler et al. (2014) C. Eichler, Y. Salathe, J. Mlynek, S. Schmidt, and A. Wallraff, Phys. Rev. Lett. 113, 110502 (2014).
- Hahn (1950) E. L. Hahn, Phys. Rev. 80, 580 (1950).
- Mohebbi et al. (2014) H. R. Mohebbi, O. W. B. Benningshof, I. A. J. Taminiau, G. X. Miao, and D. G. Cory, J. Appl. Phys. 115, 094502 (2014).
- Butler and Weitekamp (2011) M. C. Butler and D. P. Weitekamp, Phys. Rev. A 84, 063407 (2011).
- Feher and Gere (1959) G. Feher and E. A. Gere, Phys. Rev. 114, 1245 (1959).