The evolution of far-infrared CO emission from protostars
Abstract
We investigate the evolution of far-IR CO emission from protostars observed with Herschel/PACS for 50 sources from the combined sample of HOPS and DIGIT Herschel key programs. From the uniformly sampled spectral energy distributions, whose peaks are well sampled, we computed the , and for these sources to search for correlations between far-IR CO emission and protostellar properties. We find a strong and tight correlation between far-IR CO luminosity () and the bolometric luminosity () of the protostars with 0.7. We, however, do not find a strong correlation between and protostellar evolutionary indicators, and . FIR CO emission from protostars traces the currently shocked gas by jets/outflows, and far-IR CO luminosity, , is proportional to the instantaneous mass loss rate, . The correlation between and , then, is indicative of instantaneous tracking instantaneous . The lack of correlation between and evolutionary indicators and suggests that and, therefore, do not show any clear evolutionary trend. These results are consistent with mass accretion/ejection in protostars being episodic. Taken together with the previous finding that the time-averaged mass ejection/accretion rate declines during the protostellar phase (e.g. Bontemps et al., 1996; Curtis et al., 2010), our results suggest that the instantaneous accretion/ejection rate of protostars is highly time variable and episodic, but the amplitude and/or frequency of this variability decreases with time such that the time averaged accretion/ejection rate declines with system age.
Subject headings:
stars:protostars – stars:jets – stars: winds, outflows – ISM: jets and outflows1. Introduction
Mass accretion in young stellar objects is thought to be highly time variable and episodic (e.g. Kenyon et al., 1990; Hartmann & Kenyon, 1996; Hartmann, 2009; Evans et al., 2009; Dunham & Vorobyov, 2012). Outbursts of varying intensities and frequencies have been observed in several young stars (e.g Herbig, 1977; Kenyon, 1995; Green et al., 2006; Reipurth & Aspin, 2010; Fischer et al., 2012; Green et al., 2013a; Audard et al., 2014; Safron et al., 2015). However, a detailed picture of the time evolution of mass accretion from early protostellar phase to late pre-main sequence phase is still missing. Most of the commonly used direct observational tracers of mass accretion fall at wavelengths 2 µm (e.g. Calvet & Gullbring, 1998; Muzerolle et al., 1998a, b, 2001). While these tracers are used extensively to study the accretion history in pre-main sequence stars (e.g. Gullbring et al., 1998; Hartmann, 1998; Calvet et al., 2004; Herczeg & Hillenbrand, 2008; Muzerolle et al., 2004), they are difficult to observe in protostars which are deeply embedded in their natal core as their shorter wavelength emission is heavily extinguished.
Mass accretion in protostars is thought to be associated with mass ejection. Jets and outflows from embedded protostars are more readily accessible to observations than the direct accretion tracers, particularly at far-IR and (sub)mm wavelengths. Observations of protostellar jets and outflows at these wavelengths provide important diagnostics for the energetics of mass ejection and mass loss rates from protostars (e.g. Bachiller & Tafalla, 1999; Richer et al., 2000; Tobin et al., 2016; Nisini et al., 2015; Watson, 1985; Hollenbach et al., 1989). Moreover, theoretical models of mass ejection mechanisms from protostars predict a linear relation between mass loss rate from protostars, , and mass accretion rate, , onto the protostar (Shu et al., 1994; Najita & Shu, 1994; Pelletier & Pudritz, 1992; Wardle & Koenigl, 1993; Matt & Pudritz, 2005, 2008). Thus, observed properties of mass ejection can be used to study the mass accretion history in protostars.
While jets and outflows from protostars have been studied using several different tracers and at various wavelengths (e.g. Frank et al., 2014; Bally et al., 2007), the observational tool that is most often used for the largest sample of protostars are the low- ( 3) CO lines at (sub-)mm wavelengths which trace the ambient molecular gas swept up and accelerated by the protostellar jets (e.g. Richer et al., 2000; Bachiller & Tafalla, 1999; Arce et al., 2007; Hatchell et al., 2007a; Takahashi et al., 2008; Curtis et al., 2010; Dunham et al., 2014a; Plunkett et al., 2015). These observations of molecular outflows from protostars have shown that the time-averaged flow energetic parameters, viz., the mechanical luminosity () and the momentum flux or outflow force (), are tightly correlated with the bolometric luminosity of the protostar, (Rodriguez et al., 1982; Bally & Lada, 1983; Lada, 1985; Snell, 1987; Cabrit & Bertout, 1992; Bontemps et al., 1996; Wu et al., 2004; Hatchell et al., 2007a; Takahashi et al., 2008; Curtis et al., 2010). A few of these studies also found an evolutionary trend in the outflow force () with protostellar age (Bontemps et al., 1996; Curtis et al., 2010). Younger Class 0 sources are found to have more powerful outflows than the more evolved Class I protostars and the outflow power is found to decrease with system age. This has been interpreted as due to a corresponding steady decline in the mass accretion rate with time during the protostellar phase (Bontemps et al., 1996).
Emission lines due to the rotational transitions of CO in the far-IR ( ), observed with the PACS instrument onboard the Herschel space telescope, provide an alternate diagnostic of the jets/outflow properties of protostars. Unlike the low- CO lines observed at (sub)mm wavelengths which trace the ambient molecular gas swept up by the jets/outflows, the far-IR CO lines trace the hot gas that is currently being shocked by the jets/outflows from protostars. While the low- CO lines provide time-averaged energetics of the jets, the far-IR lines provide the instantaneous energetics of the jets. In this paper, we investigate the evolution of jet/outflow properties derived from the far-IR CO line luminosities for a large sample of protostars observed with Herschel/PACS as part of the two Herschel key programs, Herschel Orion Protostar Survey (HOPS) & Dust, Ice, and Gas in Time (DIGIT).
2. The Sample
We analysed the combined HOPS (Manoj et al., 2013) and DIGIT (Green et al., 2013b) sample of protostars for which we have Herschel/PACS spectra to search for evolutionary trends in the far-IR CO emission observed towards protostars. The HOPS program was a far-IR survey of Spitzer identified protostars in the Orion molecular clouds. The HOPS team obtained and analysed Herschel/PACS photometry of 330 protostars and PACS spectra of 36 protostars (Fischer et al., 2010; Stanke et al., 2010; Fischer et al., 2013; Manoj et al., 2013; Stutz et al., 2013; Furlan et al., 2016; Gonzalez-Garcia et al., 2016). A detailed analysis of the far-IR spectra of the 21 brightest sources in the HOPS spectroscopy sample were presented in Manoj et al. (2013). From the Herschel/PACS imaging data, the HOPS team has also identified and characterised 16 new protostars in Orion which were not detected by Spitzer or are too faint at mid-IR wavelengths (Stutz et al., 2013; Tobin et al., 2015). These sources, which are the reddest, and potentially youngest protostars in the Orion molecular clouds were called PACS Bright Red sources (PBRs) (Stutz et al., 2013). Herschel/PACS spectra for 8 PBRs were later obtained by the HOPS team as part of the Herschel open time program (Tobin et al., 2016). The DIGIT program surveyed 94 young stellar objects in different evolutionary stages with Herschel and obtained far-IR spectra of 24 Herbig Ae/Be stars, 40 T Tauri stars and 30 protostars in nearby (d 400 pc) star forming regions (van Kempen et al., 2010; Cieza et al., 2013; Sturm et al., 2013; Meeus et al., 2013; Fedele et al., 2013; Dionatos et al., 2013; Green et al., 2013b, a; Lee et al., 2014b, a; Green et al., 2016). The Herschel/PACS spectra of 30 protostars in the DIGIT sample were presented in Green et al. (2013b).
All the 21 HOPS protostars whose far-IR spectra were presented in Manoj et al. (2013) are inlcuded in the current analysis. However, only 21 of the 30 DIGIT sources presented in Green et al. (2013b) are considered here. The sources in the DIGIT sample are on average much closer than the HOPS sources, which complicates the sample in two ways: the sources are slightly extended at various wavelengths (depending on the envelope temperature structure) and some of the source fields (e.g. RCrA, Serpens) are crowded. The improved data pipeline (see Green et al., 2016) including jitter correction can successfully correct for slightly extended source continuum, but only for the brighter sources, and only when the target is the dominant source in the field of view, within a spaxel of the center. It also assumes that the line emission is distributed identically to the continuum. The remaining 9 DIGIT sources did not meet these criteria and are excluded; this includes the complicated regions RCrA-IRS5A, 7B, and 7C and Serpens-SMM3/4; the chain of MM sources in the L1448 field; and the off-center IRS 46/44 field. Also included in our analysis are the 8 PACS Bright Red sources (PBRs) for which Herschel/PACS far-IR spectra have been obtained (Tobin et al., 2016). Our final sample consists of a total of 50 protostars, which are listed in Table 3.2.
3. Data & Analysis
3.1. Spectral Energy Distributions
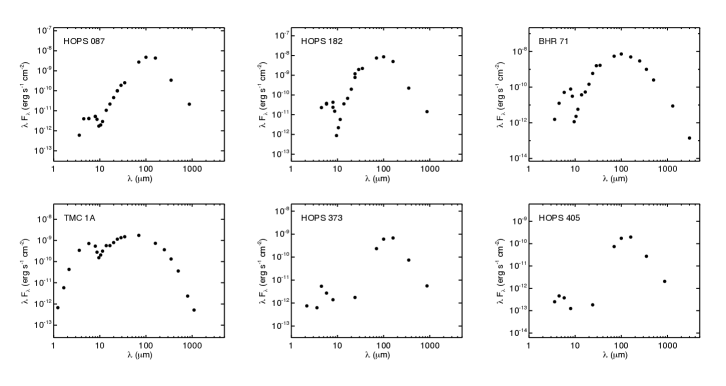
We first constructed the observed spectral energy distributions (SEDs) of our sample sources in order to estimate the basic protostellar properties. The SEDs of all the sources in our sample are uniformly sampled, from near-IR to the submm/mm. For all sources we have used Herschel/PACS 70, 100 and 160 m fluxes to make sure that the peak of the protostellar SED is well sampled. Figure 1 shows a few representative SEDs. Below we provide a detailed description of the photometric data used in the construction of the SEDs of the sources in our sample.
3.1.1 HOPS
For the HOPS sample, the 1.2 to 870 µm photometric data used are from 2MASS, Spitzer IRAC, MIPS and IRS, Herschel PACS and Atacama Pathfinder Experiment (APEX) (Manoj et al., 2013; Stutz et al., 2013; Furlan et al., 2016). The Spitzer IRS spectra have been rebinned to 12 flux values before integrating the SEDs. The details of the source of the photometry and the apertures used to extract the flux are described in the Appendix of Manoj et al. (2013). However, there are a few differences in the photometric data used in this analysis and those presented in Manoj et al. (2013). The primary one is in the PACS photometry: for several sources in crowded regions and/or regions where significant extended emission is present, we have updated the 70 and 160 µm flux using point spread function (psf) photometry; in addition, for sources which have been observed multiple times in overlapping fields, the averaged value of flux density is quoted (Furlan et al., 2016, Ali et al., in preparation). The PACS 70 µm fluxes used in this analysis differ from those presented in Manoj et al. (2013) by 4% (median); for 75% of the sources the difference is within 11%. However, for two sources, HOPS 108 and 369, the 70 µm flux is lower by more than 60%. These sources are in the crowded OMC-2 region which also has significant extended emission and we have used psf photometry to update the aperture photometry reported in Manoj et al. (2013). The median change in the PACS 160 µm flux is 9%; for 75% of the sources the difference is within 20%. For 11 sources we have updated the 160 µm flux using psf photometry. The median difference from those presented in Manoj et al. (2013) 11% and the maximum difference is in the case of HOPS 91 and 108 which have their 160 µm flux lower by 45% compared to that in Manoj et al. (2013). In this analysis, we have also added PACS 100 µm photometry for our sources obtained from the Gould Belt Survey (e.g. André et al., 2010). The aperture used to extract the the 100 µm flux is same as that used for 70 µm (for details see Furlan et al., 2016) The 350 µm and 870 µm data from APEX SABOCA and LABOCA were also re-reduced and re-calibrated (Stutz et al., 2013; Stutz & Kainulainen, 2015). The changes in flux values for most sources are 10%, well within the nominal flux uncertainties of 30%.
3.1.2 DIGIT
The photometric data used to construct the SEDs of DIGIT sources have similar wavelength coverage and sampling as that for HOPS sources. The 2MASS and Spitzer-IRAC, MIPS and IRS data were compiled from those presented in Green et al. (2013b, and references therein). As for HOPS sources, the Spitzer IRS spectra have been rebinned to 12 flux values before integrating the SEDs. In addition, we obtained the PACS 70, 100 & 160 µmand SPIRE 250, 350 & 500 µmdata for the DIGIT sources from the Gould Belt Survey (e.g. André et al., 2010) and a few other Herschel key programs (KP) and open time (OT) programs (Krause, 2010; Stutz et al., 2010; Launhardt et al., 2013; Tobin, 2010; Dunham, 2010). The SPIRE photometry was extracted with DAOPhot within the Herschel Interactive Processing Environment (HIPE) using a top-hat annulus. In order to derive aperture extraction sizes, we used the Semi-Extended Source Corrector with HIPE. This routine matches the SPIRE spectral bands by varying the source size. We then used that source size as our annulus for extraction of SPIRE photometry. The aperture sizes used range from 2247″. The same apertures were used to extract PACS photometry (for details see Green et al., 2016, Green et al. in preparation). We also made use of the ground based submm/mm photometry for the DIGIT sources presented in (Green et al., 2013b).
3.1.3 PBRs
3.2. Protostellar properties
We computed the bolometric luminosity, , bolometric temperature, and fractional submillimeter luminosity, of the protostars from their SEDs. was obtained by integrating under the observed SED over wavelength. We used trapezoidal integration for computing . The SEDs were extrapolated from the longest observed wavelength (in most cases 850 m) as , before computing . The bolometric temperature, defined as the temperature of a blackbody with the same mean frequency as the source SED, was computed from the mean frequency of the source SED, following the method of Myers & Ladd (1993). The submillimeter luminosity, was computed by integrating under the SED longward of 350 m. The protostellar parameters , and are computed in a uniform way for the HOPS, DIGIT and PBR sources in our sample and are listed in Table 3.2. For HOPS and PBR sources which are in Orion, we used a distance of 420 pc (Sandstrom et al., 2007; Menten et al., 2007; Kim et al., 2008) to compute the luminosities. For the DIGIT sources, the distances listed in Green et al. (2013b) were used.
For the HOPS sources, the values listed in Table 3.2 differ from that of Manoj et al. (2013) by 14% (median); the median difference in is 7%. These changes can be attributed to the improved photometry used in constructing the observed SED, as described in Section 3.1.1. The and values of HOPS and PBR sources listed in Table 1 agree well with those presented in Furlan et al. (2016): for most sources they agree within 5-6%. The major difference is for HOPS 369, which has been modelled as a double source comprising a disk-dominated source and a protostar by Adams et al. (2012). We integrated the SED upward of 37 to account only for the protostellar component (see Manoj et al. (2013)), whereas Furlan et al. (2016) integrated under the entire SED to obtain and . For the DIGIT sources, the and values listed in Table 3.2 differ from those in Green et al. (2013b) by 15% (median). This is because we have used Herschel PACS photometry (70, 100 & 160 ) to sample the peak of the SED, while Green et al. (2013b) used PACS spectra, which typically have an absolute flux uncertainty up to 30%, in their SEDs. In summary, we have estimated the protostellar properties for HOPS/PBR and DIGIT sample uniformly, and these quantities agree well with previous estimates within 15-20%.
As can be seen from Table 3.2, a key feature of our sample is the large range (more than 3 order of magnitude) in , from 0.1 to 275 . Also, the bolometric temperature, ranges from 15 to 605 K, indicating that our sample spans a wide range in evolutionary sequence, from early to late protostellar phase.
| Object | |||||
|---|---|---|---|---|---|
| Name | () | (K) | ( ) | ( ) | |
| HOPS | |||||
| HOPS 10 | 3.3 | 46 | 44 | 1.3 | 0.24 |
| HOPS 11 | 8.9 | 47 | 80 | 1.2 | 0.17 |
| HOPS 30 | 3.7 | 77 | 91 | 1.5 | 0.18 |
| HOPS 32 | 2.1 | 60 | 117 | 1.8 | 0.21 |
| HOPS 56 | 22.9 | 45 | 104 | 8.2 | 1.31 |
| HOPS 60 | 22.0 | 55 | 127 | 6.2 | 0.95 |
| HOPS 68 | 5.3 | 88 | 27 | 1.7 | 0.59 |
| HOPS 84 | 49.0 | 90 | 206 | 0.7 | 0.30 |
| HOPS 85 | 16.1 | 166 | 171 | 1.2 | 0.29 |
| HOPS 87 | 36.3 | 38 | 54 | 7.6 | 0.98 |
| HOPS 91 | 4.2 | 37 | 25 | 1.3 | 0.19 |
| HOPS 108 | 36.3 | 34 | 47 | 237.7 | 18.13 |
| HOPS 182 | 70.2 | 51 | 157 | 48.4 | 5.08 |
| HOPS 203 | 19.8 | 41 | 72 | 9.7 | 0.82 |
| HOPS 288 | 135.6 | 49 | 303 | 10.0 | 1.44 |
| HOPS 310 | 13.8 | 51 | 121 | 9.8 | 1.24 |
| HOPS 329 | 2.7 | 79 | 94 | 1.3 | 0.19 |
| HOPS 343 | 3.8 | 79 | 188 | 2.0 | 0.23 |
| HOPS 368 | 63.9 | 150 | 691 | 6.4 | 1.03 |
| HOPS 369 | 18.0 | 35 | 74 | 11.0 | 1.85 |
| HOPS 370 | 275.0 | 74 | 697 | 58.0 | 5.24 |
DIGIT IRAS 03245+3002 6.6 48 75 1.3 0.20 L1455-IRS3 0.3 236 16 0.1 0.06 IRAS 03301+3111 4.5 349 186 0.9 0.09 B1-a 1.5 113 285 1.6 0.23 B1-c 3.2 46 439 0.9 0.23 L1489 3.5 248 145 0.8 0.07 IRAM 04191+1522 0.1 15 50 0.2 0.03 L1551-IRS5 22.9 108 149 1.6 0.21 L1527 1.6 79 32 0.3 0.04 TMR 1 4.0 151 191 1.0 0.11 TMC 1A 2.6 189 120 0.2 0.06 TMC 1 0.7 161 33 0.6 0.05 BHR 71 11.4 45 40 9.3 0.78 DK Cha 28.3 605 655 4.4 0.41 GSS30-IRS1 10.6 172 432 5.7 0.65 VLA 1623-243 3.3 27 23 2.0 0.31 WL12 1.6 236 57 1.1 0.10 Elias 29 15.2 310 528 6.3 0.60 B335 0.8 33 20 0.6 0.08 L1157 6.7 35 30 6.1 0.71 L1014 0.3 47 9 0.1 0.02
PBRs HOPS 373 5.3 37 34 21.8 1.88 HOPS 394 6.5 45 38 1.9 0.31 HOPS 397 1.7 45 40 0.2 0.22 HOPS 401 0.6 26 13 1.0 0.10 HOPS 402 0.6 24 9 1.1 0.09 HOPS 403 4.1 44 34 2.5 0.35 HOPS 405 1.6 35 28 1.4 0.23 HOPS 409 8.3 28 47 5.8 0.76
3.3. Far-infrared CO data
The PACS spectra of the HOPS sources used to measure CO line fluxes were presented in Manoj et al. (2013). The CO lines fluxes were measured from the spectra extracted from the central spaxel of the rebinned cube, after applying the PSF loss correction (see Manoj et al., 2013). The far-IR CO luminosity, , obtained by adding up the luminosities of all the CO lines detected with PACS, and the luminosity of the CO () line, for all the HOPS sources are listed in Table 3.2. As before, we used a distance of 420 pc to Orion in computing the luminosities. For the DIGIT sources, the CO line fluxes were measured from the spectra of these sources presented in Green et al. (2016). The and for DIGIT sources are shown in Table 3.2. The distances to the DIGIT sources were taken from Green et al. (2013b). The far-IR PACS spectra of PBRs were obtained as part of the Herschel open time program OT2_jtobin_2. The details of observations and data reductions can be found in Tobin et al (2016). The CO luminosities of the 8 PBRs in our sample are listed in Table 3.2.
4. Results
4.1. Far-IR CO luminosity and
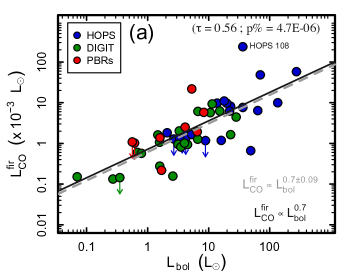
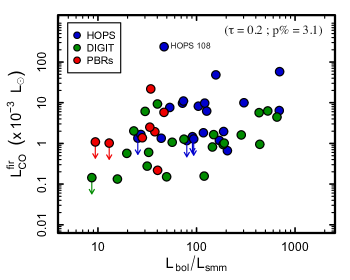
The total far-IR CO luminosity observed with PACS, , is shown as a function of in Figure 2a for HOPS and DIGIT and PBR sources. One of the HOPS sources, HOPS 108, which is in the OMC-2 region, (aka OMC-2 FIR 4) has the highest among our sample. It also has the brightest line spectra of all the protostars in the HOPS sample (Furlan et al., 2014; Manoj et al., 2013). However it has been shown recently that the intense line emission seen towards HOPS 108 is not associated with this protostar, but, instead originates in the terminal shock produced by the powerful jet driven by OMC-2 FIR 3 (HOPS 370) (Gonzalez-Garcia et al., 2016). Therefore, we do not include HOPS 108 in further analysis. For seven sources, values are upper limits (downward arrows in Figure 2 ): no CO lines are detected in these sources.
Figure 2a shows that is strongly correlated with over three orders of magnitude in both quantities. For the detections (non-upper limits), the Pearson’s product-moment correlation between log() and log() is 0.77 and the associated probability that these two quantities are uncorrelated is %. Kendall’s rank correlation coefficient, , between and is 0.56 and the associated probability p% and the Spearman’s = 0.74 and probability p% indicating that the correlation between far-IR and is strong. The functional dependence of on obtained using ordinary least square fit111We used the stats package in the R statistical software system (R Core Team, 2015) to carry out the statistical tests and least square fit. (excluding the upper limits in ) is found to be 0.7±0.09.
We also computed the correlation coefficient and the functional dependence of on including the censored data points (upper limits in ). For this we used the Akritas-Thiel-Sen (ATS) regression method, which is the extension of Thiel-Sen regression method (Sen, 1968) for censored data (Akritas et al., 1995; Feigelson & Babu, 2012). The Thiel-Sen regression obtains a slope which is the median of the slopes of lines defined by all pairs of data points and can be formulated in terms of Kendall’s tau rank correlation coefficient (Sen, 1968). For censored data, pairwise slopes involving censored data points lie in a range of possible values, and the ATS method estimates a distribution function of slopes with these interval-censored values. The median of this distribution becomes a slope estimator for the censored data. The ATS method also provides the generalised Kendall’s tau rank correlation coefficient (Brown et al., 1974) for data including censored points (see Akritas et al., 1995; Feigelson & Babu, 2012).
The generalised Kendall’s for the correlation222Throughout the paper, we have used the nada package (Lee, 2013) in R (R Core Team, 2015) to compute the best fit ATS line and the generalised Kendall’s tau rank correlation coefficient. between and is 0.56 and the associated probability is 5.0% indicating that the correlation is statistically highly significant. The correlation coefficients and the associated probabilities for the correlations between various quantities are shown in Table 2. The best fit ATS line which provides the functional dependence of on including the censored data is shown in Figure 2a and has the form
which can be written as
or equivalently as
The far-IR CO luminosity is only a small fraction of the protostellar luminosity and the ratio drops towards more luminous sources. ranges from 0.4-0.001% for the protostars in our sample. Median values of as a function of range from 0.1% for sources with ¡ 1 to 0.02% for ¿ 100 .
| / 0.7 | / 0.65 | |||||
|---|---|---|---|---|---|---|
| 0.1 (31%) | 0.4 (9%) | 0.56 (5%) | 0.64 (7%) | |||
| -0.1 (29%) | -0.3 (0.2%) | -0.3 0.2%) | ||||
| 0.2 (3.1%) | ||||||
| 0.6/ | -0.2 (11%) | -0.2 (4%) |
4.1.1 Scatter in – relation
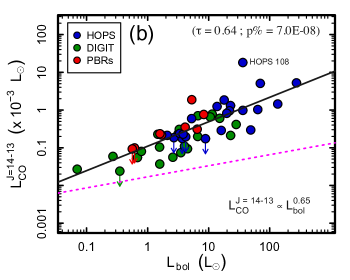
While the correlation between and is strong and reasonably tight over three orders of magnitude in both the quantities, there is some spread in the observed values for a given . The mean absolute deviation from the best fit line in Figure 2 is about a factor of 2 in and the maximum deviation, a factor of 16 lower, is detected for HOPS 84, which has an of 49 but only three detected CO lines. Part of this scatter is because not all CO lines in the PACS range are detected for all the sources. is computed by adding up the luminosities of all the detected lines, and, therefore, sources in which more CO lines are detected will have significantly higher compared to those in which very few lines are detected. The scatter produced by this effect can be minimised if luminosity of a single CO line is plotted. To illustrate this, we show CO () line luminosity, , as a function of in Figure 2b. The correlation between and is stronger than that found for : the generalised Kendall’s (including the censored data points) for the correlation is 0.64 and the associated probability is 7.0%. The best fit ATS line shown in Figure 2b has the form 0.65. The correlation between and is also tighter: the mean absolute deviation from the best fit line is only about a factor of 1.6 in and the maximum deviation from the fit is only about a factor of 6. Thus the true dispersion in – relation is only a factor of few. To summarise, far-IR CO line luminosities exhibit a strong and tight correlation with over three orders of magnitude, with an average dispersion of a factor of a few.
4.1.2 Sensitivity and the – relation
The observed 1- sensitivities of CO line fluxes for the HOPS and DIGIT sample are very similar. For example, the median CO () line sensitivity for the HOPS sample is 1.1 Wm-2, while that for the DIGIT sample is 1.3 Wm-2. However, the HOPS and the PBR sources are in Orion, and are at the same distance (420 pc), while the DIGIT sources are at various distances ranging from 106 to 325 pc. This will result in different sensitivities of CO line luminosities for the HOPS (and PBRs) and the DIGIT sources. The median sensitivity of CO () line luminosity for the DIGIT sources is 5 times lower than that for HOPS and PBR sources. In addition, the DIGIT sample preferentially have lower sources compared to HOPS and PBR sample. The resulting dependence of the sensitivity on may result in a spurious correlation if there are many non-detections and the detections are just above the sensitivity limit. We show the typical observed sensitivity for the CO () line as a function of in Figure 2b. The observed are significantly above the sensitivity for most . The sensitivity and the sample bias can at best produce an dependence of 0.3 (the dashed magenta line in Figure 2b). Thus the correlation between far-IR CO luminosities and is robust.
4.2. and evolutionary indicators
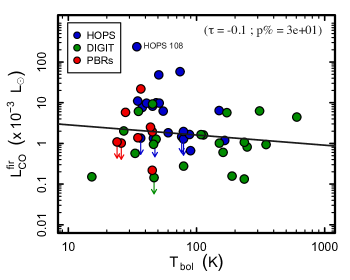
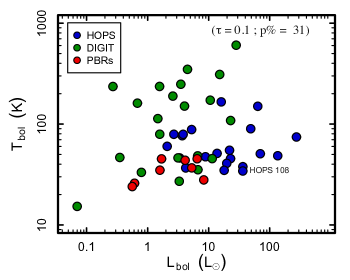
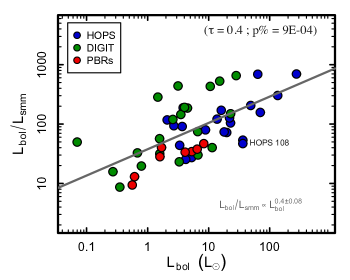
The bolometric temperature, , and the fractional submillimeter luminosity, , are the two commonly used observational tracers of protostellar evolution (e.g. Chen et al., 1995; André et al., 1993, 2000; Evans et al., 2009). In the following, instead of , we use so that both and increases as the protostellar system ages: i.e. more evolved protostars will have larger values of and . as a function of and is shown in Figure 3. For the sample of protostars presented here, far-IR does not show any statistically significant correlation with the evolutionary indicators and . The generalised Kendall’s (including upper limits) for the correlation between and is 0.1 and the probability that these two quantities are uncorrelated is 29%. , on the other hand, show a marginal positive correlation ( 2) with ( = 0.22 & p = 3.1%), which seem to suggest that increases as the protostar ages, contrary to what is generally expected. This may result from the strong dependence of , as can be seen from Figure 4. While is independent of (=0.1; p=30%), is strongly correlated with (=0.4; p=9%) and has a functional dependence of the form 0.4. The apparent positive correlation between and seen in Figure 3 is caused by the dependence of both quantities.
Although both and are measures of system age and both are derived from the observed SEDs, does not show any dependence while shows a convincing correlation with . This is because for our sample sources scales as 0.6 and not linearly with as one would expect. One possible explanation for this is that the outer regions of the protostellar envelopes are also heated externally by the interstellar radiation field, in addition to the heating from the central star. The relative contribution of external heating to will be higher in low sources, thus producing a sub-linear dependence of on . Additionally, the is highly sensitive to inclination angle (see Furlan et al., 2016), increasing significantly going from edge-on to face-on viewing geometry. , on the other hand, is relatively insensitive to the changes in the viewing angle, resulting in a flatter dependence of on .
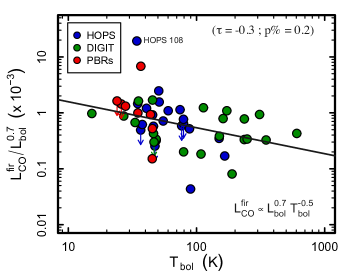
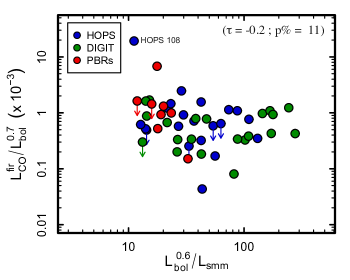
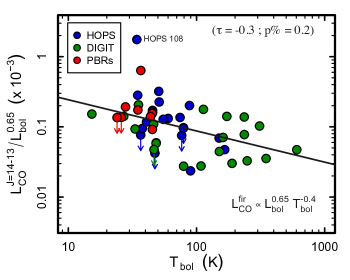
It is possible that the strong dependence of is masking evolutionary trends in . In order to check this and to emphasize evolutionary trends in , we removed the dependence of and by normalising them with the functional form of their dependence. We then searched for correlations between these normalised quantities as shown in Figure 5. The normalised far-IR CO luminosity, / 0.7, which is independent of , shows a weak ( 3) negative correlation with , indicating that far-IR CO luminosity drops as the protostellar system evolves. The generalised Kendall for the correlation is and the associated probability is 0.2%. The ATS non-parametric line fit including the upper limits gives a dependence of the form
However, far-IR is not correlated with , even after removing the dependence in both the quantities as shown in Figure 5. The generalised Kendall for the correlation is and the associated probability is 11%, indicating that these quantities are uncorrelated.
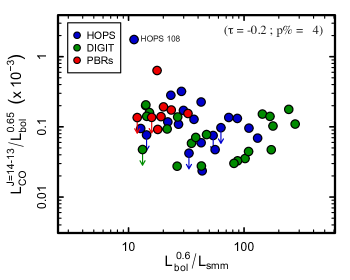
Individual CO line luminosities also display similar behaviour with protostellar evolutionary indicators. In Figure 6 we show normalised to its dependence as a function of and normalised to its dependence. / 0.65 shows a weak or no correlation with protostellar evolutionary indicators.
5. Discussion
5.1. Mass accretion-ejection connection in protostars
The far-IR CO luminosity, is the total luminosity of the high-excitation CO lines in the far-IR (50-200 µm) observed with PACS onboard Herschel. Manoj et al. (2013) have demonstrated that the far-IR CO lines observed towards low-mass protostars arise in hot (T2000 K) gas heated in outflow shocks, a conclusion supported by various other studies with Herschel (e.g. Karska et al., 2013; Matuszak et al., 2015). The cooling timescale for the postshock gas at T 2000 K and is 100 yr, which is significantly shorter than the protostellar lifetimes ( 0.5 Myr; Dunham et al., 2014b). The far-IR CO emission from protostars traces the gas that is currently being shocked by jets/outflows. , then, must be proportional to the total cooling radiation from the shocked gas which, in turn, is proportional to the energy dissipated by jets/outflows. Although other atomic and molecular species such as [O I], water, and OH can contribute to the cooling in the far-IR, Herschel studies of protostars have shown that is 30-40% of the total far-IR-cooling, and, in addition, is proportional to the total far-IR-luminosity (Karska et al., 2013; Lee et al., 2014a, Manoj et al. in prep). Thus, can be taken as a lower limit to the mechanical luminosity () of the jets/outflows dissipated in shocks over a timescale of 100 yr. In addition, the observed only includes CO emission from a compact region around the base of the jet/outflow. For Orion sources (HOPS & PBRs) the spatial extent of the observed CO emission is within a radius of 2000 AU from the protostar (see Manoj et al., 2013). For DIGIT sources, which are closer, the spatial extent probed is even smaller. The dynamical timescale of such a flow is only 100200 yr for flow velocities of 50 100 km s-1. Thus both the cooling timescale and the dynamical timescale of the observed flow are extremely short, and only a small fraction of the protostellar lifetime. , therefore, must be proportional to the instantaneous (smoothed over 100 yr) =1/2 , which ranges over three orders of magnitude for our sample. The jet/outflow velocity, , in protostars are likely to differ by a factor of a few at the most, and the large range in () is primarily due to mass-loss rate, .
The protostellar luminosity, is given by
where is the photospheric luminosity generated by gravitational contraction and deuterium burning and is the luminosity released from the accretion of material from disk onto the protostars, which is given by
where is the fraction of energy radiated away in the accretion shock, is the instantaneous protostellar mass and is the accretion rate onto the protostar. The dominant contribution to is from as the contribution from becomes important only at late times during protostellar evolution (e.g. Tobin et al., 2012). The observed points used to construct the SED from which is computed were measured within a time span of 20-30 yr. Thus is a measure of instantaneous (smoothed over 30 yr) accretion luminosity, , which depends on both and , but the large range (3 orders of magnitude) in displayed by our sample sources is primarly driven by . Therefore, should scale with accretion rate, , onto the protostar and the correlation seen in Figure 2 between and is most likely the result of instantaneous tracking instantaneous . Most jet launching mechanisms proposed for protostars predict such a tight correlation between and (e.g. Pelletier & Pudritz, 1992; Wardle & Koenigl, 1993; Shu et al., 1994).
The – relation also shows an intrinsic dispersion, as demonstrated in Section 4.1.1. Various factors could produce such scatter. Although, primarily tracks , it also depends on the flow velocity. could also depend on the properties of the immediate environment around protostars, such as envelope density and ambient gas density. The Orion sources (HOPS & PBRs) in our sample are from different and diverse regions within the Orion A (e.g L1641, OMC2/3) and Orion B cloud. The DIGIT sources are from various different star forming regions (Green et al., 2013b, 2016). In addition, has strong inclination angle dependence, while , which represents optically thin CO emission, is less likely to be affected by viewing geometry. All these factors could introduce scatter in the – relation. Despite this, the observed dispersion in the – relation is quite small: it is only a factor of few compared to the range (three orders of magnitudes) over which the correlation holds. This is possibly because both and track and smoothed over short and somewhat similar timescales, and, therefore, even if protostellar accretion is episodic, likely measure the same mass accretion/ejection event. Thus, variations in are closely tracked by , resulting in a strong correlation between the two quantities and a small dispersion.
5.2. Evolution of mass accretion/ejection in protostars
While the observed of protostars is tightly correlated with their luminosity, , it shows no, or at best a weak, correlation with evolutionary indicators such as and . As argued in Section 5.1, the tight correlation found between and is primarily driven by instantaneous closely tracking instantaneous . Such a correlation is expected irrespective of the accretion history of protostars and is consistent with both episodic accretion and steady accretion scenarios. However, we find that , which is proportional to instantaneous , shows only a marginal correlation with and no correlation with . If the accretion is steady, for example, with monotonically declining with the system age, one would expect a tight correlation between and the evolutionary indicators and . On the other hand, if accretion were episodic, the instantaneous or need not have a simple monotonic relation with system age. The lack of strong correlation between and these evolutionary indicators suggests that accretion and jet/outflow activity in protostars are likely episodic. Moreover, if mass accretion is episodic then and are not reliable indicators of the physical evolutionary stage of the protostars (Dunham et al., 2010). Thus our results are consistent with the mass accretion/ejection in protostars being episodic and do not support a steadily declining during the protostellar phase.
5.3. Comparison with (sub)mm CO emission from outflows
As pointed out in § 1, observations of low- ( 3) CO lines of the molecular outflows from protostars have shown that the mechanical luminosity, , and the momentum flux, of the molecular flow are correlated with (e.g. Lada, 1985; Cabrit & Bertout, 1992; Bontemps et al., 1996; Wu et al., 2004; Curtis et al., 2010). and are estimated from the total mass in the observed molecular flow and the characteristic velocity of the flow (see Cabrit & Bertout, 1992; Bachiller & Tafalla, 1999; Richer et al., 2000). The kinematical ages (apparent dynamical ages) of the observed molecular flows in low- ( 3) CO lines are in the range of yr (Cabrit & Bertout, 1992; Bontemps et al., 1996; Bachiller & Tafalla, 1999), which is considerably longer than the timescales associated with the protostellar energetics measured by both and , and is a significant fraction of the protostellar lifetime. The measured and are the average momentum and kinetic energy of the molecular flow over the observed dynamical age of the outflow ( 220% of the protostellar lifetime).
It is interesting to compare the functional dependence of with to that observed for . The mechanical luminosity of the outflow observed in low- CO lines, is found to scale with as (Cabrit & Bertout, 1992)
Both and have very similar dependence on , over more than three orders of magnitude. However, is 70 times lower than the for a given (also see Lada, 1985; Snell, 1987; Wu et al., 2004). and are measured using independent techniques at different wavelengths, yet the remarkable similarity of their dependence and the large range over which the relation holds suggest that far-IR and submillimeter CO emission are closely connected, and probably caused by a common mechanism. The molecular outflows are driven by jets from protostars. As the jet propagates, it entrains ambient molecular material and accelerates it, shocking the molecular gas in the process. Part of the kinetic energy of the jet is dissipated in these shocks and part of it is transferred to the entrained molecular flow. The traces the currently shocked gas and is a measure of the energy dissipated by the jets in shocks. The is the average rate at which kinetic energy is injected into the molecular flow by the jet. Both and measure different manifestations of the same process and this possibly explains their similar dependence. The observed fact that is 70 times lower than would then mean that more of the kinetic energy in the jet goes into driving the molecular flow than is radiated away in shocks.
The measured and are proportional to the mass ejection rate from the protostar smoothed over yr, or, in other words, the time-averaged mass ejection rate from the protostar, . The average momentum flux of the molecular outflow is found to be correlated with protostellar evolutionary indicators. Bontemps et al. (1996) have found that is roughly proportional to the envelope mass, , which they interpret as a progressive decline of outflow activity (or equivalently mass ejection/accretion rate) during the protostellar accretion phase. Curtis et al. (2010) have confirmed the decline of with decreasing and, in addition, find that drops with increasing with a functional for -0.6. These results indicate that both and steadily drop with protostellar age. Our results, however, show that is only weakly correlated with and not correlated with , indicating that the instantaneous mass loss rate, , as measured by far-IR does not show clear evidence of a steady decline with protostellar evolutionary tracers. This suggests that the instantaneous and are not monotonically decreasing functions of system age. One possible explanation for this behaviour is that the instantaneous accretion/ejection rate onto protostars is highly time variable and episodic, but the amplitude and/or frequency of this variability decreases with time such that the time averaged accretion/ejection rates decline with protostellar age. Numerical simulations of the accretion history of protostars are consistent with such a time evolution for protostellar accretion rates (e.g Vorobyov & Basu, 2008, 2010; Machida & Hosokawa, 2013).
We note, however, that the studies of the energetics derived from the low- CO lines in the submillimeter and the high-excitation CO lines in the far-IR are carried out on different samples. These samples differ in the distribution of protostellar properties, and in some cases, the observed SEDs from which the protostellar properties are estimated are not well sampled. For example, our sample has ranging from 0.07 to 275 , with a median value of 5 , whereas the sample of Bontemps et al. (1996) has much narrower range in (0.241 ), with a slightly lower median of 2 . Although the Curtis et al. (2010) sample has an range (0.03100 ) and median similar to our sample, the observed SEDs from which protostellar properties are computed are sparsely sampled, particularly the peak of the SED (see Hatchell et al., 2007b). Thus the correlations discussed above between various quantities will have to be demonstrated for the same sample, whose protostellar properties are well characterised, before one can draw robust conclusions about the time evolution of mass accretion/ejection in protostars.
6. Summary & Conclusions
We studied the evolution of far-IR, high () CO emission from protostars by analysing the Herschel/PACS spectra of 50 embedded sources in the nearby star forming regions observed by the HOPS and DIGIT Herschel key programmes. We first constructed uniformly sampled SEDs for these sources. The peak of the SEDs are well sampled with Herschel/PACS photometric observations at 70, 100 & 160 . We then computed the bolometric luminosity, , bolometric temperature, and fractional submillimeter luminosity, of the protostars in our sample in a uniform way from the observed SEDs. The protostars in our sample have a large range in (more than 3 orders of magnitude) and are at various stages of evolution. For this sample, we searched for correlations between far-IR CO line luminosities and various protostellar properties. Our main results and conclusions are summarised below.
-
•
We find a strong and tight correlation between far-IR CO luminosity, and the bolometric luminosity, of the protostars. The far-IR CO luminosity, scales with as 0.7. This correlation extends over more than three orders of magnitude in both quantities, with a mean dispersion from the relation of less than a factor of 2.
-
•
We find a weak correlation between and , but no correlation is found between and .
-
•
FIR CO emission from protostars trace the currently shocked gas by jets/outflows, the cooling timescales for which are 100 yr, significantly shorter than the protostellar lifetimes. , is proportional to the instantaneous mechanical luminosity of the jet/outflow, which scales with instantaneous mass loss rate, . The correlation between and , then, is indicative of instantaneous tracking instantaneous .
-
•
The lack of (or weak) correlation between and evolutionary indicators and suggests that and, therefore, do not show any clear evolutionary trend. Thus our results are consistent with mass accretion/ejection in protostars being episodic.
-
•
We compared our results with those found for the the mechanical luminosity () and the momentum flux or outflow force () of the molecular outflows observed in low- ( 3) CO lines at (sub-)mm wavelengths. The functional dependence of on that we find is similar to that found for the mechanical luminosity, , of molecular outflows observed in low-excitation CO lines. The observed similarity and the large range over which the relations hold suggest that far-IR and (sub)mm CO emission are closely connected.
Studies of molecular outflows in low- ( 3) also indicate that the time-averaged mass ejection/accretion rate steadily declines during the protostellar phase (Bontemps et al., 1996). Our results, on the other hand, suggests that the instantaneous accretion/ejection rate does not show clear evolutionary trend. One possible explanation for this is that mass accretion/ejection rate in protostars is highly time variable and episodic, but the amplitude and/or frequency of this variability decreases with time such that the time averaged accretion/ejection rate declines with system age.
These correlations will have to be demonstrated for the same sample from a homogeneous set of observations before the detailed behaviour of the time evolution of mass accretion/ejection in protostars can be confirmed.
References
- Adams et al. (2012) Adams, J. D., Herter, T. L., Osorio, M., et al. 2012, ApJ, 749, L24
- Akritas et al. (1995) Akritas, M. G., Murphy, S. A., & Lavalley, M. P. 1995, Journal of the American Statistical Association, 90, 170
- André et al. (1993) André, P., Ward-Thompson, D., & Barsony, M. 1993, ApJ, 406, 122
- André et al. (2000) —. 2000, Protostars and Planets IV, 59
- André et al. (2010) André, P., Men’shchikov, A., Bontemps, S., et al. 2010, A&A, 518, L102
- Arce et al. (2007) Arce, H. G., Shepherd, D., Gueth, F., et al. 2007, Protostars and Planets V, 245
- Audard et al. (2014) Audard, M., Ábrahám, P., Dunham, M. M., et al. 2014, Protostars and Planets VI, 387
- Bachiller & Tafalla (1999) Bachiller, R., & Tafalla, M. 1999, in NATO Advanced Science Institutes (ASI) Series C, Vol. 540, NATO Advanced Science Institutes (ASI) Series C, ed. C. J. Lada & N. D. Kylafis, 227
- Bally & Lada (1983) Bally, J., & Lada, C. J. 1983, ApJ, 265, 824
- Bally et al. (2007) Bally, J., Reipurth, B., & Davis, C. J. 2007, Protostars and Planets V, 215
- Bontemps et al. (1996) Bontemps, S., André, P., Terebey, S., & Cabrit, S. 1996, A&A, 311, 858
- Brown et al. (1974) Brown, B. W., Hollander, M., & Korwar, R. M. 1974, in Reliability and Biometry, ed. F. Proschan & R. J. Serfling (SIAM, Philadelphia), 327–354
- Cabrit & Bertout (1992) Cabrit, S., & Bertout, C. 1992, A&A, 261, 274
- Calvet & Gullbring (1998) Calvet, N., & Gullbring, E. 1998, ApJ, 509, 802
- Calvet et al. (2004) Calvet, N., Muzerolle, J., Briceño, C., et al. 2004, AJ, 128, 1294
- Chen et al. (1995) Chen, H., Myers, P. C., Ladd, E. F., & Wood, D. O. S. 1995, ApJ, 445, 377
- Cieza et al. (2013) Cieza, L. A., Olofsson, J., Harvey, P. M., et al. 2013, ApJ, 762, 100
- Curtis et al. (2010) Curtis, E. I., Richer, J. S., Swift, J. J., & Williams, J. P. 2010, MNRAS, 408, 1516
- Dionatos et al. (2013) Dionatos, O., Jørgensen, J. K., Green, J. D., et al. 2013, A&A, 558, A88
- Dunham (2010) Dunham, M. 2010, OT1_mdunham_1: Understanding the Protostellar Mass Accretion Process: Herschel 100-500 micron Photometry of Low Luminosity Embedded Protostars, Herschel Space Observatory Proposal, id.1359, ,
- Dunham et al. (2014a) Dunham, M. M., Arce, H. G., Mardones, D., et al. 2014a, ApJ, 783, 29
- Dunham et al. (2010) Dunham, M. M., Evans, II, N. J., Terebey, S., Dullemond, C. P., & Young, C. H. 2010, ApJ, 710, 470
- Dunham & Vorobyov (2012) Dunham, M. M., & Vorobyov, E. I. 2012, ApJ, 747, 52
- Dunham et al. (2014b) Dunham, M. M., Stutz, A. M., Allen, L. E., et al. 2014b, Protostars and Planets VI, 195
- Evans et al. (2009) Evans, N. J., Dunham, M. M., Jørgensen, J. K., et al. 2009, ApJS, 181, 321
- Fedele et al. (2013) Fedele, D., Bruderer, S., van Dishoeck, E. F., et al. 2013, A&A, 559, A77
- Feigelson & Babu (2012) Feigelson, E. D., & Babu, G. J. 2012, Modern Statistical Methods for Astronomy (Cambridge University Press)
- Fischer et al. (2010) Fischer, W. J., Megeath, S. T., Ali, B., et al. 2010, A&A, 518, L122
- Fischer et al. (2012) Fischer, W. J., Megeath, S. T., Tobin, J. J., et al. 2012, ApJ, 756, 99
- Fischer et al. (2013) Fischer, W. J., Megeath, S. T., Stutz, A. M., et al. 2013, Astronomische Nachrichten, 334, 53
- Frank et al. (2014) Frank, A., Ray, T. P., Cabrit, S., et al. 2014, Protostars and Planets VI, 451
- Furlan et al. (2014) Furlan, E., Megeath, S. T., Osorio, M., et al. 2014, ApJ, 786, 26
- Furlan et al. (2016) Furlan, E., Fischer, W. J., Ali, B., et al. 2016, ApJS, 224, 5
- Gonzalez-Garcia et al. (2016) Gonzalez-Garcia, B., Manoj, P., Watson, D. M., et al. 2016, A&A, Submitted to A & A
- Green et al. (2006) Green, J. D., Hartmann, L., Calvet, N., et al. 2006, ApJ, 648, 1099
- Green et al. (2013a) Green, J. D., Evans, II, N. J., Kóspál, Á., et al. 2013a, ApJ, 772, 117
- Green et al. (2013b) Green, J. D., Evans, II, N. J., Jørgensen, J. K., et al. 2013b, ApJ, 770, 123
- Green et al. (2016) Green, J. D., Yang, Y.-L., Evans, II, N. J., et al. 2016, ArXiv e-prints, arXiv:1601.05028
- Gullbring et al. (1998) Gullbring, E., Hartmann, L., Briceno, C., & Calvet, N. 1998, ApJ, 492, 323
- Hartmann (1998) Hartmann, L. 1998, Accretion processes in star formation (Cambridge, UK ; New York : Cambridge University Press, 1998. (Cambridge astrophysics series ; 32))
- Hartmann (2009) —. 2009, Accretion Processes in Star Formation: Second Edition (Cambridge University Press)
- Hartmann & Kenyon (1996) Hartmann, L., & Kenyon, S. J. 1996, ARA&A, 34, 207
- Hatchell et al. (2007a) Hatchell, J., Fuller, G. A., & Richer, J. S. 2007a, A&A, 472, 187
- Hatchell et al. (2007b) Hatchell, J., Fuller, G. A., Richer, J. S., Harries, T. J., & Ladd, E. F. 2007b, A&A, 468, 1009
- Herbig (1977) Herbig, G. H. 1977, ApJ, 217, 693
- Herczeg & Hillenbrand (2008) Herczeg, G. J., & Hillenbrand, L. A. 2008, ApJ, 681, 594
- Hollenbach et al. (1989) Hollenbach, D. J., Chernoff, D. F., & McKee, C. F. 1989, in ESA Special Publication, Vol. 290, Infrared Spectroscopy in Astronomy, ed. E. Böhm-Vitense, 245–258
- Karska et al. (2013) Karska, A., Herczeg, G. J., van Dishoeck, E. F., et al. 2013, A&A, 552, A141
- Kenyon (1995) Kenyon, S. J. 1995, in Revista Mexicana de Astronomia y Astrofisica, vol. 27, Vol. 1, Revista Mexicana de Astronomia y Astrofisica Conference Series, ed. S. Lizano & J. M. Torrelles, 237
- Kenyon et al. (1990) Kenyon, S. J., Hartmann, L. W., Strom, K. M., & Strom, S. E. 1990, AJ, 99, 869
- Kim et al. (2008) Kim, M. K., Hirota, T., Honma, M., et al. 2008, PASJ, 60, 991
- Krause (2010) Krause, O. 2010, in From Stars to Galaxies: Connecting our Understanding of Star and Galaxy Formation, 21
- Lada (1985) Lada, C. J. 1985, ARA&A, 23, 267
- Launhardt et al. (2013) Launhardt, R., Stutz, A. M., Schmiedeke, A., et al. 2013, A&A, 551, A98
- Lee et al. (2014a) Lee, J.-E., Lee, J., Lee, S., Evans, II, N. J., & Green, J. D. 2014a, ApJS, 214, 21
- Lee (2013) Lee, L. 2013, NADA: Nondetects And Data Analysis for environmental data, r package version 1.5-6
- Lee et al. (2014b) Lee, S., Lee, J.-E., Bergin, E. A., & Park, Y.-S. 2014b, ApJS, 213, 33
- Machida & Hosokawa (2013) Machida, M. N., & Hosokawa, T. 2013, MNRAS, 431, 1719
- Manoj et al. (2013) Manoj, P., Watson, D. M., Neufeld, D. A., et al. 2013, ApJ, 763, 83
- Matt & Pudritz (2005) Matt, S., & Pudritz, R. E. 2005, ApJ, 632, L135
- Matt & Pudritz (2008) —. 2008, ApJ, 681, 391
- Matuszak et al. (2015) Matuszak, M., Karska, A., Kristensen, L. E., et al. 2015, ArXiv e-prints, arXiv:1504.03347
- Meeus et al. (2013) Meeus, G., Salyk, C., Bruderer, S., et al. 2013, A&A, 559, A84
- Menten et al. (2007) Menten, K. M., Reid, M. J., Forbrich, J., & Brunthaler, A. 2007, A&A, 474, 515
- Muzerolle et al. (1998a) Muzerolle, J., Calvet, N., & Hartmann, L. 1998a, ApJ, 492, 743
- Muzerolle et al. (2001) —. 2001, ApJ, 550, 944
- Muzerolle et al. (2004) Muzerolle, J., D’Alessio, P., Calvet, N., & Hartmann, L. 2004, ApJ, 617, 406
- Muzerolle et al. (1998b) Muzerolle, J., Hartmann, L., & Calvet, N. 1998b, AJ, 116, 2965
- Myers & Ladd (1993) Myers, P. C., & Ladd, E. F. 1993, ApJ, 413, L47
- Najita & Shu (1994) Najita, J. R., & Shu, F. H. 1994, ApJ, 429, 808
- Nisini et al. (2015) Nisini, B., Santangelo, G., Giannini, T., et al. 2015, ApJ, 801, 121
- Pelletier & Pudritz (1992) Pelletier, G., & Pudritz, R. E. 1992, ApJ, 394, 117
- Plunkett et al. (2015) Plunkett, A. L., Arce, H. G., Corder, S. A., et al. 2015, ApJ, 803, 22
- R Core Team (2015) R Core Team. 2015, R: A Language and Environment for Statistical Computing, R Foundation for Statistical Computing, Vienna, Austria
- Reipurth & Aspin (2010) Reipurth, B., & Aspin, C. 2010, in Evolution of Cosmic Objects through their Physical Activity, ed. H. A. Harutyunian, A. M. Mickaelian, & Y. Terzian, 19–38
- Richer et al. (2000) Richer, J. S., Shepherd, D. S., Cabrit, S., Bachiller, R., & Churchwell, E. 2000, Protostars and Planets IV, 867
- Rodriguez et al. (1982) Rodriguez, L. F., Carral, P., Ho, P. T. P., & Moran, J. M. 1982, ApJ, 260, 635
- Safron et al. (2015) Safron, E. J., Fischer, W. J., Megeath, S. T., et al. 2015, ApJ, 800, L5
- Sandstrom et al. (2007) Sandstrom, K. M., Peek, J. E. G., Bower, G. C., Bolatto, A. D., & Plambeck, R. L. 2007, ApJ, 667, 1161
- Sen (1968) Sen, P. K. 1968, Journal of the American Statistical Association, 63, 1379
- Shu et al. (1994) Shu, F., Najita, J., Ostriker, E., et al. 1994, ApJ, 429, 781
- Snell (1987) Snell, R. L. 1987, in IAU Symposium, Vol. 115, Star Forming Regions, ed. M. Peimbert & J. Jugaku, 213–236
- Stanke et al. (2010) Stanke, T., Stutz, A. M., Tobin, J. J., et al. 2010, A&A, 518, L94
- Sturm et al. (2013) Sturm, B., Bouwman, J., Henning, T., et al. 2013, A&A, 553, A5
- Stutz et al. (2010) Stutz, A., Launhardt, R., Linz, H., et al. 2010, A&A, 518, L87
- Stutz & Kainulainen (2015) Stutz, A. M., & Kainulainen, J. 2015, A&A, 577, L6
- Stutz et al. (2013) Stutz, A. M., Tobin, J. J., Stanke, T., et al. 2013, ApJ, 767, 36
- Takahashi et al. (2008) Takahashi, S., Saito, M., Ohashi, N., et al. 2008, ApJ, 688, 344
- Tobin (2010) Tobin, J. 2010, OT1_jtobin_1: Protostellar Envelopes Resolved Inside and Out: A Close Look in the Far-IR, Herschel Space Observatory Proposal, id.752, ,
- Tobin et al. (2012) Tobin, J. J., Hartmann, L., Chiang, H.-F., et al. 2012, Nature, 492, 83
- Tobin et al. (2015) Tobin, J. J., Stutz, A. M., Megeath, S. T., et al. 2015, ApJ, 798, 128
- Tobin et al. (2016) Tobin, J. J., Stutz, A. M., Manoj, P., et al. 2016, ArXiv e-prints, arXiv:1607.00787
- van Kempen et al. (2010) van Kempen, T. A., Green, J. D., Evans, N. J., et al. 2010, A&A, 518, L128
- Vorobyov & Basu (2008) Vorobyov, E. I., & Basu, S. 2008, ApJ, 676, L139
- Vorobyov & Basu (2010) —. 2010, ApJ, 719, 1896
- Wardle & Koenigl (1993) Wardle, M., & Koenigl, A. 1993, ApJ, 410, 218
- Watson (1985) Watson, D. M. 1985, Physica Scripta Volume T, 11, 33
- Wu et al. (2004) Wu, Y., Wei, Y., Zhao, M., et al. 2004, A&A, 426, 503