A Computational Study of Particle Deposition Patterns from a Circular Laminar Jet
Optomec, Inc., 2575 University Avenue, #135, St. Paul, Minnesota 55114, USA
email: jfeng@optomec.com
Abstract
Particle deposition patterns on the plate of inertial impactor with circular laminar jet are investigated numerically with a Lagrangian solver implemented within the framework of the OpenFOAM® CFD package. Effects of taper angle of the nozzle channel and jet-to-plate distance are evaluated. The results show that tapered nozzle tends to deposit more particles toward the circular spot edge than straight nozzle. At jet Reynolds number , a tapered nozzle deposits particles to form a pattern with a high density ring toward the deposition spot edge, especially for particle Stokes number , which is absent with a straight nozzle. Increasing the jet-to-plate distance tends to reduce the value of particle density peak near deposition spot edge. Reducing to (e.g., for ccm flow through a mm diameter jet nozzle) yields particle deposition patterns without the high density ring at the deposition spot edge when the same tapered nozzle is used. The particle deposition patterns with the straight nozzle at exhibit further reduced particle density around the spot edge such that the particle density profile appears more or less like a Gaussian function. In general, the effect of reducing on particle deposition pattern seems to be similar to increasing the jet-to-plate distance. The computed particle deposition efficiency shows the fact that very fine particles with extremely small values of near the jet axis always impact the center of plate, indicating that the value of does not approach zero with a substantial reduction of . Such a “small particle contamination” typically amounts to of small particles (with ) at and at , which may not be negligible in data analysis with inertial impactor measurement.
1 Introduction
Many authors have studied particle impaction behavior with circular jets mainly for its application in aerosol particle classification by aerodynamic size with the cascade impactors (e.g., Andersen, 1966; Marple and Willeke, 1976; Hering, 1995). The original inertial impaction theory was presented by Ranz and Wong (1952). Practical designs of the inertial impactors have been guided by numerically computing the flow field governed by the Navier-Stokes equations and then integrating equations governing the particle motions for analysis of particle trajectories (cf. Marple, 1970; Marple and Liu, 1974; Huang and Tsai, 2001), Based on a thorough parametric study, Marple (1970); Marple and Liu (1974, 1975) found that sharp cutoff deposition efficiency curves can be obtained when the jet Reynolds number is between and . The gravity effect on collection efficiency of large particles in the low-velocity inertial impactor was demonstrated experimentally by May (1975). Both numerical and experimental studies of the gravity effect on particle collection efficiency in inertial impactors were carried out by Huang and Tsai (2001). However, the study of particle deposition patterns with a circular laminar jet could only be found in a publication by Sethi and John (1993) with laboratory experiments for one geometric configuration.
With the Aerosol Jet® direct-write technology, functional ink is aerosolized via an atomizer and transported as a dense mist of microdroplets (usually about nL/cc), wrapped with a sheath gas through a nozzle with an appropriate orifice, and then deposited onto the substrate by the mechanism of inertial impaction with an impinging jet flow (cf. Renn, 2006, 2007; Renn et al., 2009), enabling precision high-aspect-ratio material deposition for a variety of scientific and industrial applications (cf. Hedges, 2007; Kahn, 2007; Renn et al., 2010; Christenson et al., 2011; Paulsen et al., 2012). For well-controlled high-precision material deposition, the aerosol mist flow impacting onto the substrate is maintained in the steady laminar regime for Aerosol Jet® printing. An in-depth understanding of deposition patterns of microdroplets (typically with diameters of a few microns) with a circular laminar jet is important for Aerosol Jet® deposition nozzle design as well as process development.
In the present work, a method for evaluating particle deposition patterns is developed with computational analysis using a Lagrangian solver implemented within the framework of OpenFOAM® CFD package (www.openfoam.com/documentation/user-guide/). In what follows, the computational methodology is presented in section 2, and then results and discussion in section 3 for cases of straight nozzle () and tapered nozzle (). Finally, the conclusions are summarized in section 4.
2 Computational Methodology
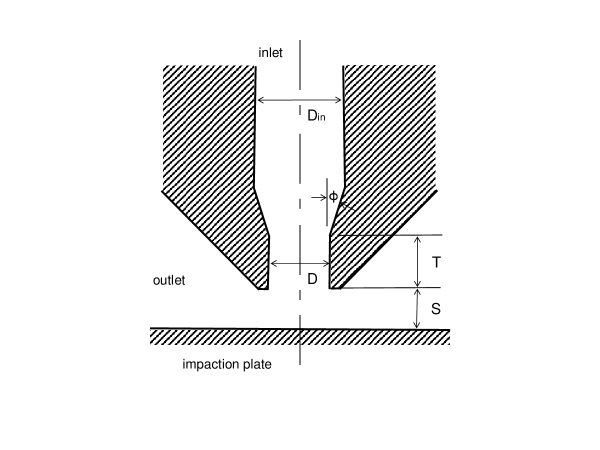
As schematically shown in Fig. 1, the inertial impactor consists of a nozzle with an circular orifice of diameter and an impaction plate of much larger diameter located at a “jet-to-plate” distance . Moreover, geometric parameters such as nozzle throat length , half angle of the tapering section , etc. can also influence the particle impaction behavior. With a given geometric configuration, the particle-laden mist flow may be generally assumed as incompressible (with the flow velocity much less than the speed of sound), laminar (with jet Reynolds number less than ), and steady (with the jet-to-plate distance comparable to ). Thus, the flow field is governed by the continuity equation for incompressible flow
| (1) |
and steady flow momentum equation (also known as the Narvier-Stokes equations for steady flow)
| (2) |
where is the vector field of flow velocity and the kinematic pressure (which comes from the thermodynamic pressure divided by the constant fluid density of the carrier gas ) with denoting the (constant) kinematic viscosity of the carrier gas (assuming the mist of particles is not too dense to cause fluid viscosity variation). The solution of flow field governed by (1) and (2) can be computed with the “simpleFoam” solver (implemented for steady incompressible flow using the SIMPLE algorithm) in the OpenFOAM® CFD package. If length is measured in units of the nozzle orifice diameter , velocity in units of with denoting the volumetric flow rate entering the impactor, and kinematic pressure in units of , the nondimensionalized (2) would have replaced by where the jet Reynolds number is defined as
| (3) |
with denoting the dynamic viscosity of the carrier gas. For the present problem (cf. Fig. 1), there are three types of boundaries: inlet, outlet, and walls. The boundary conditions at inlet are simply “zeroGradient” type for (namely, ) and “flowRateInletVelocity” type with a specified “volumetricFlowRate” for , which is equivalent to having a plug flow at the inlet as if the flow is coming from a large upstream open volume. At outlet, “fixedValue” type for () and “zeroGradient” type for are applied (namely, ); and at walls, “zeroGradient” type for and “fixedValue” type for () are used.
Once the flow velocity field is computed, the position vector of each particle in a Lagrangian frame can be calculated from the equations of motion
| (4) |
and
| (5) |
where denotes the particle velocity at position and time , the particle mass, and the forces acting on the particle. The OpenFOAM® CFD package contains a “basicKinematicCloud” class to introduce kinematic parcels and to track the parcel positions according to the specified forces . In general, a parcel is a computational particle, which may contain multiple actual particles depending upon the model specifications, to reduce the computational burden for tracking large number of individual particles. When the number of particles is not large, a parcel can be computed as an individual actual particle (as in the present work).
For Aerosol Jet® printing, the mist of ink droplets usually contains ink of about nL/cc, or the ink volume fraction of . Thus, the droplets can be considered far enough apart that each droplet behave as an isolated spherical particle in the mist flow. Because the ink droplets suitable for Aerosol Jet® printing typically have diameters in the range of 1 to 5 m, Browniian diffusion effect should be negligible. Thus, the dominant forces acting on each particle are the drag due to the relative motion in fluid and the gravitational force , i.e., . In the present work, the particles are assumed to be spheres to represent ink droplets; thus, “sphereDrag” and “gravity” are specified as the “particleForces” in the “kinematicCloudProperties”. In OpenFOAM-2.4.0 (which is used in the present work), the “sphereDrag” is computed according to
| (6) |
where denotes the particle density, the particle diameter, and ( m s-2) the gravitational acceleration in the axial flow velocity direction. The drag coefficient is calculated according to
| (7) |
with the particle Reynolds number defined as
| (8) |
To keep the model theoretically clean, a “Lagrangian” solver is implemented within the OpenFOAM® framework such that the presence of kinematic cloud parcels does not disturb the given steady flow field obtained from the “simpleFoam” computation, while the motion of parcels is determined by solving (4)–(6) from the given flow field . It should be noted that (6) in the OpenFOAM® implementation does not contain the Cunningham slip correction factor in the denominator as usually seen in the aerosol science literature. Therefore, it is added by modifying the source code of “SphereDragForce.C” according to
| (9) |
where is the mean free path of the gas (which is about m at oC) with , , and (Friedlander, 1977).
With the OpenFOAM® Lagrangian solver, particles can be introduced in flow by several built-in “injectionModels”, among which the type of “manualInjection” allows particles (one per parcel) of specified diameter to be injected at specified positions inside problem domain. In the present work, a set of particles of identical properties is placed near the flow inlet at known radial positions from the axis of symmetry with given spacing, e.g., at with , with the particle initial velocity specified to match that of the inlet plug flow. The radial positions of individual particles can be determined from the “patchPostProcessing” data file containing those particle deposition positions on the impaction plate. Then, assuming the particle concentration is uniform at the nozzle inlet, a dimensionless surface particle density at a given radial position on the impaction plate can be calculated as
| (10) |
Noteworthy here is that the density of deposited particles on the impaction plate given by (10) is evaluated as inversely proportional to the change of relative spacing between neighboring particles, with and denoting the beginning (at the inlet) and ending (at the impaction plate) positions of the trajectory of particle . The number of particles arriving the impaction plate within the ring defined by and is expected to be conserved, i.e., being the same as that at inlet with plug flow within the ring defined by and .
For a given , there is a critical radius () at nozzle inlet beyond which the particles would not deposit onto the impaction plate; they exit through the outlet boundary. If the particle concentration and flow velocity profile are assumed to be uniform at inlet (as consistent with the specified plug flow boundary condition), the deposition efficiency can be determined as
| (11) |
where is the diameter of nozzle inlet (cf. Fig. 1).
The value of the Stokes number, defined as the ratio of the particle stopping distance and the radius of the nozzle orifice (), is written as (Fuchs, 1964)
| (12) |
In the literature of inertial impactors, curves are usually presented in terms the particle deposition efficiency versus , where is considered as the dimensionless particle diameter.
With the OpenFOAM® “kinematicCloud”, several interaction models between parcel and boundary patch are available. Although particle rebound can be modeled with appropriately specified elasticity and restitution coefficient, it is much simpler to just assume the particle remains where it contacts the surface. In the present work, the mode of local interactions between particles and boundaries, such as impaction plate, walls, and outlet, is simply specified as “stick” in the OpenFOAM® input file, which is especially reasonable for the Aerosol Jet® printing, where the particles are actually the liquid microdroplets of ink materials. Thus, droplet rebounding and splashing are not considered in the computation, for simplicity.
3 Results and Discussion
For convenience of comparison, the nominal settings in the geometric configuration shown in Fig. 1 (similar to that used by Sethi and John (1993)) are mm, , with various and . The jet Reynolds number can be varied by changing the volumetric flow rate at inlet. For the carrier gas, the value of is taken as N s m-2 and as kg m-3, as typical values for nitrogen under ambient temperature and pressure. Thus, we have for a flow rate of ccm with m s-1. The value of particle density is assumed to be kg m-3; therefore, the spherical particle diameter is the same as the “aerodynamic diameter”.
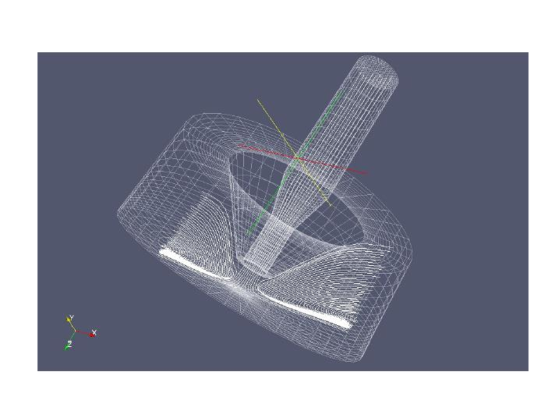
Full three-dimensional mesh is used in the present problem such that particles can be placed with adequate spacing in between, to avoid particle-particle interactions in the “basicKinematicCloud” class of OpenFOAM® package. Fig. 2 shows the streamline plot of “simpleFoam” computational result for the geometric configuration of , , and , along with the three-dimensional mesh used for the computation. The “blockMesh” utility of OpenFOAM® is used for generating the high-quality hexahedral mesh with finite-volume cells in the nozzle and impaction regions being around m, which is determined to be adequate for accurately resolving the laminar flow field of impinging jet while being much larger than the particle diameter as desired for Lagrangian tracking of discrete particles. The steady jet impinging flow structure appears fairly similar to that shown for in an independent study with a different computational methodology by Feng (2015).
| (m) | (ms) | (mm) | ||
|---|---|---|---|---|
| 0.5 | ||||
| 1 | ||||
| 1.5 | ||||
| 1.75 | ||||
| 2 | ||||
| 3 | ||||
| 4 | ||||
| 5 |
For convenience, Table 1 illustrates the values of the Stokes number , the dimensionless particle size , along with the often referred to particle motion parameters (e.g., Fuchs, 1964) such as characteristic time (or relaxation time) of particles in response to nonuniform rectilinear flow and stop distance , for various particle diameter at with . Because m/s and therefore the value of Froude number is greater than , the effect of gravity is expected to be negligible according to Huang and Tsai (2001) although gravity is included in the OpenFOAM code by default in (6).
Although in typical impactors for particle size analysis the jet-to-plate distance is comparable to the nozzle size , very large (e.g., ) is usually employed in the nozzle-to-plate settings with Aerosol Jet® printing. Therefore, the present study examines a range of from to for gaining insights into both traditional inertial impactor and Aerosol Jet® applications.
3.1 Straight nozzle without taper ()
The case without nozzle taper represents the simplest geometric configuration for computational modeling, and therefore is especially of theoretical importance because aerosol flow in the nozzle channel is well defined and straightforward.
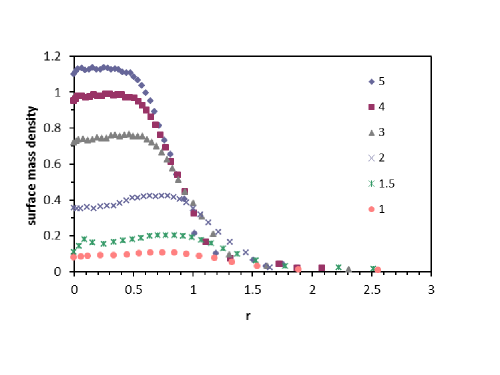
Fig 3 shows particle deposition patterns in terms of the dimensionless particle density as a function of normalized radial position on the impaction plate, determined according to (10). In this case, the jet Reynolds number is (for a flow rate of ccm through a nozzle of mm). With particle density of kg m-3, the particles of diameters in a range of m to m cover the range of from to (cf. Table 1), wherein most significant variation of the particle deposition efficiency is expected. Obviously, fewer particles of relatively smaller size could be deposited on the impaction plate; therefore, we have relatively lower surface mass density for smaller . It is interesting to note the particle deposition pattern, or profile of , also changes with the value of particle size or , namely, smaller particles tends to have slightly lower deposition rate at the center (around ) with relatively higher deposition rate extending to larger radial position . For larger particles such as and m or and , the total deposited mass are the same with (cf. Table 2) but the particle deposition patterns exhibit noticeable differences. The profile of m is about lower than that of m in the middle region (), but becomes higher at larger radial distance () such that the two different profiles corresponds to the same amount of normalized particle volume on the impaction plate.
Because the particle deposition patterns typically exhibit a rapid declining edge (followed by a rather long tail with insignificant amount of particle deposition), it may be meaningful to use the radial position for‘surface mass density to reach half of its peak value (where the slope is expected to be close to its maximum magnitude as can be easily determined in profilometer measurements) to define the deposition spot size, namely, the “spot radius” (or “spot diameter” ). For example, the cases of m () and m () in Fig. 3 have and , respectively (both are , i.e., less than nozzle radius). But for m () and m (), the spot radius would become and , respectively (larger than nozzle radius). It is understandable that the particle deposition pattern spreads out as indicated by the increasing value of with reducing , because the smaller particles tend to follow the deflecting streamlines of gas flow more closely. Interestingly, for the case of m (, not shown in Fig. 3), the value of is . The reason for a shrinking with further reduced is that particles located in larger rings away from the axis (having larger ) are unable to impact the plate but to be carried by the deflecting gas flow to the outlet.
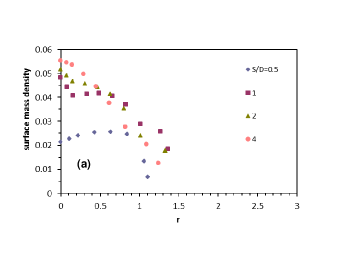
Fig. 4 shows the effects of varying the (normalized) “jet-to-plate” distance with the straight nozzle at for (a), (b), (c), and (d). The deposition pattern varies considerably with changing of from to for small particles with , but becomes relatively insensitive to variation of when is greater than . The change in particle deposition pattern is mostly noticeable when varies between and , especially for small , but not much so for . The values of spot radius in Fig. 4(a) are , , , and repectively for , , , and , whereas that in Fig. 4(b) become , , , and . Thus, the spot radius seems to increase slightly with increasing jet-to-plate distance , when is small (e.g., ). However, for the case of Fig. 4 (c) , we have , , , and repectively with , , , and . Similarly, the case of Fig. 4 (d) has , , , and for , , , and , respectively. The spot radius tends to decrease slightly with increasing for relatively large .
Table 2 shows computed deposition efficiancy for various particle sizes with , , , and labled as the subscript of . Again, the change in deposition efficiency is mostly noticeable when varies from to especially for , but not much so for . It is a bit counterintuitive to find that the deposition efficiency for a given tends to be lower for , namely, when the impaction plate is closer to the nozzle exit, especially for relatively small (with small particles). This suggests an impactor with relatively smaller jet-to-plate distance to yield a sharper cut for deposition efficiency in terms of particle size. It seems that larger (e.g. ) would lead to a more gradual change of versus especially at relatively small . The value of seems to be rather insensitive to the change of in the range from to , varying within from the average value with a minimum of around .
| (m) | |||||
|---|---|---|---|---|---|
| 0.5 | |||||
| 1 | |||||
| 1.5 | |||||
| 1.75 | |||||
| 2 | |||||
| 3 | |||||
| 4 | |||||
| 5 |
Another observation from Table 2 is that significant amount of deposition still occurs (e.g., ) with particles of very small (), indicating an ever-present “small particle contamination” on an impaction plate intended to catch only larger particles. If the value of the Stokes number is evaluated according to the ratio of stop distance and the actual particle radial position from the nozzle axis at the nozzle exit (instead of ), the particles closer to the axis (with smaller radial distance) would have larger effective values of and therefore would be expected to impact the plate. Based on this logic, the particles around axis should have very large effective and always impact the plate regardless their sizes. Another way of explaining this phenomenon is to consider the radial component of laminar flow velocity as a circular jet impinging on a solid surface. As the jet is approaching the surface, the flow spreads in the radial direction as the axial velocity decreases. According to the continuity equation (1), is expected to increase with starting from zero at ; in other words, as . Thus, in the vicinity of the axis (), diminishes such that the deflecting flow parallel to the impaction wall tends to disappear and particles near the axis always arrive at the plate without being deflected. As a check, computations are performed with a reduction of from to which effectively reduces from to for m (by an order of magnitude) and the results show and . Thus, about of fine particles with are expected to always impact the plate, for . In fact, the characteristic “S” shape deposition efficiency curves often observed experimentally with enhanced small particle impaction had also been commented by Jurcik and Wang (1995) which seem to be consistent with their computational results.
3.2 Tapered nozzle with
| (m) | |||||
|---|---|---|---|---|---|
| 0.5 | |||||
| 1 | |||||
| 1.5 | |||||
| 1.75 | |||||
| 2 | |||||
| 3 | |||||
| 4 | |||||
| 5 |
Many impactors are designed to have a tapered inlet for practical reasons (cf. Marple and Willeke, 1976). In cascade impactors, the taper half angle is usually larger than . However, in the Aerosol Jet® printers the tapering channels tend to have smaller for the desire of minimizing deviation of ink droplets from the flow streamlines. Here, the effect of having a taper section in the nozzle inlet channel on particle deposition patterns is examined with the taper half angle specified as (with mm and mm), among numerous possibilities. The results are expected to adequately illustrate the general trends of particle impaction behavior with tapered nozzle configuration.
Table 3 shows the values of computed deposition efficiency versus corresponding to various particle diameters with , , , and , as in Table 2 but for cases with tapered nozzle having . The value of seems to be rather insensitive to the change of for the most part, except that (for ) becomes noticeably lower than the others between and . The variation of is also insigificant for different values of with an average value of and a minimun of around . Compared with the corresponding values of in Table 2 for straight nozzle, the tappered nozzle tends to yield steeper slope of the deposition efficiency curve for a usually desired sharper “cut”. This could be a consequence of the aerodynamic focusing effect with the converging flow in tapered channel. However, the particles flowing adjacent to the wall in a tapering channel can impact and stick on the channel wall due to their inertia. For example, the present computations show that all particles of m () placed within m from the wall at inlet would impact on the nozzle channel wall instead of exiting the nozzle orifice. This converts to about of the incoming particles with uniform concentration becoming “wall loss” inside the tapered nozzle channel. Such a wall loss is found to increase with increasing . For particles of ( m, m), about would impact the tapered nozzle channel wall and become the wall loss. Therefore, the values of deposition efficiency in Table 3 are calculated based on fractions of particles actually exiting the nozzle rather than fractions of incoming particles at inlet, by replacing in (11) with where the value of depends on the particle size (generally increasing with ). To prevent such a wall loss, introducing a coflowing sheath gas with a flow rate about of the particle laden flow may be practically feasible.
As in Fig. 3 but for tapered nozzle with , profiles of dimenionless particle density as a function of , namely , on the impaction plate are shown in Fig. 5 for , , , , and m (as labeled). The differences made by tapering section appear to be quite significant, when comparing Fig. 5 to Fig. 3. The converging flow in tapering channel induces the aerodynamic focusing effect that pushes particles inward (cf. Dahneke et al., 1982; Rao et al., 1993), with stronger effect on larger particles further away from the axis (at larger ) than those closer to the axis. Therefore, a region of concentrated particle impaction is expected in the particle deposition pattern. Such a region of high particle density appears to be toward the edge of the circular deposition spot shown as a narrow sharp peaks in Fig. 5 for particles of relative large ( or m), which is absent in Fig. 3. Another noticeable effect of the tapered nozzle is that the “spot radius” (defined in subsection 3.1) in Fig. 5 varies more substantially with than that for straight nozzle shown in Fig. 3, as expected based on the dependence of aerodynamic focusing effect upon particle size. For example, the values of are , , , , , and for , , , , , and , respectively (corresponding to the labels , , , , , and in Fig. 5). As their size decreases, the particles tends to follow the outward deflecting gas flow more closely before impacting the plate, leading to generally increased values of .
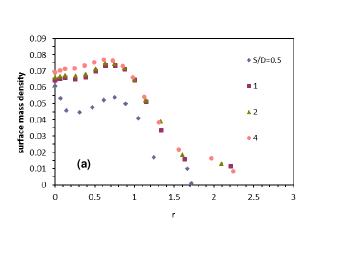
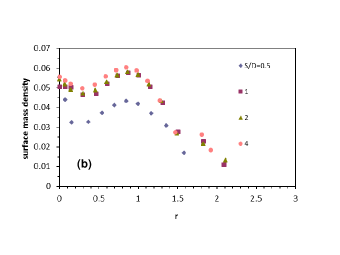
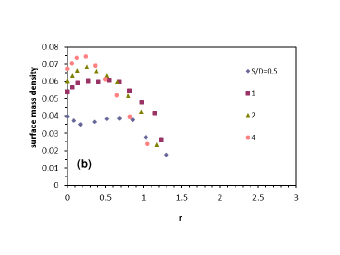
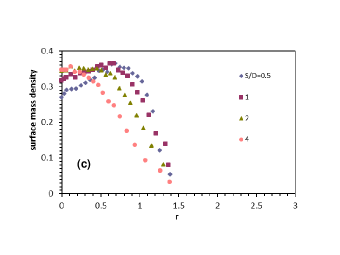
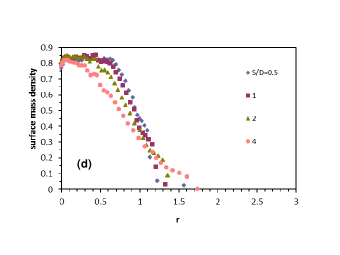
The effect of jet-to-plate distance on particle deposition pattern is shown Fig. 6 for , , , and as labeled with (a) , (b) , (c) , and (d) , as in Fig. 4 but for tapered nozzle with . The profiles of for small particles, as shown in Figs. 6(a) and 6(b) for and have similar shapes for various except the ones for are relatively lower as consistent with relatively lower deposition efficiency in Table 3. The values of in Fig. 6(a) are , , , and respectively for , , , and , while those in Fig. 6(b) are , , , and . The profiles in Fig. 6(c) for ( m) show very similar “donut” shape (with a ring of high particle density toward deposition spot edge) to that found experimentally by Sethi and John (1993) for their case of , (which is the smallest illustrated in their plots), exhibiting a gradual piling peak toward the edge of the deposition spot. The values of in Fig. 6(c) are , , , and respectively for , , , and , while those for Fig. 6(d) for are , , , and . The profiles of for larger () also look similar to those illustrated by Sethi and John (1993) except their experimental data points are spaced a bit too coarse to resolve the narrow peaks toward the spot edge. Such a reasonable comparison with the experimentally measured pattern by Sethi and John (1993) may serve as an independent (qualitative) validation-varification for the present computational results. The plots (c) and (d) in Fig. 6 exhibit a general trend of reducing peak particle density toward the deposition spot edge with increasing the jet-to-plate distance.
3.3 Cases with
If all the parameters are kept the same except the flow rate at the inlet is reduced to ccm (from the nominal value of ccm), the value of the jet Reynolds number becomes (instead of ). Thus, the values of for given become about one half of those in Tables 1–3, for convenience of comparison.
| (m) | |||||
|---|---|---|---|---|---|
| 0.5 | |||||
| 1 | |||||
| 2 | |||||
| 3 | |||||
| 4 | |||||
| 5 | |||||
| 6 | |||||
| 8 |
Shown in table 4 are values of the deposition efficiency versus for various particle diameter with , , , and (as subscript of ) at with . Comparing with those in table 3 at , the values of corresponding to similar are generally lower for , as expected from less impinging momentum with thicker viscous boundary layer due to smaller . Unlike the case with in table 3, the value of at in table 4 appears to increase monotonically with from to . The values of indicate a trend of reduced sharpness of a cut for the deposition efficiency curve versus particle size when the jet-to-plate distance increases.
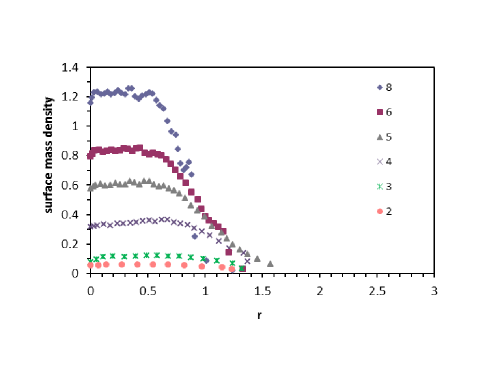
Similar to Figs. 3 and 5, the particle deposition pattern in terms of the dimensionless particle density is shown in Fig. 7 for tapered nozzle with at as a function of radial position on the impaction plate. In contrast to Fig. 5 with the same tapered nozzle (for ), the profiles of in Fig. 7 (for ) do not show narrow high peaks toward edge even for relatively large ; they rather look similar to those profiles in Fig. 3 for straight nozzle (at ). It is interesting to note that the values of spot radius (defined as the radius position on impaction plate for to reach half of its peak value, as defined above) corresponding to similar values of are fairly comparable between those in Fig. 7 and Fig. 3 (rather than Fig. 5). For example, corresponding to , , and in Fig. 7 the values of are estimated as , , and , respectively comparable to those in both Figs. 3 and 5. With smaller at and , the values of become and , rather comparable to those in Fig. 3 but not Fig. 5. Thus, with the same tapered nozzle at smaller jet Reynolds number (e.g., ) the high particle density peak toward deposition spot edge disappears, while the particle deposition spot size does not change significantly especially for particles of .
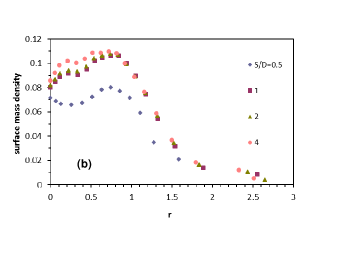
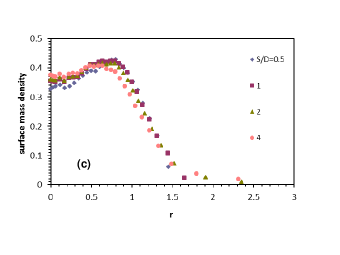
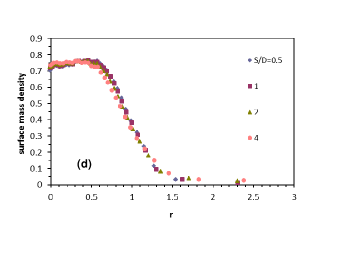
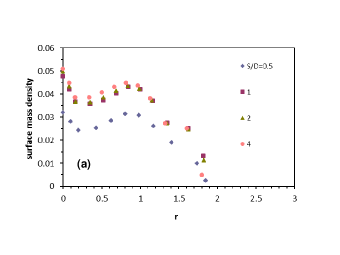
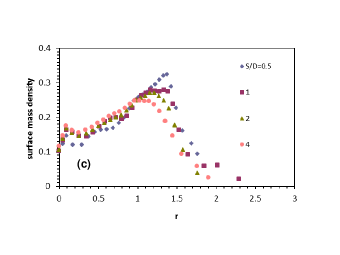
The effect of jet-to-plate distance is shown in Fig. 8 for . In contrast to those in Figs. 4 and 6 at similar values of , the particle deposition pattern varies much more significantly with the change of the value of in Fig. 8, which appears also consistent with the deposition efficiency data in Table 4. For example, relatively much lower at small is quite obvious for the case of in Figs. 8(a) and 8(b). The decreasing with increasing at is clearly reflected in Fig. 8(c) with shrinking (, , , and for , , , and , respectively). However, at Fig. 8(d) shows distinctive difference between in the case of and , with more gradual decline of with (lack of edge definition) for () than that for () despite both have the same value of (cf. Table 4). Such a feature of gradual declining without a clearly defined edge (as usually indicated by a sudden change of slope) becomes a common particle deposition pattern exhibited for cases with straight nozzle () at . Yet the trend of reducing particle density near the edge of deposition spot with increasing jet-to-plate distance can consistently be observed in plots (c) and (d) of Fig. 8 for .
If straight nozzle is used with a jet flow at , the profiles of become more or less like a Gaussian function (similar to that in Fig. 8(d) for ) without a clearly defined edge, in contrast to those for with a flat center (cf. Fig. 3). Relatively speaking, the tapered nozzle tends to deposit more particles toward the deposition spot edge than the straight nozzle. Reducing the value of generally leads to less particle deposition toward the deposition spot edge, i.e., the profiles of particle density exhibit more gradual slopes of decline with for smaller .
3.4 Deposition efficiency
The study of particle deposition cannot be completed without an examination of the deposition efficiency. As given in Tables 2 and 3 for , the values of at a given are fairly insensitive to the variation of the (normalized) jet-to-plate distance , except for straight nozzzle (with ) becomes noticeably lower for and for tapered nozzle (with ) noticeably lower within a narrow interval around , e.g., from to . It seems the straight nozzle configuration is not very sensitive to the jet-to-plate distance variation for , whereas the tapered nozzle configuration insensitive to variation for . In other words, the straight nozzles become sensitive to variations when whereas the tapered nozzles sensitive when .
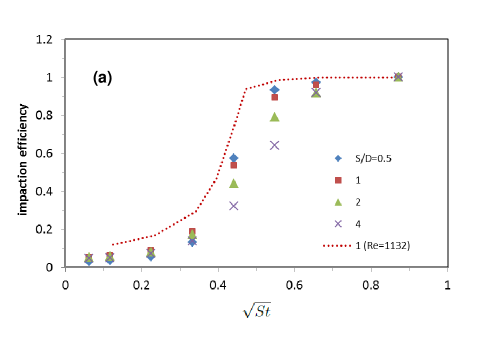
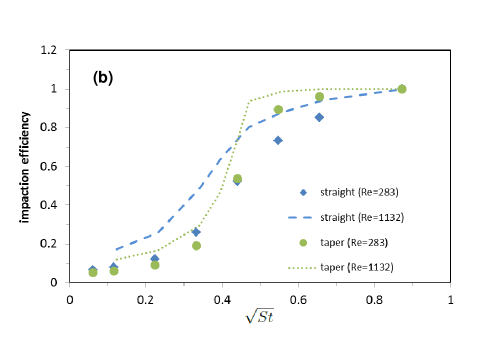
However, at the value of at a given seems to change substantially with the variation of , especially between and , as shown in Fig. 9(a). A consistent trend can be seen of noticeably lower for relative larger while having lower for smaller and diminishing , as also apparent in Tables 2—4. The general trend of lower deposition efficiency with smaller at a given is shown in Fig. 9(b), for both straight nozzles and tapered nozzles with the case of . It also illustrates the fact that tapered nozzles yield relatively sharper cut in terms of versus , i.e., with lower for and higher for larger , than the straight nozzles.
For completeness, values of deposition efficiency with straight nozzle () at for , , , and are computed and shown in Table 5. Comparing with those in Table 4 for tapered nozzle, the range of variation in with in Table 5 is generally smaller with straight nozzle; In other words, deposition efficiency of straight nozzles are less sensitive to the jet-to-plate distance variations than that of tapered nozzles. This could be a consequence of the lack of aerodynamic focusing with the straight nozzle, which tends to form more collimated particle stream.
| (m) | |||||
|---|---|---|---|---|---|
| 0.5 | |||||
| 1 | |||||
| 2 | |||||
| 3 | |||||
| 4 | |||||
| 5 | |||||
| 6 | |||||
| 8 |
With regard to the small particle contamination, it is reduced with decreasing as shown in Fig. 9 as well as Tables 2—4. Yet still, the value of does not seem to become zero with diminishing , for the same reason discussed in the end of section 3.1. At , about of small particles with even seem to tenaciously impact the plate without being deflected by the radially diverging “wall jet” flow along the plate surface. Apparently with optimizing the device design, the small particle contamination may be reduced somewhat, but cannot be eliminated completely with inertial impactors.
4 Conclusions
Investigation of particle deposition pattern on the impaction plate of an inertial impactor is carried out numerically using a Lagrangiann solver implemented within the framework of the OpenFOAM® CFD package. Various effects of the inertial impactor configuration, such as the jet-to-plate distance, taper angle of the nozzle channel, etc., are examined with discussion of physical implications.
At (with denoting the jet Reynolds number), the particle deposition patterns corresponding to different values of (with denoting the particle Stokes number) with the straight nozzle (for the taper half angle ) are mostly as expected with a generally flat center and quick decline of the particle density toward the edge of the deposition spot. But with a tapered nozzle (for ), the deposited particles form a high density ring near the edge of the deposition spot especially for , probably due to the relatively strong aerodynamic focusing effect on particles away from the axis. The tapered nozzle tends to deposit particles with larger circular patterns (with larger spot radius) than the straight nozzle for the same values of , and its deposition spot radius is more sensitive to the value of (exppected as a result of the dependence of aerodynamic focusing effect upon particle inertia). A general trend of reduced value of the particle density peak near deposition spot edge is shown with increasing the jet-to-plate distance .
With being reduced to (as ccm flow through a mm nozzle), particles deposited with the same tapered nozzle () do not seem to form the high density peak toward deposition spot edge. As with the straight nozzle at , reducing tends to reduce the particle density around the deposition spot edge more than that closer to the axis. The same trend also applies to the effect of increasing the jet-to-plate distance in general.
A close examination of the particle deposition efficiency shows the fact that a small amount of very fine particles with extremely small values of always impact the center of plate. Thus, the value of does not approach zero with a substantial (orders of magnitude) reduction of the value of . It should not be difficult to understand that particles along the axis () will not be easily deflected by the sharply bending streamlines, with diminishing magnitude of the radial velocity component around the center of the stagnation zone. Such a “small particle contamination”, which typically amounts to small particles with at and at , may not be negligible in data analysis with inertial impactor measurement.
Acknowledgments
The author would like to thank John Lees for support and guidance, and John Hamre, Dr. Kurt Christenson, Dr. Mike Renn, as well as many other Optomec colleagues, for helpful technical discussions.
References
- Andersen (1966) Andersen, A. A. (1966). A sampler for respiratory health hazard assessment. Am. Ind. Hyg. Assoc. J. 27(2):160–165
- Christenson et al. (2011) Christenson, K. K., Paulsen, J.A., Renn, M.J., McDonald, K., and Bourassa, J. (2011). Direct printing of circuit boards using Aerosol Jet®. Proc. NIP 27 Digital Fabric. 433–436
- Dahneke et al. (1982) Dahneke, B. Hoover, J., and Cheng, Y.S. (1982). Similarity theory for aerosol beams. J. Colloid Interf. Sci. 87(1):167–179
- Feng (2015) Feng, J. Q. (2015). Sessile drop deformations under an impinging jet. Theor. Comput. Fluid Dyn. 29:277–290
- Friedlander (1977) Friedlander, S. K. (1977). Smoke, Dust, and Haze, Fundamentals of Aerosols Behavior. John Wiley & Sons, New York for an isolated spherical particle in an unbound medium.
- Fuchs (1964) Fuchs, N. A. (1964). The Mechanics of Aerosols. Pergamon Press, New York for an isolated spherical particle in an unbound medium.
- Hedges (2007) Hedges, W. M. King, B., and Renn, M. (2007). Direct writing for advanced electronics packaging. www.onboardtechnology.com/pdf_giugno2007/060706.pdf
- Hering (1995) Hering, S. V. (1995). Impactors, cyclones, and other inertial and gravitational collectors. In Cohen, B., Hering, S. V. (Eds) Air Sampling Instruments for Evaluation of Atmospheric Contaminants, 8th Edition, American Conference of Goverrnmental Industrial Hygienists, Cincinnati, OH, pp. 279–322
- Huang and Tsai (2001) Huang, C.-H. and Tsai, C.-J. (2001). Effect of gravity on particle collection efficiency of inertial impactors. J. Aerosol Sci. 32:375–387
- Jurcik and Wang (1995) Jurcik, B. and Wang, H.-C. (1995). On the shape of impactor efficiency curves. J. Aerosol Sci. 26(7):1139–1147
- Kahn (2007) Kahn, B. E. (2007). The M3D aerosol jet system, an alternative to inkjet printing for printed electronics. Organic and Printed Electronics. 1:14–17
- Marple (1970) Marple, V. A. (1970). A Fundamental Study of Inertial Impactors, PhD Dissertation, University of Minnesota
- Marple and Liu (1974) Marple, V. A. and Liu, B. Y. H. (1974). Characteristics of laminar jet impactors. Environment Sci. Technol. 8:648–654
- Marple and Liu (1975) Marple, V. A. and Liu, B. Y. H. (1975). On fluid flow and aerosol impaction in inertial impactors. J. Colloid Interf. Sci. 53:31–34
- Marple and Willeke (1976) Marple, V. A. and Willeke, K. (1976). Impactor design. Atmos. Environ. 10:891–896
- May (1975) May, K. R. (1975). Aerosol impaction jets. J. Aerosol Sci. 6:403–411
- Paulsen et al. (2012) Paulsen, J. A., Renn, M., Christenson, K., and Plourde, R.(2012). Printing conformal electronics on 3D structures with Aerosol Jet technology. In Future of Instrumentation International Workshop (FIIW) doi: 10.1109/FIIW.2012.6378343
- Ranz and Wong (1952) Ranz, W. E. and wong, J. B. (1952). Impaction of dust and smoke particles on surface and body collectors. Industrial and Engineering Chemistry, 44:1371–1381
- Rao et al. (1993) Rao, N. P., Navascues, J., and de la Mora, J. F. (1993). Aerodynamic focusing of particles in viscous jets. J. Aerosol Sci., 24:879–892
- Renn (2006) Renn, M. J. (2006) Direct WriteTM system. U.S. Patent 7,108,894 B2
- Renn (2007) Renn, M. J. (2007) Direct WriteTM system. U.S. Patent 7,270,844 B2
- Renn et al. (2009) Renn, M. J. King, B. H., Essien, M., Marquez, G. J., Giridharan, M. G., and Shen, J.-C. (2009) Apparatuses and methods for maskless mesoscale material deposition. U.S. Patent 7,485,345 B2
- Renn et al. (2010) Renn, M. J. Essien, M., King, B. H., and Paulsen, J. A. (2010) Aerodynamic jetting of aerosolized fluids for fabrication of passive structures. U.S. Patent 7,674,671 B2
- Sethi and John (1993) Sethi, V. and John, W. (1993). Particle impaction patterns from a circular jet. Aerosol Sci. Technol. 18(1):1–10
- Zollmer et al. (2006) Zollmer, V., Muller, M., Renn, M., Busse, M., Wirth, I., Codlinski, D., Kardos, M. (2006). Printing with aerosols: A maskless deposition technique allows high definition printing of a variety of functional materials. Euro. Coating J. 07-08:46–55