The morphology and kinematics of neutral hydrogen in the vicinity of z=0 galaxies with Milky Way masses – a study with the Illustris simulation
Abstract
We analyze the properties of the circumgalactic gas (CGM) around 120 galaxies with stellar and dark matter halo masses similar to that of the Milky Way. We focus on the morphology and kinematics of the neutral hydrogen and how this depends on , the ratio of gas-to-stellar mass within the optical radius. In gas-rich galaxies with , gas temperatures rise slowly from center of the halo out to the virial radius and average neutral gas column densities remain above atoms cm-2 out to radii of 50-70 kpc. In gas-poor galaxies with , gas temperatures rise quickly outside the edge of the disk to K, and then remain fixed out to radii of 100 kpc. The column density of neutral gas quickly drops below atoms cm-2 at radii of 10 kpc. Neutral gas distributions are also more asymmetric in gas-poor galaxies. Most of the differences between gas-poor and gas-rich galaxies in the Illustris simulation can be attributed to the effects of “radio-mode” AGN feedback. In the Illustris simulation, the circumgalactic gas is found to rotate coherently about the center of the galaxy with a maximum rotational velocity of around 200 km/s. In gas-rich galaxies, the average coherence length of the rotating gas is 40 kpc, compared to 10 kpc in gas-poor galaxies. In the very most gas-rich systems, the CGM can rotate coherently over scales of 70-100 kpc. We discuss our results in the context of recent observations of the CGM in low mass galaxies via UV absorption-line spectroscopy and deep 21cm observations of edge-on spiral galaxies,
keywords:
galaxies:haloes; galaxies: formation; galaxies: structure ; galaxies: gas content1 Introduction
The accretion of gas onto galaxies from the external environment remains poorly understood. The main obstacle to making progress through direct observations is that data at a single frequency provides information on a very restricted range of gas densities and temperatures. In particular, the presence of a background radiation field of ultraviolet radiation produced by quasars and star-forming galaxies results in much of the hydrogen in the halos of galaxies being ionized and inaccessible to radio observations of 21cm emission from neutral hydrogen. The ionized gas component is most easily probed by absorption lines in the spectra of background quasars. The main limitation is that each quasar sightline provides a purely 1-dimensional view of the intervening gas and it is only possible to reconstruct the density profiles and the structure of the circumgalactic gas statistically by combining large numbers of quasar spectra that pass through the halos of many different galaxies (see Rudie et al 2012; Tumlinson et al 2013; Werk et al 2015; Borthakur et al 2015 for recent examples of studies of this kind).
In principle, cosmological hydrodynamical simulations provide a means of predicting how gas accretes onto galaxies. Early work emphasized a dichotomy between so-called “cold accretion” directed along filaments in dark matter halos with masses less than , and a quasi-spherical “hot mode” of accretion in more massive halos (Keres et al 2005). These results were later shown to be sensitive both to the numerical implementation used to solve the equations of hydrodynamics (Nelson et al. 2013), and to the implementation of feedback from supernova and active galactic nuclei (Nelson et al. 2015b). However, early generations of cosmological hydrodynamical simulations also generally failed to match basic observational quantities, including the stellar mass-to-halo mass relation for galaxies (Guo et al 2010) and the size distribution function of galaxies at fixed mass (Weil, Eke & Efstathiou 1998). Most simulations also failed to reproduce the relative fractions of star-forming and non-star-forming objects in the real Universe (e.g. Cattaneo et al 2007), and were thus unlikely to provide accurate predictions for the properties of the gas surrounding galaxies of different masses and types.
In the last year or two, the situation has changed quite dramatically. The Illustris (Vogelsberger et al 2014) and Eagle (Schaye et al 2015) simulation projects have published results from large (100 Mpc3) volume simulations with gas/dark matter mass resolutions of a few , which contain many hundreds of galaxies of Milky Way mass that are simulated with spatial resolutions of 0.7-1 kpc. The physical inputs, e.g. the supernovae feedback prescriptions, are tuned to reproduce observed quantities. In the Illustris simulations, for example, the model is tuned to match the present-day ratio of stars to dark matter (DM) for galaxies of all masses, and the total amount of star formation in the universe as a function of time. Other simulation projects, e.g. NIHAO (Wang et al 2015) and FIRE (Hopkins et al 2013), have concentrated on generating suites of cosmological zoom-in hydrodynamical simulations of haloes of different masses. Once again, the aim has been to reproduce the stellar mass versus halo mass and the star formation rate versus stellar mass relations using the same treatment of star formation and stellar feedback for every object.
These simulations are now starting to form the basis for studies of gas around galaxies as a function of cosmic epoch. One approach that has been popular is to use the simulations to generate mock quasar absorption line spectra for direct comparison with observations. This is done by averaging gas physical properties including the density, temperature, metallicity and velocity in physical coordinates along a sightline through the simulation box, and then using look-up tables calculated with a photo-ionization code to find the ionization fraction for a number of different ionic species (see for example Ford et al 2013). This methodology has now been implemented on the latest generation of simulations that reproduce stellar mass to dark matter mass ratios, and the mock spectra have been used to make comparisons with hydrogen and metal line absorption around both low-redshift (Suresh et al 2015a; Oppenheimer et al 2016) and high redshift (Shen et al 2013; Bird et al 2014; Rahmati et al 2014; Faucher-Giguère et al 2015; Suresh et al 2015b) galaxies. Most of these analyses have focused either on comparisons of the radial dependence of Ly and metal absorption line equivalent widths, or on the covering fraction of neutral hydrogen and metals, defined as the fraction of sightlines where intervening neutral hydrogen or metals are detected in the spectrum.
At high redshifts, some of the simulations have had trouble explaining the large observed covering fractions of neutral hydrogen at impact parameters comparable to the virial radius of the galaxy (Faucher-Giguère et al 2015; Suresh et al 2015a), while others apparently produce better agreement with the data (Rahmati et al 2015). Also of interest are trends in CGM properties as a function of galaxy mass and type. In very recent work, Suresh et al (2015b) examine whether the simulations are able to explain trends in OVI properties as functions of galaxy mass and star formation rate at low redshifts using the Illustris simulations. The mass, temperature and metallicity of the CGM were found to increase with stellar mass, driving an increase in the OVI column density profile, which is not seen in observations. More recently, Oppenheimer et al (2016) have performed a similar study with the EAGLE simulations and find that gas temperatures are high enough in group haloes to suppress the OVI column density, leading to better agreement with the data. Taken together, these studies illustrate the diagnostic power of Ly and metal absorption line analyses around galaxies.
In this paper, we take a somewhat different approach and concentrate on the predicted temperature and density structure, morphology and kinematics of the circumgalactic gas in the Illustris simulations. The morphology of the gas has been probed to a limited extent in absorption line studies by studying trends in Ly equivalent width as a function of orientation with respect to the stellar disk (Borthakur et al 2015), while the velocity spread of the gas measured from the distribution of velocity offsets of the centroid of the primary Ly component from the systemic velocity has been proposed as a test of neutral gas kinematics (Rudie et al 2012; Liang & Chen 2014; Borthakur et al 2015). These probes are crude, because they are derived by combining sightlines around multiple galaxies and cannot, for example, probe whether the CGM is co-rotating with the stellar disk or not. As we will discuss, direct imaging of low column density neutral and ionized gas (e.g. Kamphuis et al 2013; Zschaechner, Rand & Walterbos 2015) may provide additional direct tests of simulation predictions.
Our paper is organized as follows. In section 2, we briefly summarize pertinent details of the Illustris simulations and describe our analysis strategy. In section 3, we present our results and in section 4, we discuss these results in light of recent and future observational constraints.
2 Simulations and Analysis
2.1 Simulation details
The Illustris simulations are run using the AREPO code (Springel 2010), a finite volume scheme implemented on a moving mesh, which follows the gas flow in a quasi-Langragian fashion. As a result, AREPO retains the principal strengths of SPH including its adaptivity to a large dynamic range in spatial scales, Galilean invariance, and an accurate and efficient gravity solver. It also gains the strengths of finite volume codes, including the improved treatment of fluid instabilities, weak shocks which can be missed in SPH, phase interfaces and shearing flows.
We make use of data from the Illustris-1 simulations, whose properties are summarized in Table 1 of Nelson et al (2015a). This is the largest and highest resolution of the publicly released simulations with a volume of 106.5 Mpc3, dark matter and gas particle masses of and , and dark matter and gas gravitational softening lengths of 1.4 and 0.7 kpc. The reader is referred to Vogelsberger et al. (2013) for details on the behavior, implementation, parameter selection, and validation of the physical models implemented in these simulations.
Of particular interest for results on the distribution and kinematics of neutral hydrogen in galaxy halos presented in this paper is the implementation of primordial and metal-line radiative cooling in the presence of a redshift-dependent, spatially uniform, ionizing UV background field, with self-shielding corrections, and the implementation of galactic-scale outflows from supernovae and feedback from AGN in both quasar and radio (bubble) modes. In brief:
Gas cooling. The code includes a self-consistent calculation of the primordial cooling following Katz et al. (1996), on top of which the cooling contribution of metals is added in a simplified way by assuming that the cooling rate scales linearly with the total metallicity of the gas. Photoionization rates from quasars and star-forming galaxies, which affect abundances and inject energy into the gas, are calculated based on the models of Faucher-Giguère et al. (2009). In practice, the cooling rates are evaluated from tabulated CLOUDY models which include as input gas temperature, density, metallicity, and the UV-background.
This treatment of gas cooling and heating is valid under the assumption that gas is optically thin to the ambient UV radiation and will break down at gas densities greater than cm-3, above which the gas absorbs radiation and the attenuated radiation field affects the balance between cooling and heating compared to the optically thin case. In Illustris, a “self-shielding” correction whereby the ionization and heating rates entering into the primordial network calculation are suppressed. The supression factors are based on the results of full radiative transfer calculations carried out by Rahmati et al (2013).
Supernova feedback. The implementation of supernova feedback is very similar to the scheme described in Springel & Hernquist (2003) and operates by probabilistically turning a star-forming ISM gas cell into a wind particle. The probability depends on the instantaneous SFR of each gas cell, which is derived from the local gas density. This particle is then allowed to travel, decoupled from hydrodynamical forces, until it reaches a certain density threshold or a maximum travel time has elapsed, whereupon the particle disappears and its mass, momentum, thermal energy and all tracked metals are deposited into the gas cell in which it is located. The wind velocity and the mass loading of the particles are free parameters and in the fiducial Illustris model, the wind particle is kicked perpendicular to the angular momentum vector of the parent subhalo of the galaxy (corresponding to a bipolar wind).
AGN feedback Two modes of AGN feedback are implemented. When the central black hole accretes at rates higher than about 5% of the Eddington rate, the so-called “quasar mode” (Springel et al 2005) is implemented by assuming that a fraction of the radiative energy released by the accreted gas couples thermally to nearby gas within a radius that contains some fixed amount of mass. When the quasar mode is switched on, Illustris also accounts for the effect of the AGN radiation field on the cooling of the gas.
This paper is concerned with CGM properties in low redshift galaxies, where the vast majority of black holes accrete at rates of only a few percent of the Eddington rate. For these low-activity states of the black hole, a form of mechanical radio-mode AGN feedback following Sijacki et al. (2007) is implemented. Bubbles of hot gas with radius 50 kpc, total energy erg and volume density kpc-3 are placed into the halo at distances of 100 kpc from their centers. The radio-mode feedback efficiency provided by the bubbles is assumed to be a fixed fraction of the rest mass energy of the gas accreted by the black hole.
2.2 Analysis
The analysis in this paper focuses on galaxies with masses comparable to those of the Milky Way, i.e. galaxies with stellar masses (calculated within twice the stellar half mass radius) in the range residing in subhalos with dark matter masses in the range . The CGM of these galaxies is well-resolved in Illustris-1, with around 160,000 dark matter particles, 15,000-30,000 gas cells and 80,000-100,000 star particles contained within the virial radius of the subhalo. Out of the 253 galaxies in this stellar mass range, we select 120 galaxies at z=0 (snapshot number 135) such that they equally populate 4 bins in gas mass fraction, , where is again evaluated within twice the stellar half mass radius. The four bins in are 0.01-0.03, 0.03-0.1, 0.1-0.3 and 0.3-1. This is the maximal sample such that the equal number per bin criterion is satisfied. Note that we do not implement any prescription for the fraction of gas in molecular form, so the parameter should be a close approximation to the total cold gas mass fraction interior to the optical radius of the galaxy.
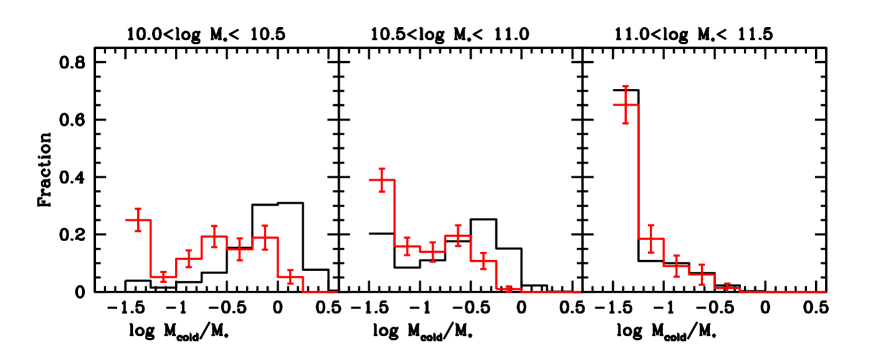
In Figure 1, we show distributions of the total cold gas mass fraction of galaxies in three different bins of stellar mass. Solid black histograms show results from Illustris, while red histograms show results from the COLD GASS survey (Saintonge et al 2011), which obtained atomic and molecular gas masses for a sample of 350 representative nearby galaxies with stellar masses in the range . The central panel correpsonds to galaxies with stellar masses comparable to that of the Milky Way. We see that the dynamic range in gas fraction spanned by Illustris is larger than in the data; there are too few very gas-poor galaxies of Milky Way mass and too many very gas-rich galaxies. The median gas fractions of the simulated and observed data sets agree quite well, however, and are close to the observed value for the Milky Way ().
We work with the “cutouts” provided by the Illustris data base, that include all the dark matter, gas, star, wind and black hole information for both subhalos and the parent friends-of-friends halo for each galaxy. Unless indicated otherwise, the plots in section 3 are generated from the subhalo cutouts. We have excluded galaxies in clusters and massive groups from our analysis, so in the majority of cases the majority of the particles in the parent halo are bound to the subhalo of the central galaxy.
We implement an algorithm to find the two-dimensional projection of the stellar mass distribution tion with the least scatter about the major axis and we call this the best edge-on projection. We begin by locating the centre-of-mass of the stellar distribution and translating the positions of all the particles so that the coordinate (0,0,0) is located at this position. We then proceed to find the best edge-on projection of the stellar distribution. This is done by projecting the cube along the x,y and z axes in turn, performing a linear fit to the stellar mass distribution for each 2-dimensional “sky” projection. The linear fit with the minimum scatter defines the x-axis of our new, chosen projection. This procedure makes sure we start with a galaxy with a well-defined major axis when viewed in two dimensions. The linear fit is carried out using standard least-squares regression, treating each grid cell above a given projected stellar mass density threshold as a separate data point. 111We adopt as our threshold, but find that the outcome is insensitive to this exact choice. The stellar distribution is then rotated around the new x-axis, until the scatter of the stellar distribution is minimized. This defines the best edge-on projection for the stars.
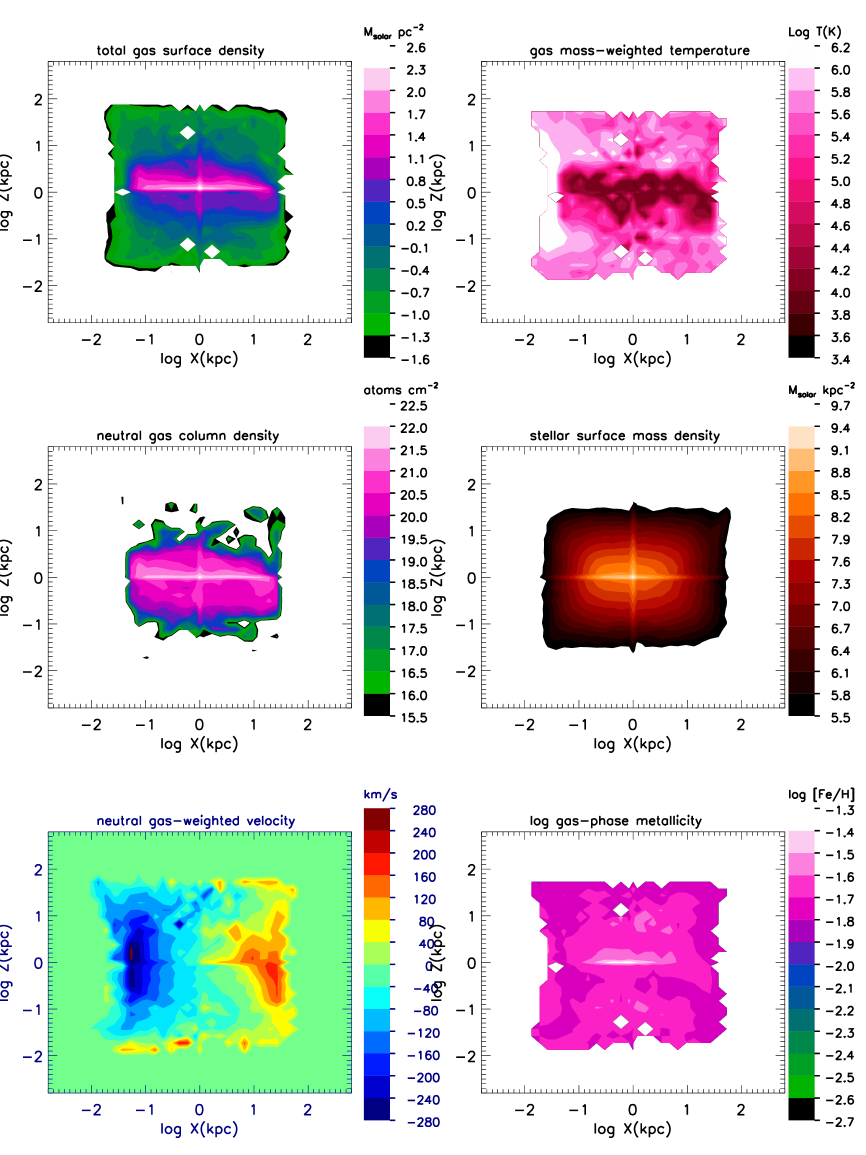
We then create two-dimensional binned maps of the projected density of stars and gas, as well as gas-mass and stellar-mass weighted metallicity and velocity maps. An example of such a map for a galaxy with gas mass fraction comparable to that of the Milky Way () is shown in Figure 2. The 2D binning in the x and y-directions is done in logarithmic units with a bin size of 0.15 in and . The contribution from gas and stars located at kpc is placed into the central bin, creating the spiky pattern seen in the stellar surface density map. This spiky feature may look somewhat artificial, but recall that the spatial resolution of the Illustris-1 simulation is kpc, and making projected density plots in logarithmic units has the advantage of allowing us to visualize a wide range of spatial scales in a single diagram.
From top-to-bottom in the left-hand column, we show total gas density, neutral gas column density and neutral gas-weighted velocity maps. In the right-hand column, we show two-dimensional maps of gas-mass weighted temperature, stellar surface mass density and gas-phase metallicity. The neutral hydrogen fractions and gas temperatures for each cell are read directly from the simulation outputs. In particular, each gas cell contains the fraction of its hydrogen mass which is neutral (the NeutralHydrogenAbundance field), and multiplying this value by the cell mass times X=0.75 gives an estimate of the total neutral hydrogen mass. In the Illustris simulation itself, this field is calculated through an iterative solution to the primordial hydrogen and helium network of Katz,Weinberg, & Hernquist (1996) combined with the metal line radiative cooling processes, AGN radiative feedback model and UVB heating as described in Vogelsberger et al. (2013) including the self-shielding prescription following Rahmati et al. (2013). For dense starforming gas, this calculation uses the effective temperature from the equation of state ISM model of Springel & Hernquist (2003), which would require further refinement for detailed analysis in this density regime. No model for the formation of molecular hydrogen has been included, so the column density estimates will be over-estimated for the very central regions with atoms cm. This complication should have negligible impact in the present work as we do not consider in detail HI in dense disk environments but instead focus on larger scales.
In the particular galaxy shown in Figure 2, the stars and the gas are well aligned, and distributed in a plane with both stellar and gas surface densities that fall off very steeply as a function of perpendicular distance from the disk beyond a scale heights greater than a few kpc. Gas with temperatures less than K is also aligned with the disk extending in patches to scale heights of 2-3 kpc. The gas-phase metallicity in this galaxy is high: twice solar in the vicinity of the disk, dropping to a half solar at at a distance of 10 kpc above the plane. Even though the neutral gas column density drops steeply at scale heights greater than a few kpc, the bottom left panel shows that the low density gas is co-rotating with the thin disk out to scale heights in excess of 10 kpc.
In the next section, we will define a series of metrics for quantifying the properties of these 2-dimensional gas maps, and we will study how these metrics depend on the quantity .
3 Results
3.1 Radial distributions
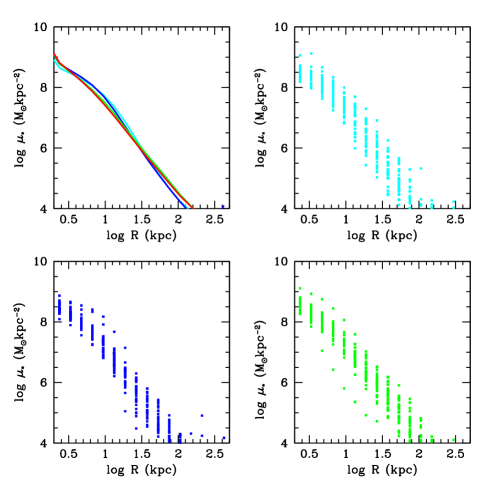
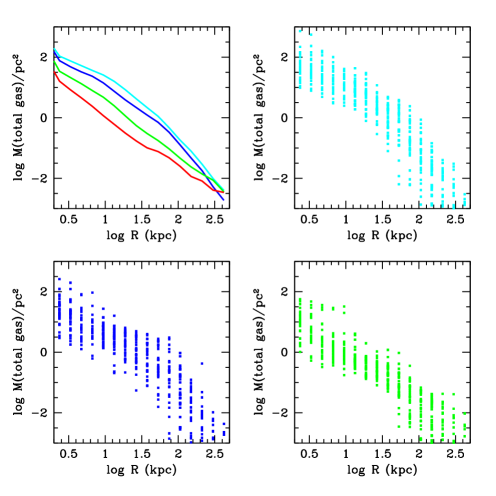
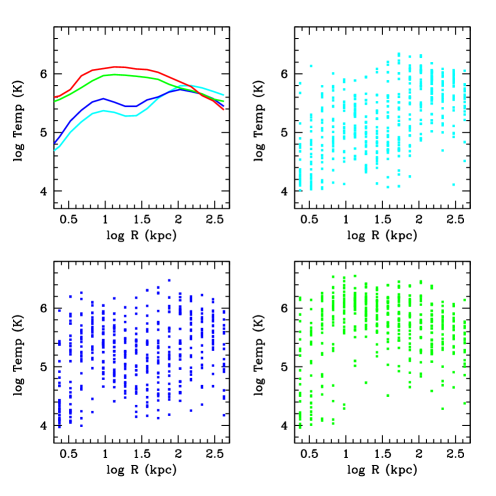
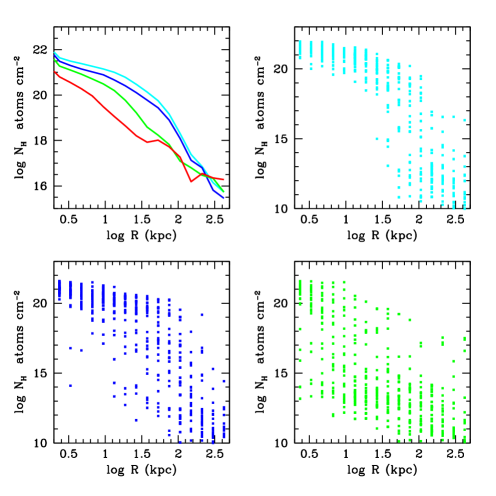
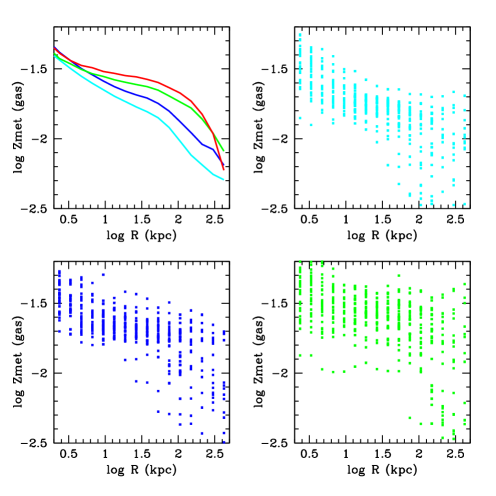
We begin by plotting radial distributions of stellar surface mass density, total gas density, gas mass weighted temperature, neutral gas density and gas mass weighted metallicity is Figures 3-7. In each of these figures, average radial profiles are plotted in the top left panel. Cyan, blue, green and red curves show results for galaxies with gas mass fractions in the range 0.3-1, 0.1-0.3, 0.03-0.1 and 0.01-0.03, respectively. In the next three panels, individual, radially-averaged data points are plotted for each of the 30 galaxies in each of the gas fraction sub-samples (results are not shown for the lowest gas fraction sub-sample with .) These panels allow us to assess the amount of scatter from one galaxy to another for a given radial bin.
The samples have been constructed to contain galaxies in narrow range in stellar mass but with widely different gas mass fraction values evaluated within twice the optical radius, so it is no surprise that the radial stellar surface density profiles are the same for all bins in in Figure 3, but that the central gas surface densities scale strongly with in Figure 4. What is more interesting, is that the differences in total gas surface density as a function of persist out to radii of 200-300 kpc, i.e. out to the virial radius of the subhalo. This means that galaxies with more gas are located in dark matter halos with more gas. Figure 4 also shows that the galaxy-to-galaxy scatter in total gas surface density is a factor of two or more larger than the scatter in stellar surface mass density at all radii.
Figure 5 shows that the average temperature profile of the halo gas depends strongly on . In halos hosting galaxies with low gas fractions, the average temperature remains relatively constant at K all the way from 10 kpc to 100 kpc. Only at radii less than 10 kpc, does the average gas temperature drop by a factor of 2-3. In contrast, in halos hosting galaxies with high gas mass fractions, the average gas temperature drops montonically by a factor of 10 from radii of 100 kpc to the center. It should be noted, however, that there is very large (factor 10-30) galaxy-to-galaxy scatter in the temperature profiles at all radii and for all of the sub-samples.
The rise in gas temperature towards the outer regions of halos means that the neutral hydrogen column density exhibits a stronger radial dependence than the total gas surface density (6 orders of magnitude drop from R=0 to 100 kpc in compared to 4 orders of magnitude drop in total gas surface density). In addition, the large scatter in gas temperature induces a corresponding large scatter in . Nevertheless, in Figure 6, clear trends are seen in radial neutral hydrogen column density distributions as a function of at radial distances less than 100 kpc, where the fraction galaxies that are surrounded by high neutral column density gas ( atoms cm-2) is a strong function of . We will come back to this point in the next section, where we discuss how our results compare with recent observational findings.
Finally, Figure 7 shows gas phase metallicity trends as a function of radius for the different sub-samples. The gas-phase metallicity is lower for galaxies with higher gas mass fractions and the strength of the effect increases strongly with radius out to the virial radius of the subhalo. At R=200 kpc, there is a factor of 3 difference in metallicity between galaxies with gas fractions comparable to that of the Milky Way and galaxies in the most gas-rich subsample with .
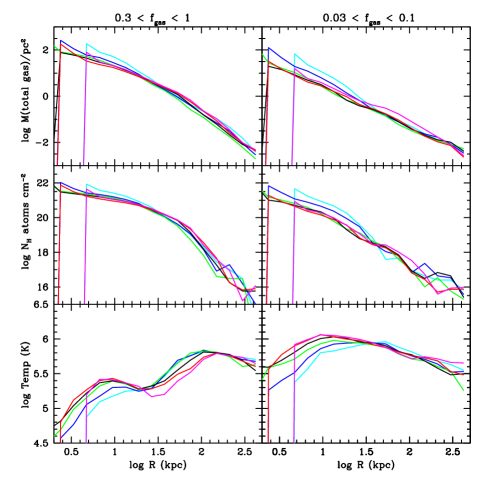
3.2 Dependence of radial profiles on orientation
We now explore the extent to which the radial profiles discussed in the previous subsection depend on orientation with respect to the stellar major axis of the galaxy. We compute radial profiles in 6 bins in angle : 0-15, 15-30, 30-45, 45-60, 60-75 and 75-90 degrees (colour-coded cyan, blue, green, black, red, magenta in Figure 8). Results are shown for galaxies in the two low gas mass fraction subsamples in the left-hand column, and for the two high gas mass fraction subsamples in the right-hand column. The results show that gas surface densities show enhancements at angles less than 30 degrees with respect to the major axis of the disk at radial distances less than 30 kpc. The effects are significantly stronger in galaxies with low gas mass fractions compared to galaxies with high gas mass fractions. Later on we will show that this is because high column density gas is located in a thickened, rotating structure in these systems.
Gas temperature profiles also show orientation effects. At radial distances less than 30 kpc, we see the expected effect that gas temperatures are lower along the disk than perpendicular to the disk. No orientation dependence in temperature is seen at radii greater than 30 kpc for galaxies with low gas mass fractions. However, an interesting trend is seen for gas to be hotter in the plane of the disk at radii between 30 and 100 kpc in the high gas mass fraction galaxies. Stellar winds have preferred outflow directions perpendicular to the star-forming gas disk, so the result cannot be explained this way. We hypothesize instead that the higher temperatures in the plane of the disk may be the consequence of shock-heating of gas as it falls onto the outer disk. This shock-heating may also be responsible for the “double-humped” form of the gas temperature profiles seen in both Figure 5 and in Figure 8. In follow-up work, we plan to check this hypothesis in detail by following the trajectories, temperature and star formation histories of gas in the halo using tracer particles (Genel et al 2013).
3.3 Probes of asymmetry
In this section, we investigate whether gas-rich and gas-poor galaxies differ in the asymmetry of their circumgalactic gas distributions. We study asymmetries by comparing gas distributions above and below the galactic plane, as well as to the right and to the left of the minor axis of the galaxy in its edge-on projection.
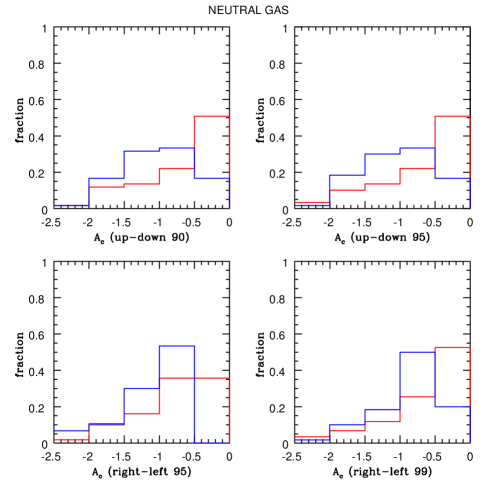
We begin by computing radii along the major axis and enclosing 90%, 95% and 99% of the in-plane projected stellar mass, defined as the total stellar mass enclosed within the radii -1 kpc y 1 kpc. Material with is said to be associated with the inner disk; material with is said to be associated with the outer disk , while material with is said to be associated with the far outer disk .
We define the asymmetry indices Ac (up-down 90), Ac (up-down 95), Ac (up-down 99), Ac (right-left 95) and Ac (right-left 99), where “up-down” means above and below the galactic place , “right-left” means on either side of the disk minor axis, and 90, 95, 99 refer to inner, outer and far outer disk, respectively. To compute the indices, we integrate up the total gas columns from a scale heights of 2kpc above/below the plane out to a distance of 200 kpc, and compute (for example) Ac (up-down 90) as , i.e. the index is expressed in terms of the logarithm of the fractional difference in total gas mass above and below the central disk. The other 4 indices are defined in similar fashion. 222We looked into the effect of changing the 200 kpc upper bound and found that the main conclusions presented in this section remain unchanged.
Figure 9 shows distributions of 4 of these indices for the neutral gas distribution. Results are shown for gas-rich galaxies with (blue histograms) and for gas-poor galaxies with (red histograms). As can be seen, the asymmetries are always larger for the gas-poor galaxies. Half of all gas-poor galaxies have fractional asymmetries above and below the plane greater than 0.3, compared to 16% of the gas-rich galaxies.
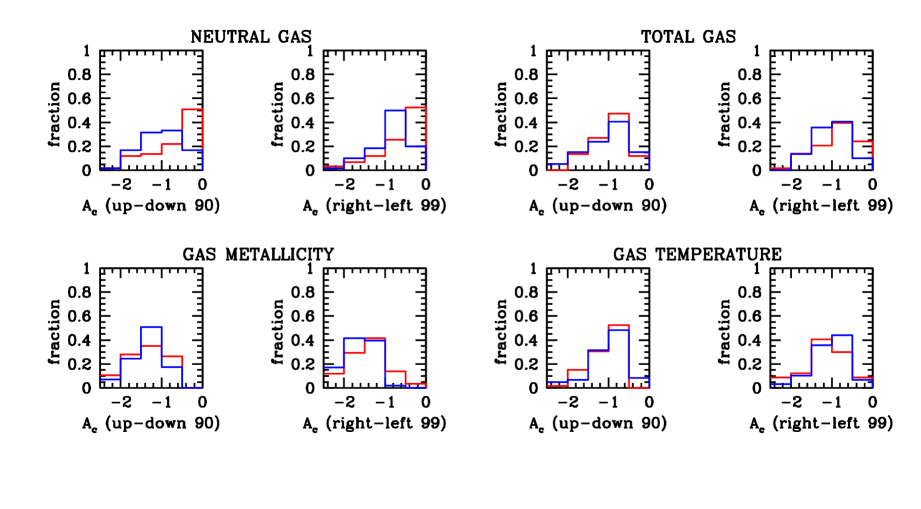
In Figure 10, we plot a restricted set of asymmetry indices for a variety of different quantities, including total gas, gas metallicity and gas temperature. As can be seen, the neutral gas has the largest asymmetry values and the gas metallicity the smallest. Differences between gas-rich and gas-poor subsamples are only significant for the neutral gas. In gas-poor galaxies, the fraction of galaxies with neutral hydrogen asymmetry parameters close to zero, indicating very large differences in neutral hydrogen mass on either side of the disk plane, reaches 50%. This is not seen for the total gas asymmtery parameter distribution, nor for any other quantity. As we will show in section 3.5 , there is significantly greater injection of energy into the CGM by radio bubble feedback in the gas-poor subsample. The injection of bubbles of hot gas introduces irregularities in the neutral gas distribution, resulting in higher asymmetry indices for that quantity, but does not greatly affect the total gas distribution.
3.4 Kinematic misalignments between gas and stars and coherent rotation of the CGM
The neutral-hydrogen weighted velocity maps the galaxies in Illustris show clear signatures of rotation for all but the most gas poor galaxies when viewed in the edge-on projection. Figure 2 shows a case where the velocity minimum and maximum are well-aligned with the major axis of the stellar disk, but there are many cases where the gas disk is clearly misaligned with respect to the stellar disk. We quantify these misalignments by locating the velocity minimum and maximum in the (x,y) plane and measuring the angles and with respect to the major axis of the galaxy viewed edge-on.
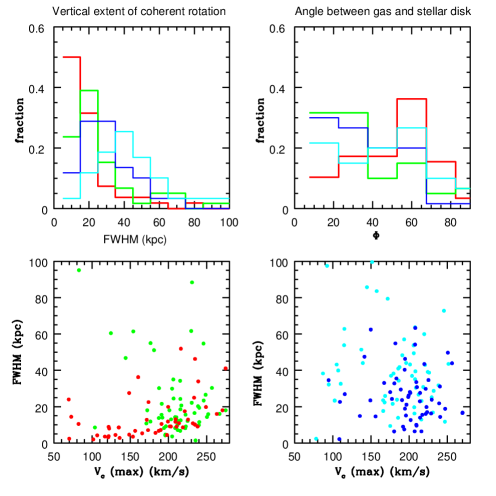
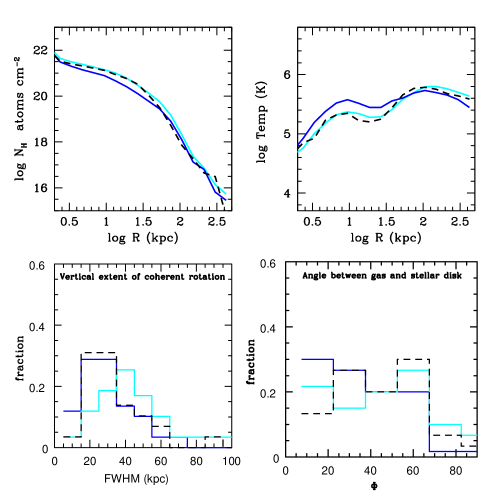
We plot distributions of misalignment angle (measurements of both and 2 are included) in the top right panel of Figure 11. Cyan, blue, green and red histograms are for the four sub-samples with different gas mass fractions. The distribution of misalignment angles is surprisingly broad in Illustris. Only in galaxies with intermediate gas mass fractions ( = 0.03-0.3) is the the gas disk aligned with the stellar disk to better than 30 degrees in the majority of cases. The most extreme misaligments are found in the most gas-poor galaxies. One possible explanation for these results is that AGN feedback processes are stirring up the gas in gas-poor objects and accretion is bringing in new gas, misaligned with the older stellar disk in gas-rich galaxies.
We also measure the full width half maximum (FWHM) of the vertical coherence length of the rotation by centering at and and finding the distance y over which the velocity is greater than half its minimum/maximum value. This procedure will underestimate the true coherence length if the gas is very misaligned with the stars, but it nevertheless provides a first-order measure than can be compared between our different sub-samples.
The distribution of FWHM vertical extent of coherent rotation is shown in the top left panel of Figure 11 and is a very strong function of the : gas-poor galaxies have a median rotational coherence length of 10 kpc and this increases by a factor of 4 to 40 kpc in the most gas-rich subsample. The most extreme objects in the gas-rich subsample have gas that is coherently rotating over scales of 70-100 kpc! The distribution of mis-alignment angles is surprisingly broad in Illustris. Only in galaxies with intermediate gas mass fractions () is the the gas disk aligned with the stellar disk to better than 30 degrees in the majority of cases. The most extreme mis-aligments are found in the most gas-poor galaxies.
In the bottom two panels in Figure 11, we plot the FWHM vertical extent of coherent rotation as a function of the maximum circular velocity of the gas. Gas-poor systems with are plotted in the bottom-left panel and gas-rich systems with are plotted in the bottom-right panel. In the gas-poor galaxies, the coherent extent of the rotation is generally larger for galaxies with larger , but no correlation is apparent for gas-rich galaxies. This may indicate that the gas has not yet settled into full rotationally-supported equilibrium in the gas-rich systems, as might be expected if the gas is in the process of accreting onto the disk. This will be explored in detail in future work.
3.5 Black holes, radio bubble feedback and gas content
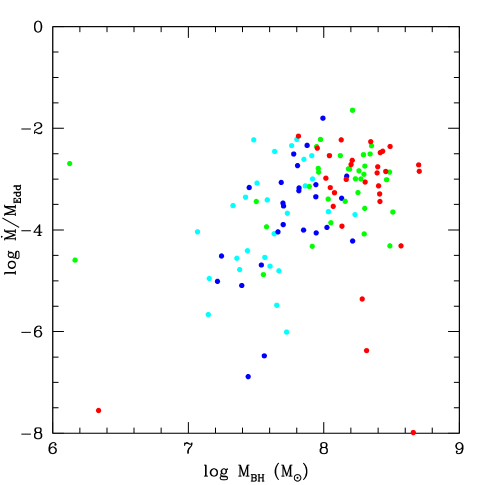
In Figure 12, we show the locations of all the Milky Way mass galaxies in our study in the plane of black hole mass versus black hole accretion rate in Eddington units. The gas-poor () systems are plotted in red and the gas-rich () systems are plotted in blue. One immediately apparent problem is that the median black hole mass of the galaxies in our sample is , i.e. a factor 24 more massive than the black hole in our own Galaxy. All but 3 of the galaxies in our sample have black holes that are a factor of 4 or more massive than the black hole in the Milky Way. 333The three black holes with masses of a few are all part of binary systems.
We find that the black holes in Milky Way mass galaxies in Illustris are all accreting at a few tenths of a percent of Eddington or less, and are thus in the regime where radio rather than quasar-mode feedback is occurring. Gas-poor galaxies have more massive black holes with higher accretion rates than gas-rich galaxies, suggesting that radio AGN feedback is controlling the rate of infall of fresh gas onto these systems.
The predicted CGM properties of the gas-poor galaxies in the Illustris simulation could be called into question if black hole growth and AGN feedback physics is not implemented correctly. The gas-rich Milky Way-type galaxies in our study have smaller black holes with lower accretion rates and one might hope that uncertainties the models for black hole growth and AGN feedback do not compromise our conclusions about the structure and kinematics of the CGM in such systems.
In order to check this hypothesis, we have extracted a set of 15 galaxies in Illustris that have no black holes, but high gas mass fractions (). In order to assemble such a sample, we are forced to decrease the cuts in stellar and halo mass by a factor of 3, i.e the majority of the 15 galaxies would not be included as part of our original selection. Nevertheless, they are useful for testing the degree to which our conclusions about the radial profiles and morphologies of neutral gas in very gas-rich galaxies are subject to uncertainties in the AGN feedback implementation. The top two panels of Figure 13 show neutral column density and temperature profiles for the gas-rich galaxies with no black holes (black dashed curves) compared to results for our two fiducial gas-rich samples. In the bottom two panels compare results on the vertical coherence length of rotation and the misalignment angle between gas and stars. As can be seen, all the results are fairly similar. The inner cold region of the disk and the vertical extent of the coherent rotation are somewhat smaller than in our fiducial samples, consistent with the fact that the systems with no black holes are found in lower mass halos.
3.6 Summary of simulation results
-
•
The radial distributions of total gas density, neutral gas density, gas temperature and metallicity vary strongly as a function of the interstellar medium gas mass fraction . In gas-rich galaxies with , gas temperatures rise and gas metallicities drop monotonically from the centre of the halo out to the virial radius. Average neutral gas column densities remain higher than atoms cm-2 all the way from the center of the galaxy out to radii of 50-70 kpc, before dropping sharply. In gas-poor galaxies with , gas temperatures remain fixed at K and gas metallicities are close to solar all the way from 10 kpc near the inner disk out to 100 kpc in the outer halo. The average column density of neutral gas begins to drop below atoms cm-2 at much smaller radii in gas-poor systems.
-
•
Gas radial profiles exhibit azimuthal variations at radii less than 30 kpc. These variations are stronger for gas-poor galaxies where the gas distribution is more concentrated along the disk major axis.
-
•
Gas-poor galaxies have more asymmetric neutral gas distributions than gas-rich galaxies.
-
•
The circumgalactic gas rotates coherently about the center of the galaxy with a maximum rotational velocity of around 200 km/s. In gas-rich galaxies, the average coherence length of the rotating gas is 40 kpc, compared to 10 kpc in gas-poor galaxies.
-
•
The gas disk is most often aligned with the stellar disk in galaxies with intermediate gas fractions of around .
-
•
Black hole masses and accretion rates are systematically higher in gas-poor galaxies than gas-rich galaxies of the same stellar and halo mass.
4 Discussion and comparison with observations
In this section, we discuss the extent to which our simulation results are consistent with observational results on the CGM in low redshift galaxies and present some ideas for future work.
Radial profiles of neutral gas. The best constraints on the radial profiles of the neutral gas in the vicinity of nearby galaxies come from QSO absorption line studies of gaseous halos using the Cosmic Origins Spectrograph (COS) on board the Hubble Space Telescope (Tumlinson et al 2013). In general, Ly absorption is detected for systems with neutral hydrogen column densities greater than atoms cm-2. Reasonably accurate estimates of are possible for damped (DLA) or nearly damped (subDLA) absorbers with atoms cm-2 by fitting to the Ly profiles. It is usually only possible to derive lower limits to the column density for systems with column densities in the range atoms cm-2. This means that two statistics characterizing the neutral hydrogen profiles are extractable from the data: 1) the average value of as a function of radius, since this is mostly set by the highest column density systems. 2) the so-called covering fraction, meaning the fraction of QSO sightlines where a Ly system with a column density greater than atoms cm-2 is detected.
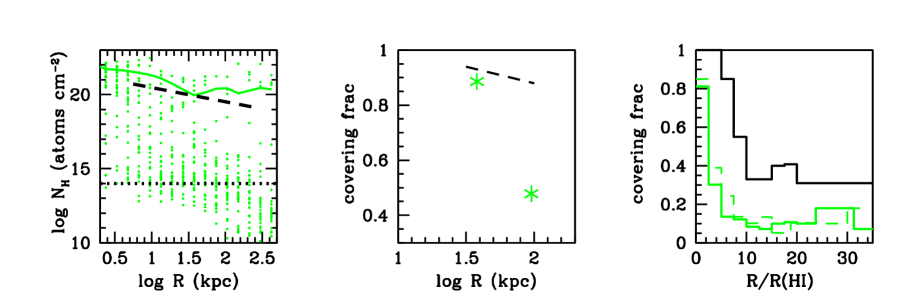
In the top left panel of Figure 14, we plot average neutral hydrogen column density as a function of radius for simulated galaxies with gas mass fractions comparable to that of the Milky Way as the solid green curve. Results for individual galaxies are shown as green points. We note that for this plot, is derived from the parent halo cutouts rather than the subhalo cutouts. This results in higher average column densities at large radius, because a minority of sightlines do intersect high column density gas that is not part of the subhalo. The dashed black curve shows observational results from Werk et al (2014). As can be seen, the radial run of the average neutral gas column density in the simulations agrees reasonably well with the observations.
Discrepancies with the data are, however, revealed when we compare the covering fraction at two different radii. In the middle panel of Figure 14, green stars indicate covering fractions of neutral hydrogen with atoms cm-2 derived from simulations, while the dashed black line again indicates results from the COS data. At radii of kpc, the covering fractions agree quite well, but at 100 kpc, the covering fraction of neutral gas in the simulation is a factor of two below the observations. We note that Borthakur et al (2015) compiled statistics for the velocity differences between each of their Ly systems and the central velocity of the 21cm line, and found that almost all systems had km/s. The maximum velocity difference was 400 km/s, indicating that the neutral gas is bound within the halo. The discrepancy between simulations and observations thus cannnot be explained by the fact that we do not include gas at very large velocity difference outside the virial radius of the parent halo.
The COS galaxies span a range of different stellar masses, specific star formation rates and gas mass fractions, so comparing with Milky Way-type galaxies in Illustris is not completely accurate. In a recent study, Borthakur et al (2015) explored the nature and properties of the circumgalactic medium and its connection to the atomic gas content in the interstellar medium as traced by the HI 21cm line. A strong correlation (99.8% confidence) was found between the gas fraction in the galaxy and Ly equivalent width seen in absorption in the associated quasar spectrum. In the right panel of figure of Figure 14, we plot the covering fraction of Ly absorption systems as a function of R/R(HI), where R(HI) is the HI radius. In the study of Borthakur et al, the HI radius is not directly measured, but is inferred from the total HI mass using the empirical relation of Swaters et al (2002): , which has been found to have very small (0.06 dex) scatter. The data from Figure 9 of Borthakur et al (2015) is plotted in black and results from the simulation in green. A strong drop in covering fraction as a function of R/R(HI) is seen in both observations and simulations, but the covering factors are a factor of 2 higher in the data in all but the central bin. The dashed green line shows what happens if we divide the cold gas masses in the simulation by a factor of 2 to account for the fact that the molecular gas can contribute up to half the total cold gas content of nearby spiral galaxies (Saintonge et al 2011). As can be seen, this does not alleviate the mismatch in covering fractions. This shows that the discrepancy between simulations and data is likely caused by inaccurate physical prescriptions for gas heating/cooling.
Azimuthal variations in neutral gas density. Borthakur et al (2015) also analyzed whether there was any dependence in the properties of the Ly absorbers in their sample on the orientation of the sightline with respect to the major axis of the galaxy, and found no effect. We note that their sample only includes 7 sightlines that are closer than 30 kpc from the center of the galaxy. We thus conclude that the simulation results are in general agreement with the data.
Extended ionized and neutral gas around edge-on galaxies. Studies of edge-on spiral galaxies show that extra-planar material in the form of diffuse ionized gas (e.g., Rand 1996; Rossa & Dettmar 2003) and HI (e.g., Swaters et al. 1997; Oosterloo et al. 2007) is ubiquitous. The galaxy NGC 891 is the standard “poster child” for extraplanar gas. Deep HI observations to a limiting HI column density of atoms cm-2 (Oosterloo et al 2007) reveal a HI halo containing almost 30% of the total neutral gas, which extends to a distance of more than 20 kpc from the galactic plane on one side of the galaxy. The halo exhibits regular differential rotation, at a slightly lower rate than the central disk. Analysis of optical longslit spectra of the halo of NGC 891 yields further insight into the physical state of the gas (Rand 1998). Values of [OI]/H indicate that hydrogen is 80-95% ionized (assuming a gas temperature of K). Analysis of the vertical dependence of the [NII]/H, [SII]/H, [OI]/H and [OIII]/H line ratios show that simple models where the halo gas is ionized by massive stars in the disk fail, and some secondary source of ionization must exist. More recently, two nearby, edge-on spiral galaxies NGC 3044 and NGC 4302 were observed with the VLA to comparable depths (Zschaechner, Rand & Walterbos 2015). Rotationally-supported neutral hydrogen was observed out to a distance of 15 kpc in both objects.
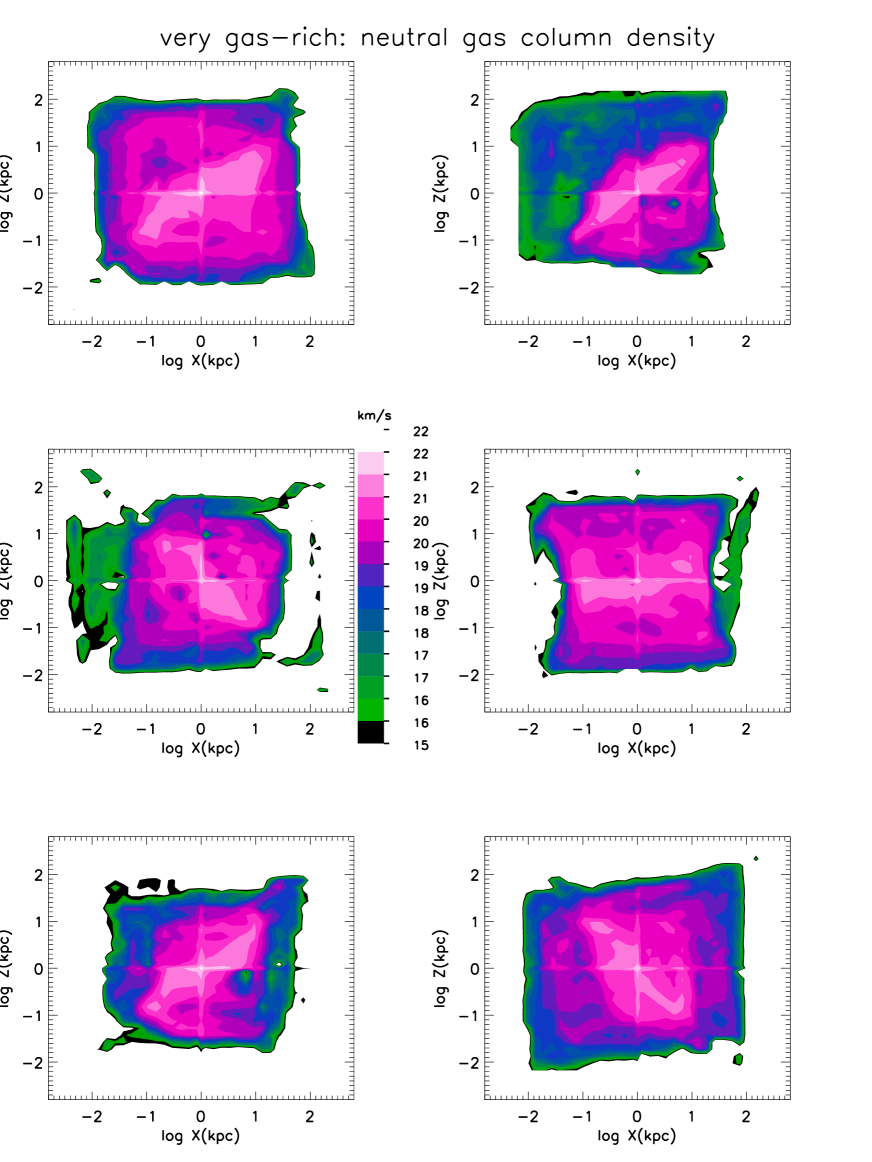
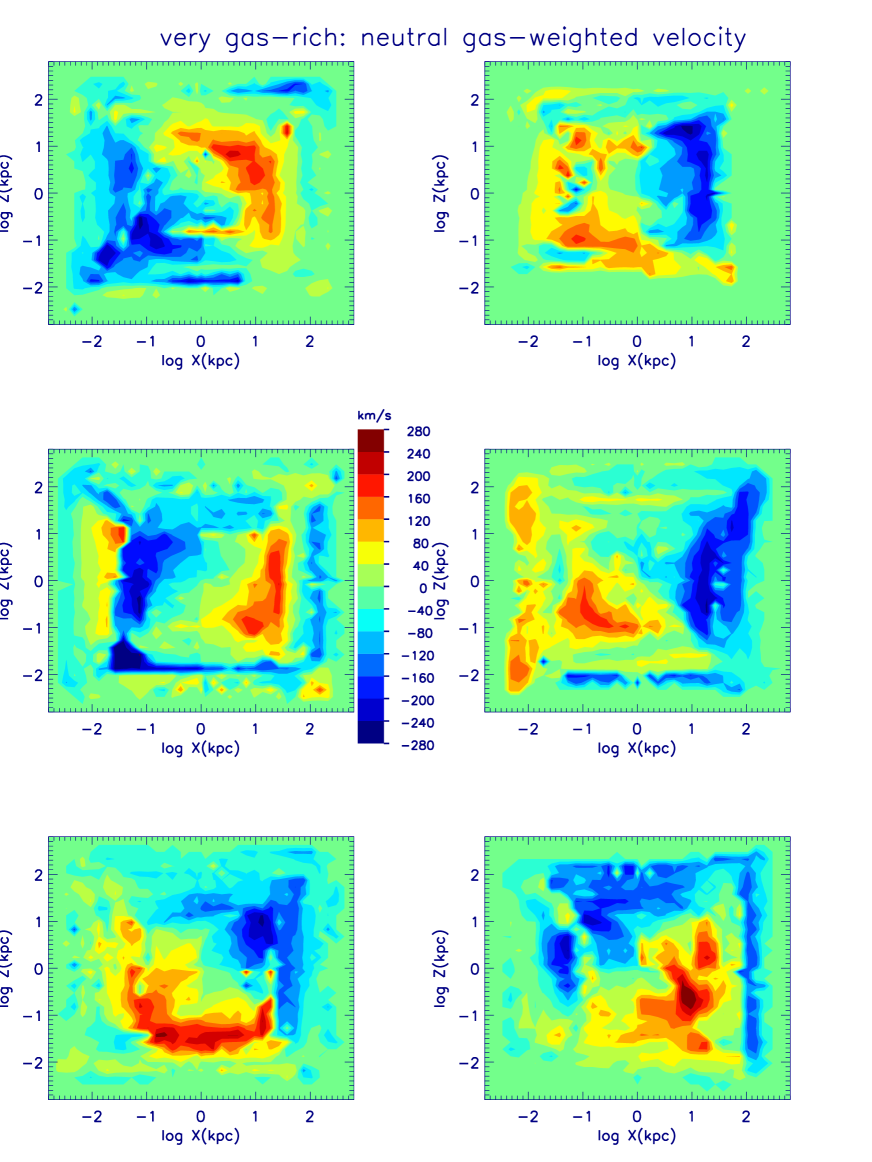
We thus conclude that the thick, rotating halos of neutral gas seen in the Illustris simulations are in general accord with observations of local edge-on galaxies. However, studies of systematic trends in these halos as a function of the neutral gas content of the ISM are still lacking. In Figure 15, we show a gallery of 6 neutral hydrogen maps of galaxies with high ISM gas mass fractions (). Neutral gas with column densities in excess of atoms cm-2, which would be detectable in deep HI observations, is coloured white and pink; gas with lower column densities is coloured blue, green and black. As can be seen, the prediction from Illustris is for HI halos extending out to 20-30 kpc from the galactic plane in all such systems, and for significant structure in the HI maps. Figure 16 shows corresponding neutral gas weighted velocity maps for these galaxies. There are clear signatures of rotation in all the maps, but the velocity fields are quite complex in some cases, indicating that the gas in these systems is likely to be evolving dynamically. This will be the subject of future work with gas tracer particles. Finally, we note that further modelling of the observed signatures of the ionized gas in Illustris is also required to make contact with the optical spectroscopic data.
Role of heating by radio bubble mode feedback. We have shown that gas-poor galaxies in the Illustris simulation have larger black holes that are accreting at a higher rate and returning more energy to the surrounding gas in the form of radio bubbles than gas-rich galaxies of the same stellar mass. This would imply that the main factor that determines gas accretion rates onto Milky Way type galaxies at the present day is the energy output from its supermassive black hole. Does this paradigm have any observational support? In 2010, the Fermi Bubbles, clouds of energetic particles towering 10 kpc above the plane of the Milky Way were discovered by the Fermi Gamma-Ray Telescope (Su, Slayter & Finkbeiner 2010). The Fermi Bubbles were subsequently probed using ultraviolet absorption line spectroscopy by targeting quasars with sightlines passing through a clear biconical structure seen in hard X-ray and gamma-ray emission near the base of the northern Fermi Bubble (Fox et al 2015). High velocity metallicty absorption components were detected, supporting a picture where the bubbles result from a biconical outflow emanating from the Galactic Center. If correct, this would imply that the Milky Way’s black hole experienced an outburst 2.5-4 Myr in the past that has resulted in significant heating of the surrounding gas. In the Illustris simulations, the radio bubbles are not launched from the black hole, but are placed at large radii ( 100 kpc) from the center of the halo. The greatest heating then occurs close to the virial radius of the subhalo, which may result in neutral hydrogen covering fractions at large radii that are too low to match observations.
We conclude, therefore, that there are indications that the Illustris simulations are producing predictions for the CGM that are in qualitative agreement with observations, but that significant challenges remain in matching observations quantitatively. This study has focused on galaxies in a narrow range in stellar mass, and by extension dark matter halo mass. Properties of halo gas such as temperature are expected to depend strongly on mass and this will result in observational signatures such as line emission changing between low mass and high mass galaxies. Constraints from large IFU surveys of extra-planar gas in nearby galaxies (Jones et al, in preparation) should provide important new constraints in the near future.
Finally, our analysis of the CGM in the vicinity of Milky Way type galaxies has yielded a picture of a relatively smooth gaseous halo that is co-rotating with the central disk. It may be that when we examine the CGM over a wider range in both redshift and stellar mass, that we will find physical regimes where the morphology and kinematics of the CGM is quite different. It will also be interesting to see how and if the conclusions presented in this paper depend on hydrodynamics methodology and implementation of supernova and/or AGN feedback.
Acknowledgments
We thank Chris McKee for helpful discussions.
References
- Bird et al. (2014) Bird S., Vogelsberger M., Haehnelt M., Sijacki D., Genel S., Torrey P., Springel V., Hernquist L., 2014, MNRAS, 445, 2313
- Borthakur et al. (2015) Borthakur S., et al., 2015, ApJ, 813, 46
- Cattaneo et al. (2007) Cattaneo A., et al., 2007, MNRAS, 377, 63
- Faucher-Giguère et al. (2009) Faucher-Giguère C.-A., Lidz A., Zaldarriaga M., Hernquist L., 2009, ApJ, 703, 1416
- Faucher-Giguère et al. (2015) Faucher-Giguère C.-A., Hopkins P. F., Kereš D., Muratov A. L., Quataert E., Murray N., 2015, MNRAS, 449, 987
- Ford et al. (2013) Ford A. B., Oppenheimer B. D., Davé R., Katz N., Kollmeier J. A., Weinberg D. H., 2013, MNRAS, 432, 89
- Fox et al. (2015) Fox A. J., et al., 2015, ApJ, 799, L7
- Genel et al. (2013) Genel S., Vogelsberger M., Nelson D., Sijacki D., Springel V., Hernquist L., 2013, MNRAS, 435, 1426
- Guo et al. (2010) Guo Q., White S., Li C., Boylan-Kolchin M., 2010, MNRAS, 404, 1111
- Hopkins et al. (2014) Hopkins P. F., Kereš D., Oñorbe J., Faucher-Giguère C.-A., Quataert E., Murray N., Bullock J. S., 2014, MNRAS, 445, 581
- Kamphuis et al. (2013) Kamphuis P., et al., 2013, MNRAS, 434, 2069
- Katz, Weinberg, & Hernquist (1996) Katz N., Weinberg D. H., Hernquist L., 1996, ApJS, 105, 19
- Kereš et al. (2005) Kereš D., Katz N., Weinberg D. H., Davé R., 2005, MNRAS, 363, 2
- Liang & Chen (2014) Liang C. J., Chen H.-W., 2014, MNRAS, 445, 2061
- Nelson et al. (2013) Nelson D., Vogelsberger M., Genel S., Sijacki D., Kereš D., Springel V., Hernquist L., 2013, MNRAS, 429, 3353
- Nelson et al. (2015) Nelson D., Genel S., Vogelsberger M., Springel V., Sijacki D., Torrey P., Hernquist L., 2015a, MNRAS, 448, 59
- Nelson et al. (2015) Nelson D., Genel S., Pillepich A., Vogelsberger M., Springel V., Hernquist L., 2015b, arXiv, arXiv:1503.02665
- Oosterloo et al. (2007) Oosterloo T. A., Morganti R., Sadler E. M., van der Hulst T., Serra P., 2007, A&A, 465, 787
- Oppenheimer et al. (2016) Oppenheimer B. D., et al., 2016, MNRAS, 460, 2157
- Rahmati et al. (2013) Rahmati A., Schaye J., Pawlik A. H., Raičevic M., 2013, MNRAS, 431, 2261
- Rahmati & Schaye (2014) Rahmati A., Schaye J., 2014, MNRAS, 438, 529
- Rahmati et al. (2015) Rahmati A., Schaye J., Bower R. G., Crain R. A., Furlong M., Schaller M., Theuns T., 2015, MNRAS, 452, 2034
- Rand (1996) Rand R. J., 1996, ApJ, 462, 712
- Rossa & Dettmar (2003) Rossa J., Dettmar R.-J., 2003, A&A, 406, 493
- Rudie et al. (2012) Rudie G. C., et al., 2012, ApJ, 750, 67
- Saintonge et al. (2011) Saintonge A., et al., 2011, MNRAS, 415, 32
- Schaye et al. (2015) Schaye J., et al., 2015, MNRAS, 446, 521
- Shen et al. (2013) Shen S., Madau P., Guedes J., Mayer L., Prochaska J. X., Wadsley J., 2013, ApJ, 765, 89
- Sijacki et al. (2007) Sijacki D., Springel V., Di Matteo T., Hernquist L., 2007, MNRAS, 380, 877
- Springel & Hernquist (2003) Springel V., Hernquist L., 2003, MNRAS, 339, 289
- Springel, Di Matteo, & Hernquist (2005) Springel V., Di Matteo T., Hernquist L., 2005, MNRAS, 361, 776
- Springel (2010) Springel V., 2010, MNRAS, 401, 791
- Su, Slatyer, & Finkbeiner (2010) Su M., Slatyer T. R., Finkbeiner D. P., 2010, ApJ, 724, 1044
- Suresh et al. (2015a) Suresh J., Bird S., Vogelsberger M., Genel S., Torrey P., Sijacki D., Springel V., Hernquist L., 2015, MNRAS, 448, 895
- Suresh et al. (2015b) Suresh J., Rubin K. H. R., Kannan R., Werk J. K., Hernquist L., Vogelsberger M., 2015, arXiv, arXiv:1511.00687
- Swaters, Sancisi, & van der Hulst (1997) Swaters R. A., Sancisi R., van der Hulst J. M., 1997, ApJ, 491, 140
- Tumlinson et al. (2013) Tumlinson J., et al., 2013, ApJ, 777, 59
- Vogelsberger et al. (2013) Vogelsberger M., Genel S., Sijacki D., Torrey P., Springel V., Hernquist L., 2013, MNRAS, 436, 3031
- Vogelsberger et al. (2014) Vogelsberger M., et al., 2014, MNRAS, 444, 1518
- Wang et al. (2015) Wang L., Dutton A. A., Stinson G. S., Macciò A. V., Penzo C., Kang X., Keller B. W., Wadsley J., 2015, MNRAS, 454, 83
- Weil, Eke, & Efstathiou (1998) Weil M. L., Eke V. R., Efstathiou G., 1998, MNRAS, 300, 773
- Werk et al. (2014) Werk J. K., et al., 2014, ApJ, 792, 8
- Zschaechner, Rand, & Walterbos (2015) Zschaechner L. K., Rand R. J., Walterbos R., 2015, ApJ, 799, 61