X-ray variability of GeV gamma-ray emitting radio galaxy NGC 1275
Abstract
We analyzed Suzaku/XIS data of 2006–2015 observations of a gamma-ray emitting radio galaxy NGC 1275, and brightening of the nucleus in the X-ray band was found in 2013–2015, correlating with GeV Gamma-ray brightening. This is the first evidence of variability with correlation between GeV gamma-ray and X-ray for NGC 1275. We also analyzed Swift/XRT data of NGC 1275, and found that X-ray was flaring by a factor of 5 in several days in 2006, 2011, and 2013. The X-ray spectrum during the flare was featureless and somewhat steeper with a photon index of 2 against 1.7 in the normal state, indicating that a synchrotron component became brighter. A large Xray to GeV gamma-ray flux ratio in the flare could be explained by the shock-in-jet scenario. On the other hand, a long-term gradual brightening of radio, X-ray, and GeV gamma-ray with a larger gamma-ray amplitude could be origin of other than internal shocks, and then we discuss some possibilities.
1 Introduction
NGC 1275 is an elliptical galaxy, locating at the center of the Perseus cluster, and is also known to host an AGN and thus classified as a radio-loud Seyfert galaxy or a radio galaxy. Radio galaxies are very important to study jet phenomena. A viewing angle of their jets is not so small as blazars, and thus the apparent enhancement of the jet core emission due to the beaming effect is not so significant and we can probe the jet structure by seeing the jet periphery emission by observing radio galaxies.
In recent years, Fermi gamma-ray space telescope detected GeV gamma-ray emission from radio galaxies (Abdo et al., 2010), and NGC 1275 is the brightest among them. Since NGC 1275 was not detected with CGRO/EGRET and the gamma-ray flux of Fermi is much higher than the EGRET sensitivity limit, gamma-ray emission from NGC 1275 turned out to have increased over ten times (Abdo et al., 2009). Fermi observation showed the time variation of gamma-ray flux with several months scale (Kataoka et al., 2010) and the gamma-ray flare was also reported (Donato et al., 2010; Brown & Adams, 2011). These results rule out the possibility that the gamma-ray emission comes from the Perseus cluster via the cosmic ray interactions with the intracluster medium or the dark matter annihilation. In addition, TeV gamma-rays were also detected from NGC 1275 with MAGIC (Aleksić et al., 2012), and a correlated variability between GeV and optical was also found (Aleksić et al., 2014).
Therefore, a radio-loud gamma-ray emitting Seyfert galaxy NGC 1275 is now very attracting to study radio galaxies. The spectral energy distribution (SED) of NGC 1275 is reported to be explained by the synchrotron self-Compton (SSC) model (Abdo et al., 2009). However, the jet emission has not yet been confirmed in the X-ray band as described below. Therefore, the SED data of the NGC 1275 jet component currently rely mainly on the radio and gamma-ray band, and the SSC model parameters could change significantly, dependently on the X-ray jet flux.
In the X-ray band, the hosting Perseus cluster is very bright and a point-like source was for the first time resolved with Einstein/HRI (Branduardi-Raymont et al., 1981). XMM-Newton and Chandra could also resolve the nucleus emission spatially (Churazov et al., 2003; Balmaverde et al., 2006). Fabian et al. (2015) reported a historical X-ray light curve of NGC 1275 by collecting the results of many past satellites from OSO-8 to Swift/XRT. and showed that X-ray flux was very high in 1980s, decreased after 1990s, and then are becoming brighter again after 2000s. Based on the XMM-Newton observation in 2001 and 2006, the X-ray spectrum of the nucleus was reported to be represented by the powerlaw with a photon Index of 1.70–1.75 and a flux of erg cm-2 s-1 in 5–10 keV (Churazov et al., 2003; Yamazaki et al., 2013). However, X-ray and GeV gamma-ray connection and origin of X-rays from NGC 1275 nucleus have been not well understood. Yamazaki et al. (2013) reported that the Suzaku/XIS monitoring observations of NGC 1275 in 2006–2011 showed no clear variability against a GeV gamma-ray variability by a factor of 3. This indicates that jet emission is not dominated in the X-ray band.
The Fermi light curve showed a gradual GeV gamma-ray flux increase after 2010, almost correlating with 90 GHz radio flux (Dutson et al., 2014). VLBI observations confirmed that the radio outburst since 2005 was associated with the emergence of a new component (Nagai et al., 2010), and (Nagai et al., 2012) reported that the radio flux increase was mostly attributed to one compact component C3. In this paper, we reported the extended analysis of Suzaku/XIS data of NGC 1275 up to 2015 after Yamazaki et al. (2013), and also showed systematic analysis of Swift/XRT data of NGC 1275 in 2006, 2011, and 2013. Through this paper, errors correspond to 90% confidence range.
2 Suzaku/XIS Data Analysis and Results
We performed the X-ray imaging spectroscopy, using the archival Suzaku/XIS (Mitsuda et al., 2007; Koyama et al., 2007) data of NGC 1275, which was repeatedly observed with Suzaku every half year as a calibration target; 19 observations from 2006 to 2015 (table 1). Analysis method is described in detail in Yamazaki et al. (2013), and hare we extended the Suzaku/XIS data analysis to 2015. In the Suzaku/XIS data, we can see an X-ray enhancement at NGC 1275 against the ambient Perseus cluster emission in the XIS image. The excess becomes larger in higher energy band up to 12 keV, indicating that the X-ray spectrum is harder than the cluster emission. We evaluated this excess emission against the ambient cluster emission from the radial count rate profile centered on NGC 1275 in 9 energy bands and derived the X-ray spectra of excess emission in each observation. The X-ray spectrum of the excess emission is roughly represented by the absorbed power-law with a photon index of 1.6–1.8, and we obtained a history of the 5–10 keV flux from the derived spectra.
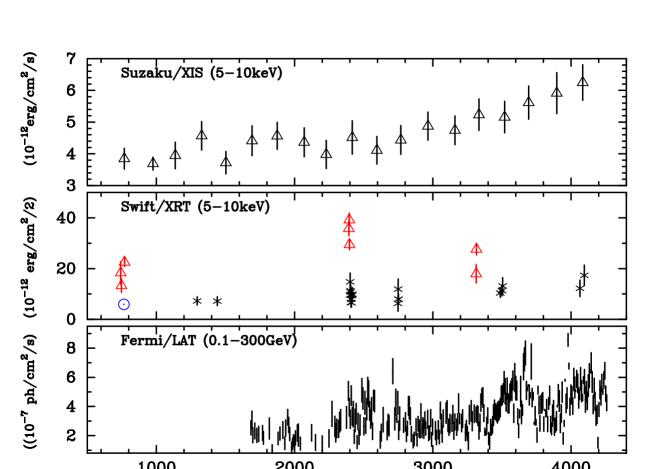
Figure 1 top shows a Suzaku/XIS X-ray light curve of NGC 1275 in 2006–2015. It can be seen that the X-ray flux was constant before 2012 and increased gradually since 2013. X-ray flux increase is a factor of 1.5 between 2012 and 2015. Figure 1 bottom plots the archival GeV gamma-ray light curve with one week time bin. We can see a similar behavior between X-ray and GeV gamma-ray light curves; both light curves show a gradual flux increase since 2013. This is the first evidence of positive correlation between X-ray and GeV gamma-ray.
| Observation Start | Sequence No. | R.A. Dec. † | Euler angle | Exposure (XIS)∗ |
|---|---|---|---|---|
| (deg) | (deg) | (sec) | ||
| 2012-02-07 20:00:00 | 106005020 | 49.9506 41.4000 | 49.9531 48.4984 188.0014 | 93635 (0,3) |
| 2012-08-20 23:30:00 | 107005010 | 49.9347 41.5380 | 49.9448 48.4826 17.3897 | 82263 (0,3) |
| 2013-02-11 04:59:00 | 107005020 | 49.9644 41.4892 | 49.9561 48.4897 193.7124 | 82795 (0,3) |
| 2013-08-15 10:14:00 | 108005010 | 49.9376 41.5389 | 49.9459 48.4822 13.7581 | 82514 (0,3) |
| 2014-02-05 12:30:00 | 108005020 | 49.9630 41.4842 | 49.9546 48.4948 194.0004 | 75999 (0,3) |
| 2014-08-27 15:50:00 | 109005010 | 49.9309 41.5377 | 49.9434 48.4822 22.6569 | 40051 (0,3) |
| 2015-03-03 17:25:00 | 109005020 | 49.9680 41.4854 | 49.9560 48.4945 201.4727 | 74409 (0,3) |
: Observation log in 2006–2011 is given in Yamazaki et al. (2013).
: Pointing direction.
: Exposure time summed over XIS-0, 2, 3. The values in the parenthesis represent the XIS detector ID used for the analysis.
3 Swift/XRT Data Analysis and Results
We analyzed archival Swift/XRT (Gehrels et al., 2004; Burrows et al., 2005) data of NGC 1275 as summarized in table 2. NGC 1275 was observed several times in 2006, 2010, and 2013. The 2010 and 2013 observations were triggered as ToO, and the 2013 observations were triggered by Fermi GeV gamma-ray flux increase (Ciprini, 2013). Observations were performed in both of the Windowed-Timing (WT) and Photon-Counting (PC) modes, as summarized in table 2. We analyzed the data with HEADAS 6.11. Following the analysis of XMM-Newton data in Yamazaki et al. (2013), the source spectra was extracted in 0.1 arcmin of NGC 1275. Note that the PSF of Swift/XRT telescope is almost the same as that of XMM-Newton telescope. Background spectra are extracted from 60–61 arcsec of the center. We fitted all the XRT spectra with two-temperature apec plus powerlaw model; phabs*(apec+apec+powerlaw) in the XSPEC model. Parameters of the APEC model, which represents a thermal emission from the Perseus cluster, are fixed to the XMM-Newton values used in Yamazaki et al. (2013), a temperature of 0.8 keV and a metal abundance of 0.5 solar.
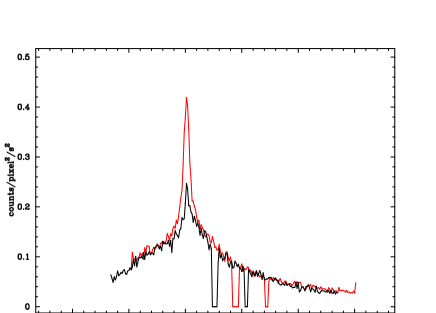
Figure 2 shows an example of XRT spectra in PC and WT modes. X-ray spectra in both modes are featureless, but note that the flux level is much higher in the WT mode than that in the PC mode. Figure 3 shows the count rate profiles around NGC 1275 for the slit region of 8 arcmin2 in the PC mode for the corresponding region in the WT mode in which onboard processing projects the data with 8 arcmin width into one line region. Extended X-ray emission of the ambient intracluster medium is the same level within 10% while the nuclear emission is brighter by a factor of in the WT mode than that in the PC mode.
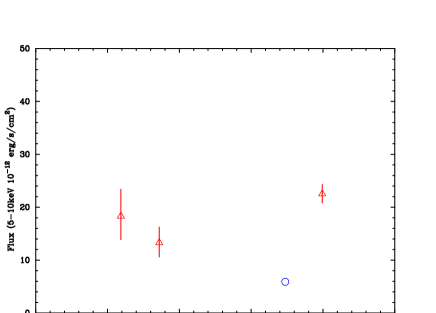
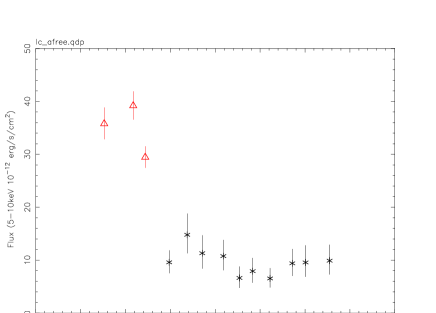
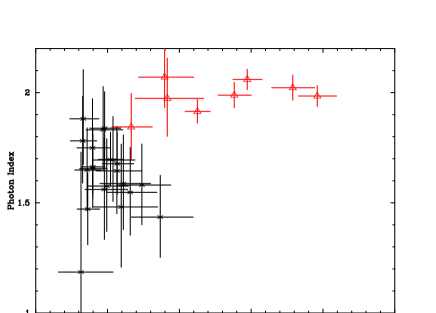
Figure 1 middle shows a time history of X-ray flux in 5–10 keV. XMM-Newton flux in 2006 was also plotted. The flux observed in the WT mode is very high by a factor of 2–4 against that observed in the PC mode or observed with XMM-Newton, and hereafter we call them ”X-ray flare”. The timescale of X-ray flux change is shorter than 5 days in both 2006 and 2010. As shown in figure 4, the X-ray flare continued in 5–10 days in 2011. Figure 5 shows a correlation between an X-ray flux in 5–10 keV and a photon index. Photon index during the X-ray flare is around 2, while it is around 1.5–1.7 during the persistent state, indicating that the X-ray spectrum became steeper in the X-ray flare. For the WT data 00031763001, we tried to fit the spectrum by double-powerlaw model, where one powerlaw has a photon index of 1.7 and a flux of erg cm-2 s-1 in 5–10 keV and the other one has free parameters. As a result, the other powerlaw model became a dominant component in the spectrum and gave a photon index of 2.05. Thefefore, the flaring component has a photon index of 2.0–2.1.
All of Swift/XRT spectra are featureless, while the XMM-Newton spectra show a fluorescence Fe-K line. The tightest upper limit of Fe-K line equivalent width (EW) is 619 eV and 191 eV in PC and WT modes, and both constraints are consistent with EWs measured with XMM-Newton; a signal-to-noise ratio of Swift/XRT data is too low to detect a Fe-K line due to a short exposure.
| Sequence No. | Observationa | Exposureb | Modec | Fluxd | |
|---|---|---|---|---|---|
| 00030354001 | 2006-01-06 (53741) | 1677 | WT | 18.3 | 1.97 |
| 00030354002 | 2006-01-12 (53747) | 3121 | WT | 13.3 | 1.84 |
| 00030364001 | 2006-02-03 (53769) | 3988 | WT | 22.5 | 1.91 |
| 00036524001 | 2007-07-13 (54294) | 5387 | PC | 7.2 | 1.47 |
| 00036524002 | 2007-12-06 (54440) | 3554 | PC | 7.2 | 1.65 |
| 00030354003 | 2009-12-30 (55195) | 4311 | PC | 0.0 | 0.00 |
| 00031763001 | 2010-07-15 (55392) | 1988 | WT | 35.8 | 2.02 |
| 00031763002 | 2010-07-18 (55395) | 4063 | WT | 39.2 | 1.98 |
| 00031763003 | 2010-07-20 (55397) | 4110 | WT | 29.5 | 2.06 |
| 00031770001 | 2010-07-22 (55399) | 2186 | PC | 9.6 | 1.84 |
| 00031770002 | 2010-07-24 (55401) | 2033 | PC | 14.8 | 1.58 |
| 00031770003 | 2010-07-26 (55403) | 2031 | PC | 11.3 | 1.64 |
| 00031770004 | 2010-07-28 (55405) | 2162 | PC | 10.8 | 1.69 |
| 00031770005 | 2010-07-30 (55407) | 2104 | PC | 6.6 | 1.88 |
| 00031770006 | 2010-08-01 (55409) | 2116 | PC | 7.9 | 1.75 |
| 00031770007 | 2010-08-03 (55411) | 2409 | PC | 6.5 | 1.78 |
| 00031770008 | 2010-08-05 (55413) | 1989 | PC | 9.4 | 1.83 |
| 00031770009 | 2010-08-07 (55415) | 2091 | PC | 9.6 | 1.56 |
| 00031770010 | 2010-08-09 (55417) | 2103 | PC | 9.9 | 1.58 |
| 00091128001 | 2011-07-05 (55747) | 1008 | PC | 0.0 | 0.00 |
| 00091128002 | 2011-07-06 (55748) | 1343 | PC | 6.3 | 1.19 |
| 00091128003 | 2011-07-07 (55749) | 1748 | PC | 11.9 | 1.48 |
| 00091128004 | 2011-07-09 (55751) | 3460 | PC | 7.9 | 1.66 |
| 00091128005 | 2011-07-10 (55752) | 4922 | PC | 8.0 | 1.66 |
| 00032691001 | 2013-01-21 (56313) | 1156 | WT | 17.9 | 2.07 |
| 00032691002 | 2013-01-23 (56315) | 2679 | WT | 27.6 | 1.99 |
| 00049799004 | 2013-07-14 (56487) | 5262 | PC | 10.4 | 1.70 |
| 00049799005 | 2013-07-26 (56499) | 3054 | PC | 11.3 | 1.68 |
| 00049799006 | 2013-08-01 (56505) | 1566 | PC | 13.2 | 1.55 |
| 00092034001 | 2015-02-11 (57064) | 1990 | PC | 12.2 | 1.59 |
| 00092034002 | 2015-03-15 (57096) | 2143 | PC | 17.3 | 1.44 |
: Observation Date. MJD is shown in the parenthesis.
: PC: Photon-Counting mode, WT: Windowed-Timing mode.
: Exposure time in unit of sec.
: Flux in 5–10 keV in unit of erg cm-2 s-1.
: Photon index.


|
| Base-line | Change | |
|---|---|---|
| 2.3 | ||
| [G] | 0.035 | |
| [Ms] | ||
| 2.1 | ||
| 3.1 | -0.2 | |
| [ erg s-1] | ||
| [ erg s-1] |
The model parameters are as follows: is the Doppler factor, is the magnetic field, is the variability timescale, and are the low-energy and high-energy electron spectral indices, respectively, , , and are the minimum, maximum, and break electron Lorentz factors, respectively, and and are the jet powers in magnetic field and electrons, respectively.
4 Discussion
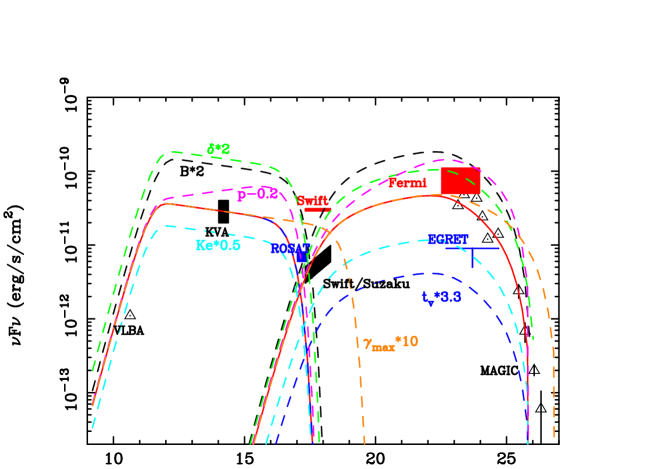
Analysis of Suzaku/XIS and Swift/XRT data exhibited that NGC 1275 nuclear X-ray emission varied with a long-term of several years timescale and a short-term of several days timescale. During the short-term flare-up, the X-ray spectrum became steeper than the normal state; the powerlaw photon index became 2.0 from 1.5–1.7 of the normal state. Figure 6 shows a SED where the data are taken from our results and past results. We plot the data of the long-term variation by black. For the radio band, we took the VLBA data (Suzuki et al., 2012). For the optical data, we took the flux range of KVA light curve in Aleksić et al. (2014). For the X-rty data, we plot the ROSAT/HXI flux (Fabian et al., 2015), long-term flux range with a photon index of 1.7) of Swift and Suzaku in the normal state (this work), and Swift flux in the flares (this work). For the gamma-ray, we took the flux in the normal state (Abdo et al., 2009; Aleksić et al., 2012), and the high flux state (we scaled the flux in the normal state by a factor of 2.5, based on figure 1 bottom). In the plot, we colored the flare data with red. Looking at this plot, we discuss the flux variation of NGC 1275.
The long-term X-ray variation was already reported by Fabian et al. (2015) with the past many X-ray satellites, but our results are unique in terms of showing a positive correlation between X-ray and GeV gamma-ray for the first time. Origin of X-ray emission from the NGC 1275 nucleus is somewhat uncertain. Several papers assumed that the X-ray emission comes from the inner jet (Abdo et al., 2009; Kataoka et al., 2010; Suzuki et al., 2012; Aleksić et al., 2014), and obtained the jet emission parameters by analyzing the SED. On the other hand, XMM-Newton spectrum shows a Fe-K line with an EW of 70 eV and a powerlaw photon index of 1.7 (Churazov et al., 2003; Yamazaki et al., 2013). These properties are typical for Seyfert galaxies, and thus the disk/corona emission is suggested to be dominant in the normal state. We suggest that the jet emission largely contributes to the X-ray region when the GeV gamma-ray flux increases as in 2013–2014.
We plot one-zone synchrotron self-Compton model curves calculated with the formula in Finke et al. (2008) for various parameter sets. We assumed the broken powerlaw for the electron energy distribution as Abdo et al. (2009). The base-line parameter set (table 3) is a modification of Abdo et al. (2009); we adjusted the magnetic field and the variability timescale to be weaker and shorter, respectively, so that the VLBA, optical, and X-ray data in the normal state are reproduced. We calculated the curves by changing only one parameter from the normal state for magnetic field , Doppler factor , variable time scale , normalization of electron energy spectrum , and powerlaw index of electron energy distribution above the break energy.
In the long-term variation, X-ray flux increase is not as large as GeV gamma-ray increase. Such a behavior is reproduced by the increase of electron density or spectral hardening (decrease of ) of electron energy distribution as shown in figure 6 (light blue or purple, respectively). However, a year-scale gradual hardening of electron energy distribution is unlikely, since the cooling time of high energy electrons is much shorter than one year. Therefore, the increase of electron density is one possibility. In addition, the decrease of variable timescale , in other word, the reduction of emission region may work together (inferred from the opposite trend against the blue lines which shows a longer case). We might see the jet collimation for the recent gradual brightening. On the other hand, the radio C3 component brightened since 2003 with an accelerating apparent speed of 0.10 to 0.47 (Nagai et al., 2010; Suzuki et al., 2012; Nagai et al., 2012). Their flux history is similar to that of GeV gamma-ray and also X-ray. Nagai et al. (2012) reported no radio flare during 2010 flare. Therefore, C3 is likely to be related with the long-term gamma-ray and X-ray flux increase. Nagai et al. (2016) suggested that the C3 is the head of a radio lobe including a hot spot, and their activity would be enhanced by the energy input from the nucleus. As seen in figure 2 of Nagai et al. (2016), the radio core (C1 component) has also been increasing a little as weel as C3. Therefore, the increasing activity is one of possibilities of origin of long-term gradual increase of X-ray and gamma-ray flux.
Here we model the SED by one-zone SSC model, following Abdo et al. (2009). In this modeling, the X-ray emission in the normal state is low energy tail of the inverse Compton scattering (IC), and the main IC component appears above 1 MeV, due to a relatively high minimum electron energy (800). The assumed electron spectrum is as steep as . On the other hand, Aleksić et al. (2014) modeled the SSC with a flatter electron spectrum or and a lower minimum electron energy of . However, their model exceeds the observed X-ray emission in the normal state. Therefore, Tavecchio & Ghisellini (2014) introduced the structured jet model where the fast spine component main contributes to the low energy peak of SED while the slow layer surrounding the spine produces the high energy peak of SED. At fact, Nagai et al. (2014) found the limb-brightened structure in the VLBA core of NGC 1275, suggesting such a structured jet. In this case, the X-ray emission is a lower part of the main IC component coming from the slow layer.
One interesting fact is that NGC 1275 was not detected with CGRO/EGRET in 1991–2000, where the X-ray flux is almost the same as the current flux (ref. X-ray light curve in Fabian et al. (2015)). Current GeV gamma-ray flux observed with Fermi is brighter than the EGRET sensitivity. This indicates that the gamma-ray to X-ray flux ratio was smaller in 1991–2000 by a factor of than that in the present days. The X-ray variation almost follows the radio variation (Fabian et al., 2015). This could be caused by the different electron energy density of emission region between two epochs; a higher electron energy density in the present days by a factor of 10 than that in 1990s (light blue). The difference of emission region size (or ) could be origin, but a reduction of emission region size by a factor of from 1990s to the present days is needed, and it seems unlikely. Asada et al. (2006) reported that the radio flux decrease in 1990s is attributed to the adiabatic expansion of radio lobe in the central pc, in agreement with the above scenario.
Short-term flares found with Swift/XRT coincides with GeV gamma-ray brightening for the flares in 2010 and 2013 (Brown & Adams, 2011; Ciprini, 2013). This indicates that the origin of X-ray flare is a jet emission. According to Brown & Adams (2011), the 2010 flare showed a GeV gamma-ray flux increase by a factor of 2–3, against 4–5 of the X-ray flux increase. Steeper X-ray spectrum during the flares can be explained by that the X-ray is a synchrotron high-energy tail unlike the SSC low-energy tail or part in the normal state.
Another possibility is that the X-ray flare comes from the disk/corona when the GeV gamma-ray emitting jet emerged. A radio galaxy 3C 120 shows radio knot ejection events after the dimming in the X-ray band (Chatterjee et al., 2009), and they suggested that the inner material of the disk/corona suddenly goes into the central black hole and generate a new jet. At fact, X-ray emission of 3C 120 has been reported to be dominated by the disk/corona emission (Kataoka et al., 2011; Fukazawa et al., 2015; Tanaka et al., 2015). Coincident brightening between X-ray and GeV gamma-ray for NGC 1275 flares cannot be explained by this scenario, and thus the jet origin of the X-ray flares is likely.
If so, the above features of the X-ray flares, a spectral steeping and a high X-ray to gamma-ray ratio, can be explained by a higher magnetic field of the flaring region. X-ray flares are likely a synchrotron tail, while the synchrotron emission in the steady state does not reach the X-ray band (Abdo et al., 2009). Stronger magnetic field could move the synchrotron cut-off to higher energy, and the X-ray flux increases much largely than the gamma-ray flux does. However, the X-ray spectrum during the flare is not so steep and thus the synchrotron cut-off seems to exist in the higher energy band then the Swift/XRT band. Therefore, in addition to the higher magnetic field, the higher maximum electron energy is needed. If the maximum electron energy becomes higher by a factor of 10 in the flare, the synchrotron emission reaches the X-ray band, as seen in figure 6 (red dashed line). Shock-in-jet model can produce such a parameter change.
Hitomi (ASTRO-H) (Takahashi et al., 2014) is very promissing to study the SED of NGC 1275 nucleus, since it covers a wide X-ray band from 0.4 keV to 600 keV, and the hard X-ray to soft gamma-ray band is very sensitive. Although the sott X-ray band is dominated by the emission from the ambient intracluster emission, HXI will resolve the hard core and detect the AGN component above 100 keV. SGD could detect the core emission if the powerlaw extends beyond 100 keV without break. If the jet emission dominates above 10 keV, a spectral cut-off feature typical for Seyfert galaxies is expected to not exist. In addition, SXS could resolve the 6.4 keV line from the 6.7/7.0 keV cluster emission line, which is very useful for considering the origin of X-ray emission; we can perform the detail line diagnostics on the line energy, line width, Compton shoulder, and so on. Although the AGN continuum emission would be buried in the intracluster emission for the SXS spectrum, due to a large PSF, a simultaneous XMM-Newton observation will be very useful to constrain both the 6.4 keV and continuum. Together with HXI, we can constrain the reflection component of disk/corona emission and thus obtain the information around the central engine.
References
- Abdo et al. (2009) Abdo, A. A., Ackermann, M., Ajello, M., et al. 2009, ApJ, 699, 31
- Abdo et al. (2010) Abdo, A. A., Ackermann, M., Ajello, M., et al. 2010c, ApJ, 720, 912
- Aleksić et al. (2012) Aleksić, J., Alvarez, E. A., Antonelli, L. A., et al. 2012, A&A, 539, L2
- Aleksić et al. (2014) Aleksić, J., Ansoldi, S., Antonelli, L. A., et al. 2014, A&A, 564, A5
- Asada et al. (2006) Asada, K., Kameno, S., Shen, Z.-Q., et al. 2006, PASJ, 58, 261
- Balmaverde et al. (2006) Balmaverde, B., Capetti, A., & Grandi, P. 2006, A&A, 451, 35
- Branduardi-Raymont et al. (1981) Branduardi-Raymont, G., Fabricant, D., Feigelson, E., et al. 1981, ApJ, 248, 55
- Brown & Adams (2011) Brown, A. M., & Adams, J. 2011, MNRAS, 413, 2785
- Burrows et al. (2005) Burrows, D. N., Hill, J. E., Nousek, J. A., et al. 2005, Space Sci. Rev., 120, 165
- Chatterjee et al. (2009) Chatterjee, R., Marscher, A. P., Jorstad, S. G., et al. 2009, ApJ, 704, 1689
- Churazov et al. (2003) Churazov, E., Forman, W., Jones, C., Böhringer, H. 2003, ApJ, 590, 225
- Ciprini (2013) Ciprini, S. 2013, The Astronomer’s Telegram, 4753, 1
- Donato et al. (2010) Donato, D., Wood, D., & Cheung, C. C. 2010, The Astronomer’s Telegram, 2737,
- Dutson et al. (2014) Dutson, K. L., Edge, A. C., Hinton, J. A., et al. 2014, MNRAS, 442, 2048
- Fabian et al. (2015) Fabian, A. C., Walker, S. A., Pinto, C., Russell, H. R., & Edge, A. C. 2015, MNRAS, 451, 3061
- Finke et al. (2008) Finke, J. D., Dermer, C. D., Böttcher, M. 2008, ApJ, 686, 181
- Fukazawa et al. (2015) Fukazawa, Y., Finke, J., Stawarz, Ł., et al. 2015, ApJ, 798, 74
- Gehrels et al. (2004) Gehrels, N., Chincarini, G., Giommi, P., et al. 2004, ApJ, 611, 1005
- Kataoka et al. (2010) Kataoka, J., Stawarz, Ł., Cheung, C. C., et al. 2010, ApJ, 715, 554
- Kataoka et al. (2011) Kataoka, J., Stawarz, Ł., Takahashi, Y., et al. 2011, ApJ, 740, 29
- Koyama et al. (2007) Koyama, K., Tsunemi, H., Dotani, T., et al. 2007, PASJ, 59, 23
- Mitsuda et al. (2007) Mitsuda, K., Bautz, M., Inoue, H., et al. 2007, PASJ, 59, 1
- Nagai et al. (2010) Nagai, H., Suzuki, K., Asada, K., et al. 2010, PASJ, 62, L11
- Nagai et al. (2012) Nagai, H., Orienti, M., Kino, M., et al. 2012, MNRAS, 423, L122
- Nagai et al. (2014) Nagai, H., Haga, T., Giovannini, G., et al. 2014, ApJ, 785, 53
- Nagai et al. (2016) Nagai, H., Chida, H., Kino, M., et al. 2016, Astronomische Nachrichten, 337, 69
- Suzuki et al. (2012) Suzuki, K., Nagai, H., Kino, M., et al. 2012, ApJ, 746, 140
- Takahashi et al. (2014) Takahashi, T., Mitsuda, K., Kelley, R., et al. 2014, Proc. SPIE, 9144, 914425
- Tanaka et al. (2015) Tanaka, Y. T., Doi, A., Inoue, Y., et al. 2015, ApJ, 799, L18
- Tavecchio & Ghisellini (2014) Tavecchio, F., & Ghisellini, G. 2014, MNRAS, 443, 1224
- Yamazaki et al. (2013) Yamazaki, S., Fukazawa, Y., Sasada, M., et al. 2013, PASJ, 65, 30