Electron nuclear double resonance with donor-bound excitons in silicon
Abstract
We present Auger-electron-detected magnetic resonance (AEDMR) experiments on phosphorus donors in silicon, where the selective optical generation of donor-bound excitons is used for the electrical detection of the electron spin state. Because of the long dephasing times of the electron spins in isotopically purified 28Si, weak microwave fields are sufficient, which allow to realize broadband AEDMR in a commercial ESR resonator. Implementing Auger-electron-detected ENDOR, we further demonstrate the optically-assisted control of the nuclear spin under conditions where the hyperfine splitting is not resolved in the optical spectrum. Compared to previous studies, this significantly relaxes the requirements on the sample and the experimental setup, e.g. with respect to strain, isotopic purity and temperature. We show AEDMR of phosphorus donors in silicon with natural isotope composition, and discuss the feasibility of ENDOR measurements also in this system.
Spin-to-charge conversion in electrically detected magnetic resonance provides a very sensitive way of measuring the spins of donors in silicon Stegner et al. (2006); McCamey et al. (2006, 2010); Steger et al. (2012), enabling the detection of single spins Morello et al. (2010); Pla et al. (2013), as well as spin resonance experiments at low or zero external magnetic field Morishita et al. (2009); Franke et al. (2014); Dreher et al. (2015). In the context of quantum computation, where the electron and nuclear spins of donors in silicon are interesting because of their extremely long coherence times Tyryshkin et al. (2003, 2012); Steger et al. (2012); Saeedi et al. (2013); Itoh and Watanabe (2014), electrical detection, as well as electrical control Bradbury et al. (2006); Lo et al. (2014); Wolfowicz et al. (2014); Laucht et al. (2015), could facilitate an integration of quantum bits with current semiconductor technology. In the case of electrical detection based on spin-dependent recombination, the time scales which can be addressed can be limited by the spin lifetime of the particular readout partner Hoehne et al. (2013); Franke et al. (2014) which in turn also limits the nuclear spin coherence time of neutral donors Dreher et al. (2012); Hoehne et al. (2015). The spin-to-charge conversion based on the creation of donor-bound excitons (DBE), on the other hand, does not have this effect Steger et al. (2012). DBE complexes can be formed by resonant infrared laser excitation and almost immediately decay in an Auger process generating nonequilibrium charge carriers in the conduction band, allowing the detection of the optical transition as a photocurrent. In particular in isotopically purified 28Si, these infrared transitions can be remarkably sharp and the Zeeman interaction of the donor and the DBE complex with magnetic fields can be resolved in the optical spectra Karaiskaj et al. (2001); Yang et al. (2006). This spin-selective excitation can be used as an electrical detection mechanism for the electron spin of the donor Yang et al. (2006), called Auger-electron-detected magnetic resonance (AEDMR) Steger et al. (2012). In samples with high purity and at low temperatures (typically K), it is even possible to optically resolve the hyperfine splitting Yang et al. (2006, 2009) enabling the optical Steger et al. (2011); Salvail et al. (2015) and electrical Steger et al. (2012) detection of the nuclear spin state.
In silicon with natural isotope composition (natSi), the line broadening connected to random positions of the different isotopes in the host crystal renders this selective excitation of donors in a certain nuclear spin state impossible Kaminskii et al. (1980); Thewalt et al. (2007). While electron spin selectivity via DBE in natSi is obtained at high magnetic fields and allows for a fast and high polarization of the electron spins, an optical polarization of the nuclear spins can only be reached on a timescale of minutes to hours, based on Overhauser relaxation Overhauser (1953); Feher and Gere (1959); Dluhy et al. (2015). A similar situation arises for 28Si when the DBE lines are broadened by even weak inhomogeneous strains. Therefore in these experiments the photoconductivity is usually monitored in a contactless capacitive fashion by placing the sample between two metal plates and measuring the impedance of this assembly. Only recently, AEDMR of the electron spin of 31P donors was realized in a 28Si sample equipped with evaporated Al contacts Lo et al. (2015). While this experimental realization allows for a higher sensitivity compared to a capacitive detection of the sample’s conductivity, the strain induced by the contact structure appears to significantly shift and broaden the DBE transitions, inhibiting the separation of the nuclear spin states in that study. We address this issue by implementing Auger-electron-detected electron nuclear double resonance (ENDOR), enabling us to detect the nuclear spin state of 31P donors in experimental conditions such as higher temperatures or the presence of strain, where the hyperfine interaction is not optically resolved. We further show the feasibility of AEDMR in natSi at magnetic fields corresponding to X-band frequencies, demonstrating that our ENDOR approach will also be beneficial in such samples.
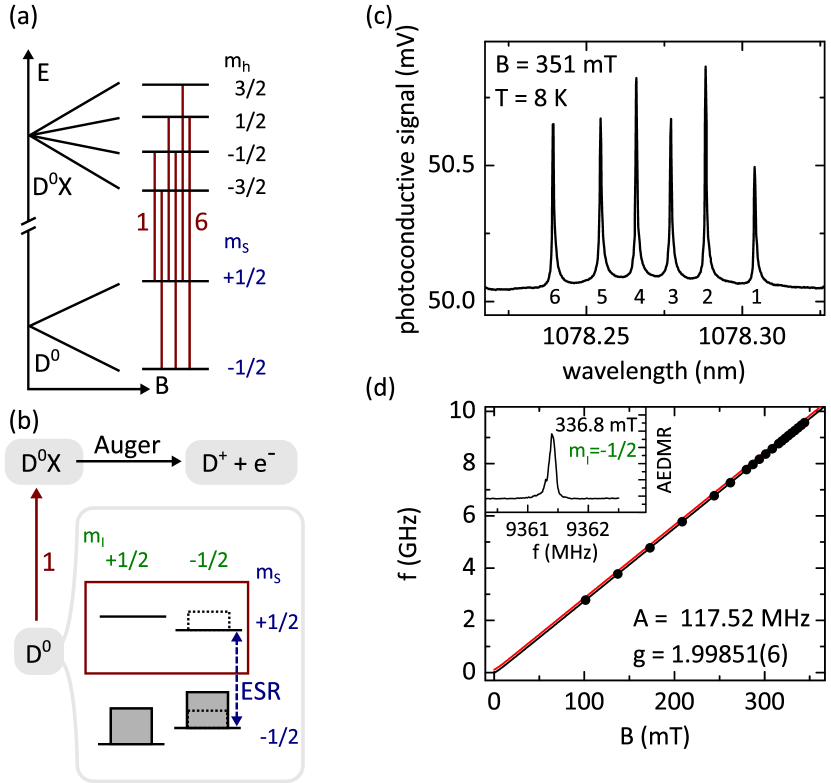
A schematic representation of the DBE transitions (not considering the donor nuclear spin) is shown in Fig. 1(a). The neutral donor states are labeled D0 and split up in two levels with electron spin projections due to the Zeeman interaction with an external magnetic field . The donor-bound exciton states, labeled D0X, split according to the Zeeman interaction of the hole with spin 3/2 and spin projections , since the two electrons in the three-particle DBE complex form a spin singlet. This leads to a total of six dipole-allowed optical transitions indicated by the red lines labeled 1 through 6 Yang et al. (2006). The selective excitation of one of these lines allows us to perform electrically detected ESR experiments, as schematically shown in Fig. 1(b), where the laser is assumed to excite DBE line 1. The ionization of donors in the state and the subsequent capture of an electron with random spin state lead to an accumulation of donors with and hence a very large steady-state polarization. The level populations of the neutral donors D0 with electron and nuclear spin projections and , resp., are shown by the gray boxes in Fig. 1(b). Since the ESR transitions, in contrast to the DBE transitions in our experiments, are nuclear-spin-selective, all four donor levels have to be considered when discussing the principle of the AEDMR experiments. If one of the two ESR transitions (, ) is saturated by microwave (mw) irradiation (dashed blue arrow), one of the states gets repopulated (dashed boxes). Under continuous excitation of one of the DBE lines (here: DBE line 1), the ESR saturation enhances the formation of DBEs and, subsequently, the ejection of charge carriers into the conduction band. It is easily seen that, while shown for DBE line 1 and here, this process can realize an electrical detection of ESR for all six DBE lines and both ESR transitions.
The samples used in this work are an isotopically purified 28Si sample () with a dopant concentration (size mm3) Steger et al. (2011) and a natSi sample cut from a commercial float zone wafer with (size mm3). The experiments are performed in a Bruker flexline X-band resonator for pulsed ENDOR in a He-flow cryostat at a typical temperature K. Microwave pulses are defined by a digital pulse card generating square pulses that are mixed with continuous-wave (cw) microwave. These are then amplified by a traveling-wave-tube amplifier and attenuated, resulting in a typical mw power of W which in our system corresponds to a pulselength of ns for a -pulse. To avoid mechanical stress, the samples are mounted loosely between two gold-covered plates, the impedance of which is monitored at 476 kHz with a lock-in amplifier. The phase of the detection is chosen such that the signal-to-noise ratio of the photoconductivity measurement is optimal. The magnetic field was calibrated with an NMR Gaussmeter placed at the sample position, giving an estimated uncertainty of mT. The NKT Photonics fiber laser provides wavelengths between 1077.7 and 1078.5 nm, achieved by adjustment of the fiber temperature and an additional, fast tuning via the voltage applied to a piezo-electric crystal. A laser power of mW is used and the light is focused on the sample’s thinner edge, the spot size on the sample is mm2. Because of the very weak absorption Thewalt et al. (2007), we assume that the we probe the full depth of the samples with an estimated number of (28Si sample) and (natSi sample) phosphorus spins. For cw ESR measurements, the laser wavelength is tuned to one of the DBE lines and stabilized by a PI controller using the observed photoconductivity as feedback.
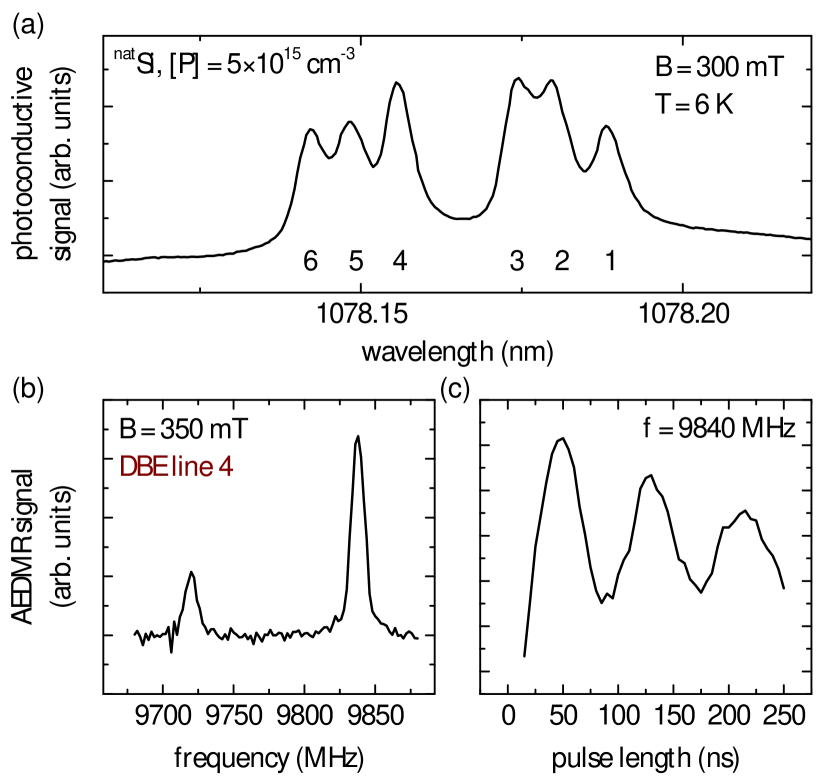
Figure 1(c) exemplarily shows the measured photoconductive signal as a function of the laser wavelength and clearly shows the six DBE lines which are split by an external magnetic field mT. Tuning the laser to DBE line 1 and sweeping the mw frequency at a fixed external magnetic field, we record AEDMR spectra. A typical AEDMR spectrum is shown in the inset of Fig. 1(d), where the photoconductive signal is shown as a function of the mw frequency for mT. Due to the long coherence times of the electron spin, only weak microwave powers are needed to saturate the ESR transition. Therefore, in cw experiments, we are able to use the microwave antenna of the X-band resonator as a broadband mw delivery system, allowing us to perform measurements over a large frequency and magnetic field range. The observed resonance positions are shown as circles in Fig. 1(d) and the theoretically expected positions for the low frequency () peak are fit to the data (black line). With the hyperfine interaction constant MHz as determined by the ENDOR experiments below, the fit results in an electronic g-factor , which is in very good agreement with previous measurements Feher (1959a).
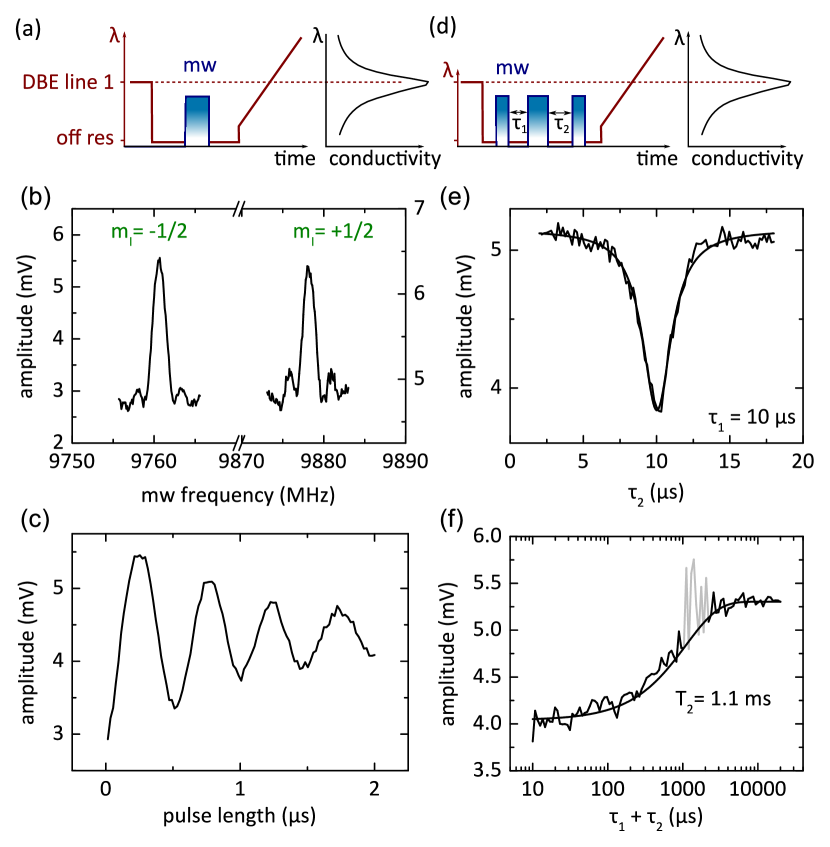
To perform pulsed ESR measurements, we use the mw resonator, which was tuned to a low quality factor, around its resonance frequency and take advantage of the piezo-tuning of the laser to switch between on-resonance and off-resonance illumination. A typical pulse sequence is shown in Fig. 2(a), where the laser tuning during the sequence is indicated by the red line, schematically showing the laser wavelength on the vertical axis. After a long (typically 1s) polarization period (here DBE line 1), the laser is tuned off-resonance to avoid spurious ionization during the manipulation of the spin system via magnetic resonance. Then, one or more microwave pulses are applied. At the end of each sequence, the laser wavelength is swept over the DBE resonance line. A typical photoconductive trace as measured after the application of a resonant mw pulse is shown as a function of at the right of the sequence. The amplitude of the observed line is determined by fitting the trace with a Lorentzian and is a measure for the population of the probed donor state (here ). Note that the strong DBE signal allows us to perform all experiments single-shot, without additional averaging. Furthermore, this approach provides an easy and frequent calibration of the position of the DBE line to compensate for slow drifts in the laser wavelength or changes in the magnetic field.
We now apply mw pulses corresponding to a rotation of of the spin system, and again set the magnetic field to mT. ESR spectra are recorded by sweeping the mw frequency and clearly show the two hyperfine-split resonance peaks [Fig. 2(b)]. As expected and analogous to the cw measurements, the photoconductivity is enhanced on resonance, where a repopulation of the level is achieved (cf. Fig. 1(b)). The lineshape is limited by the excitation bandwidth of the mw pulse (pulselength 500 ns), as indicated by the pattern reflecting the frequency distribution of the square pulse. By changing the length of the mw pulse, Rabi oscillations are recorded as shown in Fig. 2(c), demonstrating that the coherent control of the electron spin can be detected. As can be deduced from the different amplitudes of the two hyperfine-split AEDMR lines, a nuclear spin polarization is created, most likely because of Overhauser electron spin relaxation via the hyperfine interaction Overhauser (1953); Feher and Gere (1959). It can reach up to 95% after long periods of resonant illumination and can significantly hinder some of the measurements, such as AEDMR on both hyperfine-split lines. Therefore, resonant excitation of a different DBE line or above-bandgap illumination was sometimes used to reset the nuclear spin hyperpolarization between experiments Hoehne et al. (2015). Since it acts as an upper bound in the nuclear spin polarization process, we can estimate that the electron spin polarization in our experiments is close to 100%. At the applied laser power, it is created within s, as determined by measuring the time constant of the transient current after application of resonant laser light.
For the detection of an electron spin echo, the single mw pulse is replaced by an echo sequence which includes a final pulse Breiland et al. (1973); Huebl et al. (2008) to project the magnetization onto the -axis where it can be detected by the AEDMR readout [Fig. 2(d)]. The resulting spin echo is shown in Fig. 2(e) for s. We can measure the electron spin coherence time by recording the echo amplitude as a function of for , which is shown in Fig. 2(f), and find a ms, comparable to similar measurements on isotopically purified 28Si Tyryshkin et al. (2012); Lo et al. (2015).
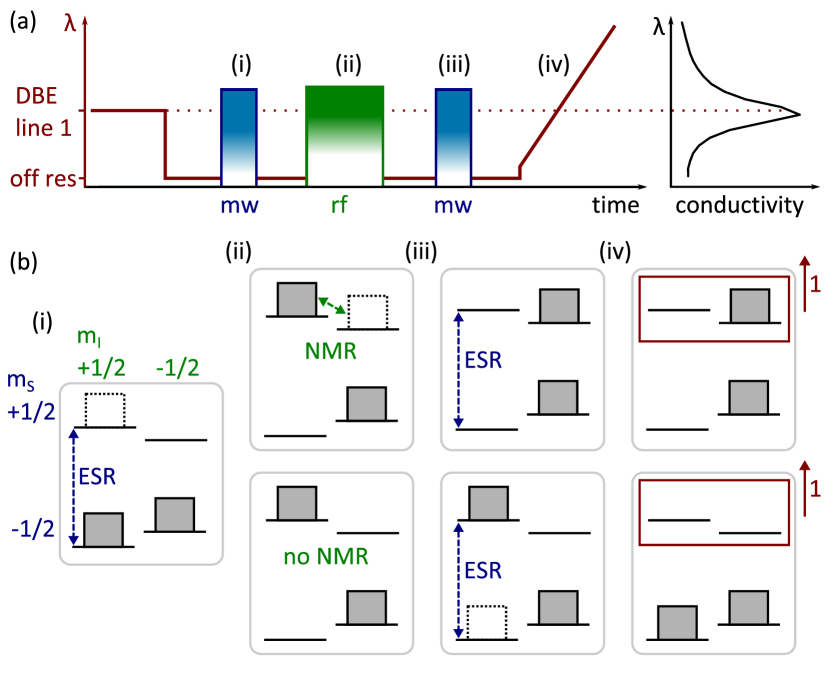
For the detection and coherent manipulation of the nuclear spin, we combine mw and radio frequency (rf) pulses to implement Auger-electron-detected ENDOR (AEDENDOR). In silicon, ENDOR is frequently used in combination with conventional ESR detection Feher (1959a, b); Hale and Mieher (1969); Tyryshkin et al. (2006); Morton et al. (2008); George et al. (2010); Morley et al. (2010); Simmons et al. (2011) and spin-dependent recombination Stich et al. (1996); Hoehne et al. (2011); Dreher et al. (2012); Hoehne et al. (2015) to realize NMR experiments exploiting the higher sensitivity of electron spin detection. We discuss our experimental approach with the help of Fig. 3, where the applied pulse sequence is shown in (a) together with level schemes illustrating the population of the donor spin states during the experiment in (b). At the beginning, the resonant laser excitation (DBE line 1) once more polarizes the system by ionization of the donors with . As a result, only the states are occupied as depicted by the gray boxes in Fig. 3(b)(i). After the laser is tuned off-resonance, a selective mw pulse swaps the populations of the two states (dashed blue arrow). Subsequently, an rf pulse is applied (ii) that is either resonant (NMR, top row) or off resonance (no NMR, bottom row) with the donor nuclear spin. In the case of NMR, a transition within the a subensemble (here: ) is induced and the level populations are changed (green arrow). If the rf pulse is off-resonance, the populations remain unchanged. Then, a second mw pulse is applied (dashed blue arrow in (iii)), which again swaps the populations of the two states. The resulting configuration is different in the two cases discussed in Fig. 3(b). In the case of an off-resonant rf pulse (bottom row), the mw pulse swaps the populations back to their initial state. In the configuration after a resonant rf pulse (top row), however, the second mw pulse has no effect on the populations, since it is between two empty levels. Hence, one of the levels remains occupied after the second mw pulse. At the end of the sequence, the laser wavelength is again swept and reveals the signal for DBE line 1, measuring the population of the states (red frame in (iv)). Its magnitude is therefore enhanced in the case of a resonant rf pulse (top row). In principle, both NMR transitions can be measured using the same DBE line for polarization and detection of the spin ensemble. This becomes clear from Fig. 3(b)(ii). The application of an rf pulse resonant with the subensemble populates the , level, meaning that the final mw -pulse is between two equally occupied levels. Similar to the case discussed above, this leads to a remaining occupation of one of the levels and hence to a photoconductive signal.
For the experimental realization of the measuring scheme, we use the ESR transition at MHz and mT. In Fig. 4(a), the resulting ENDOR signal is shown as a function of the frequency of the applied rf pulse. Two peaks are observed, corresponding to the resonances of the and subensembles. The line positions correspond to a hyperfine interaction of MHz and a nuclear -factor , in very good agreement with previous measurements Feher (1959a); Steger et al. (2011). As mentioned, both nuclear spin resonances can be detected with the excitation of the same DBE line. However, we have found that driving the NMR transition between the two levels that are not ionized by the laser leads to very long polarization lifetimes ( min) and significant broadening of the spectrum even when a reset pulse is added to the sequence. Therefore, we have used DBE line 2 which ionizes the states for the detection of the resonance at MHz.
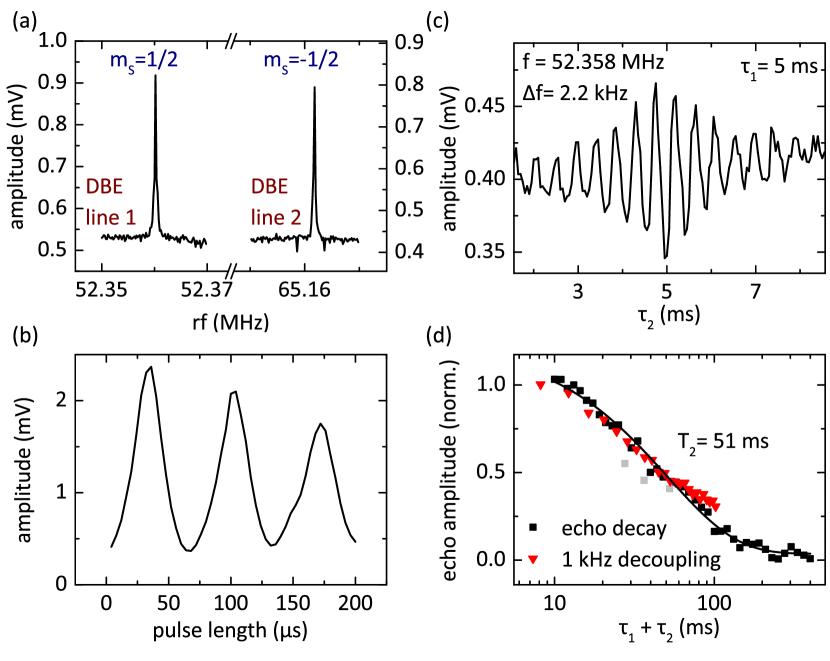
By changing the length of the applied rf pulse, we are able to record Rabi oscillations of the nuclear spin which are shown in Fig. 4(b). Replacing the single rf pulse by a three-pulse echo sequence equivalent to the electron spin echo sequence shown in Fig. 2(c), a nuclear spin echo is recorded for ms [Fig. 4(c)]. The echo displays an oscillation with kHz, revealing a slight offset of the applied radio frequency from the NMR transition. The width of the observed echo ( ms) corresponds to a linewidth of about Hz, suggesting that the spectra in Fig. 4(a) are also limited by the excitation bandwidth of the applied pulses (pulse length ms)
To determine the nuclear spin coherence time, we measure the echo amplitude as a function of . The observed decay is well described by an exponential decay with a time constant ms. It is not significantly enhanced by the application of dynamical decoupling pulses, as shown by the red triangles in Fig. 4(d), where refocusing pulses are applied at a frequency kHz in a Carr-Purcell sequence Carr and Purcell (1954). This suggests that the coherence time is limited by a process that is either frequency independent or cannot be refocused and is in agreement with the observation of an exponential decay in Fig. 4(d) Medford et al. (2012). While the electron spin lifetime could in principle limit the nuclear spin coherence time , it is typically orders of magnitude larger than the measured here Castner (1963), which is confirmed by the polarization dynamics discussed above. However, we suspect that electron spin flip-flop processes limit the nuclear spin coherence time in this sample because of the rather large phosphorus concentration.
Coming back to the application of our experiments to natSi, we first measure the photoconductive spectrum at mT and K. As shown in Fig. 5, the six DBE peaks are observed but overlap significantly. Still, we are able to measure a pulsed AEDMR spectrum (Fig. 5(b)), as well as Rabi oscillation of the electron spin (Fig. 5(c)). The difference of the amplitudes of the hyperfine-split resonances is again due to the slow Overhauser polarization of the nuclear spins Dluhy et al. (2015). Since the range of the piezo-tuning of our laser is not sufficient to achieve an effective pulsing of the laser, a mechanical shutter should be used to realize more complex experiments, such as ENDOR. Still, these proof-of-principle measurements show that optically assisted ENDOR experiments are also feasible in natSi.
In summary, we have presented Auger-electron detected measurements of the electron and nuclear spin of phosphorus donors in 28Si. Because of the long electron spin dephasing times in this material, AEDMR experiments can be realized at very low mw powers, which allowed us to realize a broadband detection using the antenna of an off-resonant dielectric resonator. We have further demonstrated the detection and manipulation of the nuclear spin state using Auger-electron-detected ENDOR, which does not rely on the optical selectivity on . This approach significantly lowers the requirements on the linewidth of the laser used for excitation, on strain and isotopic purity of the sample, and on the experimental temperature compared to Auger-electron-detected NMR experiments. Also, we have shown the feasibility of AEDMR of phosphorus in silicon with natural isotope composition, which means that the discussed ENDOR technique can enable the control of the 31P nuclear spin in such samples as well. The resulting very large polarization can also be transferred to 29Si nuclear spins to enhance the NMR signal in Si nanoparticle MRI agents, either by ENDOR followed by inter-nuclei relaxation Dluhy et al. (2015), or by a direct transfer of the electron spin polarization using dynamic nuclear polarization Hartmann and Hahn (1962); Abragam and Goldman (1978); Can et al. (2015).
Acknowledgements.
This work was financially supported by DFG through SPP 1601 (grant Br 1858/8-2) and the JST-DFG Strategic Cooperative Program on Nanoelectronics, the work at Keio was supported by KAKENHI (S) No. 26220602, JSPS Core-to-Core Program, and the Spintronics Research Network in Japan.References
- Stegner et al. (2006) A. R. Stegner, C. Boehme, H. Huebl, M. Stutzmann, K. Lips, and M. S. Brandt, Nat. Phys. 2, 835 (2006).
- McCamey et al. (2006) D. R. McCamey, H. Huebl, M. S. Brandt, W. D. Hutchison, J. C. McCallum, R. G. Clark, and A. R. Hamilton, J. Appl. Phys. 89, 182115 (2006).
- McCamey et al. (2010) D. R. McCamey, J. V. Tol, G. W. Morley, and C. Boehme, Science 330, 1652 (2010).
- Steger et al. (2012) M. Steger, K. Saeedi, M. L. W. Thewalt, J. J. L. Morton, H. Riemann, N. V. Abrosimov, P. Becker, and H.-J. Pohl, Science 336, 1280 (2012).
- Morello et al. (2010) A. Morello, J. J. Pla, F. A. Zwanenburg, K. W. Chan, K. Y. Tan, H. Huebl, M. Möttönen, C. D. Nugroho, C. Yang, J. A. v. Donkelaar, A. D. C. Alves, D. N. Jamieson, C. C. Escott, L. C. L. Hollenberg, R. G. Clark, and A. S. Dzurak, Nature 467, 687 (2010).
- Pla et al. (2013) J. J. Pla, K. Y. Tan, J. P. Dehollain, W. H. Lim, J. J. L. Morton, F. A. Zwanenburg, D. N. Jamieson, A. S. Dzurak, and A. Morello, Nature 496, 334 (2013).
- Morishita et al. (2009) H. Morishita, L. S. Vlasenko, H. Tanaka, K. Semba, K. Sawano, Y. Shiraki, M. Eto, and K. M. Itoh, Phys. Rev. B 80, 205206 (2009).
- Franke et al. (2014) D. P. Franke, F. Hoehne, L. S. Vlasenko, K. M. Itoh, and M. S. Brandt, Phys. Rev. B 89, 195207 (2014).
- Dreher et al. (2015) L. Dreher, F. Hoehne, H. Morishita, H. Huebl, M. Stutzmann, K. M. Itoh, and M. S. Brandt, Phys. Rev. B 91, 075314 (2015).
- Tyryshkin et al. (2003) A. M. Tyryshkin, S. A. Lyon, A. V. Astashkin, and A. M. Raitsimring, Phys. Rev. B 68, 193207 (2003).
- Tyryshkin et al. (2012) A. M. Tyryshkin, S. Tojo, J. J. L. Morton, H. Riemann, N. V. Abrosimov, P. Becker, H.-J. Pohl, T. Schenkel, M. L. W. Thewalt, K. M. Itoh, and S. A. Lyon, Nat. Mater. 11, 143 (2012).
- Saeedi et al. (2013) K. Saeedi, S. Simmons, J. Z. Salvail, P. Dluhy, H. Riemann, N. V. Abrosimov, P. Becker, H.-J. Pohl, J. J. L. Morton, and M. L. W. Thewalt, Science 342, 830 (2013).
- Itoh and Watanabe (2014) K. M. Itoh and H. Watanabe, MRS Commun. 4, 143 (2014).
- Bradbury et al. (2006) F. R. Bradbury, A. M. Tyryshkin, G. Sabouret, J. Bokor, T. Schenkel, and S. A. Lyon, Phys. Rev. Lett. 97, 176404 (2006).
- Lo et al. (2014) C. C. Lo, S. Simmons, R. L. Nardo, C. D. Weis, A. M. Tyryshkin, J. Meijer, D. Rogalla, S. A. Lyon, J. Bokor, T. Schenkel, and J. J. L. Morton, Appl. Phys. Lett. 104, 193502 (2014).
- Wolfowicz et al. (2014) G. Wolfowicz, M. Urdampilleta, M. L. W. Thewalt, H. Riemann, N. V. Abrosimov, P. Becker, H.-J. Pohl, and J. J. L. Morton, Phys. Rev. Lett. 113, 157601 (2014).
- Laucht et al. (2015) A. Laucht, J. T. Muhonen, F. A. Mohiyaddin, R. Kalra, J. P. Dehollain, S. Freer, F. E. Hudson, M. Veldhorst, R. Rahman, G. Klimeck, K. M. Itoh, D. N. Jamieson, J. C. McCallum, A. S. Dzurak, and A. Morello, Sci. Adv. 1, e1500022 (2015).
- Hoehne et al. (2013) F. Hoehne, L. Dreher, M. Suckert, D. P. Franke, M. Stutzmann, and M. S. Brandt, Phys. Rev. B 88, 155301 (2013).
- Dreher et al. (2012) L. Dreher, F. Hoehne, M. Stutzmann, and M. S. Brandt, Phys. Rev. Lett. 108, 027602 (2012).
- Hoehne et al. (2015) F. Hoehne, L. Dreher, D. P. Franke, M. Stutzmann, L. S. Vlasenko, K. M. Itoh, and M. S. Brandt, Phys. Rev. Lett. 114, 117602 (2015).
- Karaiskaj et al. (2001) D. Karaiskaj, M. L. W. Thewalt, T. Ruf, M. Cardona, H.-J. Pohl, G. G. Deviatych, P. G. Sennikov, and H. Riemann, Phys. Rev. Lett. 86, 6010 (2001).
- Yang et al. (2006) A. Yang, M. Steger, D. Karaiskaj, M. L. W. Thewalt, M. Cardona, K. M. Itoh, H. Riemann, N. V. Abrosimov, M. F. Churbanov, A. V. Gusev, A. D. Bulanov, A. K. Kaliteevskii, O. N. Godisov, P. Becker, H.-J. Pohl, J. W. Ager, and E. E. Haller, Phys. Rev. Lett. 97, 227401 (2006).
- Yang et al. (2009) A. Yang, M. Steger, T. Sekiguchi, M. L. W. Thewalt, T. D. Ladd, K. M. Itoh, H. Riemann, N. V. Abrosimov, P. Becker, and H.-J. Pohl, Phys. Rev. Lett. 102, 257401 (2009).
- Steger et al. (2011) M. Steger, T. Sekiguchi, A. Yang, K. Saeedi, M. E. Hayden, M. L. W. Thewalt, K. M. Itoh, H. Riemann, N. V. Abrosimov, P. Becker, and H.-J. Pohl, J. Appl. Phys. 109, 102411 (2011).
- Salvail et al. (2015) J. Z. Salvail, P. Dluhy, K. J. Morse, M. Szech, K. Saeedi, J. Huber, H. Riemann, N. V. Abrosimov, P. Becker, H.-J. Pohl, and M. L. W. Thewalt, Phys. Rev. B 92, 195203 (2015).
- Kaminskii et al. (1980) A. S. Kaminskii, V. Karasyuk, and Y. E. Pokrovskii, Sov. Phys. JETP, 52, 211 (1980).
- Thewalt et al. (2007) M. L. W. Thewalt, A. Yang, M. Steger, D. Karaiskaj, M. Cardona, H. Riemann, N. V. Abrosimov, A. V. Gusev, A. D. Bulanov, I. D. Kovalev, A. K. Kaliteevskii, O. N. Godisov, P. Becker, H. J. Pohl, E. E. Haller, J. W. Ager III, and K. M. Itoh, J. Appl. Phys. 101, 081724 (2007).
- Overhauser (1953) A. W. Overhauser, Phys. Rev. 92, 411 (1953).
- Feher and Gere (1959) G. Feher and E. A. Gere, Phys. Rev. 114, 1245 (1959).
- Dluhy et al. (2015) P. Dluhy, J. Z. Salvail, K. Saeedi, M. L. W. Thewalt, and S. Simmons, Phys. Rev. B 91, 195206 (2015).
- Lo et al. (2015) C. C. Lo, M. Urdampilleta, P. Ross, M. F. Gonzalez-Zalba, J. Mansir, S. A. Lyon, M. L. W. Thewalt, and J. J. L. Morton, Nat. Mater. 14, 490 (2015).
- Feher (1959a) G. Feher, Phys. Rev. 114, 1219 (1959a).
- Breiland et al. (1973) W. G. Breiland, C. B. Harris, and A. Pines, Phys. Rev. Lett. 30, 158 (1973).
- Huebl et al. (2008) H. Huebl, F. Hoehne, B. Grolik, A. R. Stegner, M. Stutzmann, and M. S. Brandt, Phys. Rev. Lett. 100, 177602 (2008).
- Feher (1959b) G. Feher, J. Phys. Chem. Solids 8, 486 (1959b).
- Hale and Mieher (1969) E. B. Hale and R. L. Mieher, Phys. Rev. 184, 751 (1969).
- Tyryshkin et al. (2006) A. M. Tyryshkin, J. J. L. Morton, A. Ardavan, and S. A. Lyon, J. Chem. Phys. 124, 234508 (2006).
- Morton et al. (2008) J. J. L. Morton, A. M. Tyryshkin, R. M. Brown, S. Shankar, B. W. Lovett, A. Ardavan, T. Schenkel, E. E. Haller, J. W. Ager, and S. A. Lyon, Nature 455, 1085 (2008).
- George et al. (2010) R. E. George, W. Witzel, H. Riemann, N. V. Abrosimov, N. Notzel, M. L. W. Thewalt, and J. J. L. Morton, Phys. Rev. Lett. 105, 067601 (2010).
- Morley et al. (2010) G. W. Morley, M. Warner, A. M. Stoneham, P. T. Greenland, J. van Tol, C. W. M. Kay, and G. Aeppli, Nat. Mater. 9, 725 (2010).
- Simmons et al. (2011) S. Simmons, R. M. Brown, H. Riemann, N. V. Abrosimov, P. Becker, H.-J. Pohl, M. L. W. Thewalt, K. M. Itoh, and J. J. L. Morton, Nature 470, 69 (2011).
- Stich et al. (1996) B. Stich, S. Greulich-Weber, and J.-M. Spaeth, Appl. Phys. Lett. 68, 1102 (1996).
- Hoehne et al. (2011) F. Hoehne, L. Dreher, H. Huebl, M. Stutzmann, and M. S. Brandt, Phys. Rev. Lett. 106, 187601 (2011).
- Carr and Purcell (1954) H. Y. Carr and E. M. Purcell, Phys. Rev. 94, 630 (1954).
- Medford et al. (2012) J. Medford, L. Cywinski, C. Barthel, C. M. Marcus, M. P. Hanson, and A. C. Gossard, Phys. Rev. Lett. 108, 086802 (2012).
- Castner (1963) T. G. Castner, Phys. Rev. 130, 58 (1963).
- Hartmann and Hahn (1962) S. R. Hartmann and E. L. Hahn, Phys. Rev. 128, 2042 (1962).
- Abragam and Goldman (1978) A. Abragam and M. Goldman, Rep. Prog. Phys. 41, 395 (1978).
- Can et al. (2015) T. V. Can, J. J. Walish, T. M. Swager, and R. G. Griffin, J. Chem. Phys. 143, 054201 (2015).