A Search for O2 in CO-depleted Molecular Cloud Cores with Herschel
Abstract
The general lack of molecular oxygen in molecular clouds is an outstanding problem in astrochemistry. Extensive searches with SWAS, Odin and Herschel have only produced two detections; upper limits to the O2 abundance in the remaining sources observed are about 1000 times lower than predicted by chemical models.
Previous atomic oxygen observations and inferences from observations of other molecules indicated that high abundances of O atoms might be present in dense cores exhibiting large amounts of CO depletion. Theoretical arguments concerning the oxygen gas-grain interaction in cold dense cores suggested that, if O atoms could survive in the gas after most of the rest of the heavy molecular material has frozen out on to dust, then O2 could be formed efficiently in the gas. Using Herschel HIFI we searched a small sample of four depletion cores - L1544, L694-2, L429, Oph D - for emission in the low excitation O2 NJ=33–12 line at 487.249 GHz. Molecular oxygen was not detected and we derive upper limits to its abundance in the range N(O2)/N(H2). We discuss the absence of O2 in the light of recent laboratory and observational studies.
1 Introduction
Molecular oxygen has proven to be the most elusive molecule in the interstellar medium. Gas-phase chemical models predict that dense molecular gas (with hydrogen number densities 103–10) should contain large fractional abundances of O2 (10-6–10-5) after 105 years (e.g. Leung et al., 1984; Bergin et al., 2000). However, extensive searches in various astronomical environments by Herschel111Herschel is an ESA space observatory with science instruments provided by European-led Principal Investigator consortia and with important participation from NASA., the Submillimeter Astronomical Satellite (SWAS) and Odin (with respective beam sizes of 1′, 4′and 9′), have demonstrated that O2 emission is extremely rare in molecular clouds. SWAS and Odin observations of molecular clouds constrained the O2 abundance limits to lie in the range (0.8–7)10-7 (Goldsmith et al., 2000; Pagani et al., 2003). Tentative detections by SWAS (Goldsmith et al., 2002), and from ground-based observations of the 16O18O isotopologue (Pagani et al., 1993), both remain unconfirmed (Pagani et al., 2003; Fuente et al., 1993; Marechal et al., 1997). Upper limits on the abundance of solid O2 tend to rule out the possibility that the missing O2 is hidden in icy grain mantles (Vandenbussche et al., 1999).
The SWAS and Odin limits on O2 abundance are several hundred times less than predicted in chemical models. Herschel observations have pushed these limits down even more, to lie in the range (0.1–5)10-8 for many sources (Goldsmith et al., 2011b). Thus far, O2 has only been securely detected in Orion (Goldsmith et al., 2011a) and Oph A (Larsson et al., 2007; Liseau et al., 2012).
Several theoretical explanations have been advanced to explain the low O2 abundances (as summarised by Roberts & Herbst, 2002), but calculations show that, most probably, the simple process of oxygen atom accretion and ice formation on cold dust grains is responsible (Bergin et al., 2000; Charnley et al., 2001; Viti et al., 2001; Roberts & Herbst, 2002). These models show that, for cloud ages 105 years, once CO formation is complete, significant O depletion is necessary to prevent the O2 abundance from violating the observed limits. However, it is generally unknown if the elemental abundance of oxygen in the observed molecular clouds is consistent with this explanation. Observations and theoretical models available at the time of the Herschel mission indicated that O atoms might be transiently much more abundant than CO (and C atoms) in some dense cores, and so produce large abundances of O2 in them. In this paper we report the results of a Herschel HIFI search for O2 in four cores that exhibit high degrees of CO depletion. Molecular oxygen was not detected and we provide upper limits.
2 Oxygen in Dense Molecular Clouds
Our search for molecular oxygen was based on the state of observational and laboratory knowledge at the time of the Herschel mission.
2.1 Atomic Oxygen
Molecular oxygen is easy to form in both warm and cold dense gas through the neutral-neutral process
| (1) |
and is rapidly destroyed in the chemical reaction with atomic carbon
| (2) |
Once the conversion is almost complete (105 years), the O2 abundance rises rapidly on a short time-scale. Collisions of O atoms with cold dust, leading to the formation and retention of water ice, can occur on a comparable time-scale and so inhibit interstellar O2 production. However, there is no direct evidence for low O abundances in cold clouds. In fact, large O/CO ratio have been measured in several sources, e.g. O/CO15 towards W49N (Vastel et al., 2000); where it has been attributed to selective CO depletion on grains. High fractional abundances , 10-4, have also been measured in the collapsing envelope of the low-mass binary system IRAS 16293-2422 (Ceccarelli et al., 2000).
L1544 belongs to a family of cold starless cores in which CO molecules have been depleted from the gas (Bergin et al., 2002; Bacmann et al., 2002; Crapsi et al., 2005; Bergin & Tafalla, 2007). Caselli et al. (2002) modelled the ionization of L1544, as determined from observations of , and their deuterated isotopologues, and concluded that a large fractional abundance of O of 10-4 must be present to destroy there, despite CO being significantly depleted on to dust. Gupta et al. (2009) detected and in the CO-depleted region of L1544. Subsequent modeling by Cordiner & Charnley (2012) determined that a similarly high gas-phase O abundance was required to destroy and so account for the observed anion/neutral abundance ratio in this core, as well as in others that also show CO depletion (e.g. L1512). In L1544, and other dense cores, some carbon-bearing molecules (CN, HCN, HNC) are also present in the CO-depleted gas (Hily-Blant et al., 2010; Padovani et al., 2011) but at abundances much less than found in normal dark cloud gas, supporting the idea that C atoms are not particularly abundant in the gas.
In summary, there is some observational evidence that suggest oxygen atoms may not freeze out efficiently in some dense cores, even when CO and some other heavy molecules (e.g. CS) do. This, and the fact that the abundance must also be significantly reduced, raises the possibility that CO-depleted cores could contain large abundances of O2.
2.2 Gas-grain Chemistry of O2
Could O2 form in CO-depletion cores and be detectable? Here we demonstrate that this is theoretically possible. Models of O2 suppression have simply assumed that gas phase O atoms are hydrogenated to form H2O ices (and so removed) at the rates at which they collide and stick to grains (e.g. Bergin et al., 2000; Viti et al., 2001; Charnley et al., 2001; Roberts & Herbst, 2002); experiments have confirmed the viability of this ice formation pathway (Dulieu et al., 2010). However, to maintain a population of O atoms in gas where CO is freezing out requires that collisions of oxygen atoms with cold grains do not result in 100% retention on the surface. Maret et al. (2006) have shown that the CO-depletion core B68 contains a significant abundance of N atoms as well as N2 molecules and so it is reasonable to inquire whether this could also occur for O atoms.
Assumptions have been made in previous chemical models that could allow the return of O atoms to the gas at non-negligible rates (e.g. Hasegawa & Herbst, 1993; Willacy & Williams, 1993; Charnley et al., 2001; Viti et al., 2001; Caselli et al., 2002; Charnley & Rodgers, 2002; Flower et al., 2005; Crapsi et al., 2005) and include: (i) lower than expected binding energies on the relevant surface, = 600 K, (cf. 800 K, Tielens & Allamandola, 1987), or (ii) a low sticking efficiency, or (iii) a variety of non-thermal desorption processes such as photodesorption or cosmic ray impacts (Leger et al., 1985), or (iv) desorption induced by H2 formation (Willacy & Millar, 1998). Thus, accepting that at least one of the above assumptions holds, it is feasible for an accreted O atom to desorb from a cold grain. However, since clearly some oxygen atoms must be retained on grains, the gas-grain kinetics of O atoms and CO molecules has to incorporate some degree of selective retention on the dust.
Hollenbach et al. (2009) have presented a model for photodissociation regions (PDRs), in which the O atoms can be thermally desorbed, and which treats water formation in a more kinetically realistic manner. On the grain surface, H atom addition first converts O to OH, and these hydroxyl molecules can then form hydrogen bonds with pre-existing water molecules; if an O atom does not meet a surface H atom there is a finite probability that it will desorb and return to the gas. The strengths of hydrogen bonds are typically at least a factor of ten greater than those for van der Waals (physisorption) bonding, and it is this chemical fixing which controls the rate at which gaseous O can become depleted on grains and suppress O2 production. Thus, O accretion onto grains by fixing, as opposed to simply sticking at the gas-grain collision rate, depends on the gas phase atomic O/H ratio, and is at its most efficient when the accreting gas has O/H1, and least so when oxygen atoms are more abundant than hydrogen atoms, i.e. when O/H1.
This naturally introduces a dependence on the density of the accreting gas. Because O removal explicitly depends on the H atom kinetics, water ice formation can occur easily at low densities (104 cm-3 or less) where O/H1 and the H/H2 ratio has not yet reached a steady-state (corresponding to , Goldsmith & Li, 2005). However, higher densities, (H2), lead to an increased O/H ratio (1), as H atoms are more efficiently converted to H2 on grains, and consequently to less efficient O removal. CO freeze-out in cold cores (5–10 K) becomes apparent at hydrogen densities in the range (H2)1.5104–6105 cm-3 (Jørgensen et al., 2005), and so is concomitant with O/H1. Thus, counterintuitively, the central regions of dense cores exhibiting significant CO depletion may contain large abundances of O2 (10-6–10-5).
An important point is that, at about 10 K, this O2 will not react with H or any of its deuterated isotopologues, and so would not affect the observed ionization or D/H enhancements found in these regions. The failure of previous searches for O2 towards starless cores could then be attributed to not studying cores of sufficiently high CO depletion (L183 only has (CO)5, Pagani et al., 2005), misalignment of the telescope beam with the depletion peak (2′N of the TMC-2 position targeted by Fuente et al., 1993), beam dilution (SWAS and Odin, Goldsmith et al., 2000; Pagani et al., 2003), or some combination of the above.
N2 freeze-out appears to set in at densities of (H2)106 cm-3 above that of CO (Belloche & André, 2004; Pagani et al., 2005, 2012). The cause of his selective depletion in cold cores is poorly understood (Bergin & Tafalla, 2007) but is unlikely to be connected to the difference in physisorption binding energies; these are measured to be very close: 855 K for CO and 790 K for N2 (Öberg et al., 2005). Similarly, the measured O2 binding energy of 912 K (Acharyya et al., 2007) is sufficiently close to those of CO and N2 that it is uncertain whether O2 could exhibit selective depletion more like CO or N2 at high densities. If the observed CO/N2 depletion is connected to the fact that these homonuclear diatomic molecules are nonpolar (Masel, 1996), then it might be expected that O2 will persist after CO has become depleted, up to the density where N2 is depleted, and perhaps beyond.
3 Herschel Observations
In order to test whether O2 abundances could be be significantly enhanced in high density depletion cores, we used the HIFI instrument (de Graauw et al., 2010) on-board the Herschel Space Observatory (Pilbratt et al., 2010) to observe the NJ=33–12 O2 line at 487.249 GHz towards a sample of such sources, listed in Table 1.
| RA (J2000.0) | Dec (J2000.0) | Obs Id | ||
|---|---|---|---|---|
| Source | ( h m s ) | ( ∘ ′ ″ ) | (km s-1) | |
| L429 | 18 17 05.1 | -08 13 40 | 6.7 | 1342251645 |
| Oph D | 16 28 28.9 | -24 19 19 | 3.5 | 1342250734 |
| L1544 | 05 04 16.6 | +25 10 48 | 7.2 | 1342250746 |
| L694-2 | 19 41 04.5 | +10 57 02 | 9.6 | 1342245385 |
The sources were selected based on the known correlation between enhanced abundances of deuterated molecules and high CO depletion, and are the ones showing the highest CO depletion factors, , in the surveys of H2D+, N2H+ and N2D+ in starless cores by Crapsi et al. (2005) and Caselli et al. (2008). Observations targeted the N2D+ emission peaks in the maps by Crapsi et al. (2005), which can be significantly offset from continuum core positions, but better tracing the depletion cores. Note that gas densities and temperatures in these cores are typically (H cm-3 and 10 K, which makes the 487.249 GHz line (=26 K) the most favourable one to observe in emission with HIFI, and collision rates fast enough for the fractional population of all energy levels to be well described by a Boltzmann distribution at the kinetic temperature.
The dual beam switching mode was employed with the LO frequency in HIFI band 1a set to 494.93 GHz in both L and R polarisation, placing the line in the lower side band. Both the Wide-Band Spectrometer (WBS) and the High Resolution Spectrometer (HRS) were used, and because emission lines from the region are known to be narrow (N2D+ FWHM 0.2-0.4 km s-1) the HRS was configured to high resolution mode with a band width of 230 MHz, corresponding to a spectral resolution of 125 kHz, or 0.08 km s-1 at this frequency. Observations were performed under observing program OT2_ewirst01_1 and the data presented here is available from the Herschel Science Archive222http://archives.esac.esa.int/hda/ui/ (HSA) under observing IDs given in Table 1.
The beam FWHM is 44 at this frequency, the forward efficiency = 96%, and the main-beam efficiency = 76%. Detailed information about the HIFI calibration including beam efficiency, mixer sideband ratio, pointing, etc., can be found on the Herschel web site333http://herschel.esac.esa.int/. The in-flight performance is described by Roelfsema et al. (2012).
Spectra of both polarisations were reduced separately using the Herschel Interactive Processing Environment (Ott, 2010). Subsequently, data FITS files were exported to the spectral analysis software XS444Developed by Per Bergman at Onsala Space Observatory, Sweden; http://www.chalmers.se/rss/oso-en/observations/data-reduction-software for further reduction and analysis. After linear baseline subtraction and frequency alignment, the two polarisations for each observing ID and spectrometer were averaged together, weighted by rms noise. Pointing offsets between polarisations were within 7, i.e., less than 20% of the beam size.
4 Results and analysis
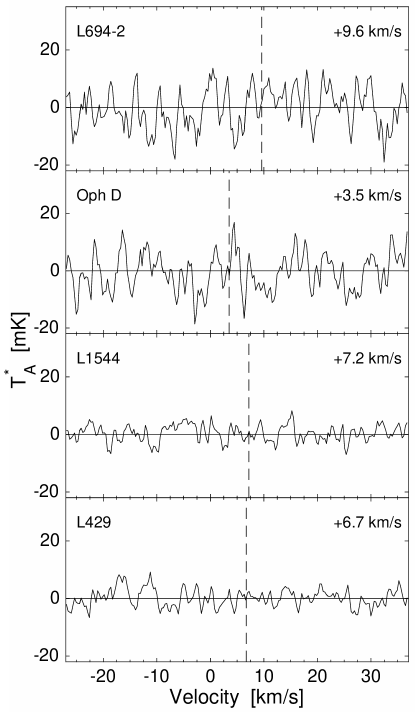
Figure 1 shows the observed Herschel HIFI Wide Band Spectrometer (WBS) polarization-averaged spectra towards the four sources in this study. Linear baselines have been subtracted and the resulting noise rms varies between 3–7 mK.
Molecular oxygen was not detected towards any of the cores. Before further analysis, spectra were multiplied by the total efficiency factor of /=1.27 (HIFI Observers’ Manual version 2.4) in order to get them on the scale. For estimates of the O2 abundance upper limits the non-LTE radiative transfer code RADEX was used to model the level populations of O2 molecules and 3 line intensity upper limits. The spectroscopic data were adapted from Drouin et al. (2010) and collision rates with H2 scaled from He + O2 collision rates of Lique (2010). Physical conditions of the cores, listed in Table 2, were adapted from Caselli et al. (2008), while line widths were taken to be the same as for N2D+.
| Source | (H2)a | (H2)a | (O2)c | (O2) | (O2)d | ||||
|---|---|---|---|---|---|---|---|---|---|
| cm-3 | K | km s-1 | cm-2 | cm-2 | |||||
| L429 | 6e5 | 7 | 20 | 0.4 | 1.2e23 | 1.1e16 | 9.2e-8 | 0.25 | 1.2e-6 |
| Oph D | 5e5 | 7 | 19 | 0.2 | 1.1e23 | 1.2e16 | 1.1e-7 | 0.32 | 1.3e-6 |
| L1544 | 2e6 | 7 | 19 | 0.3 | 1.3e23 | 8.2e15 | 6.3e-8 | 0.17 | 1.6e-6 |
| L694-2 | 9e5 | 7 | 16 | 0.3 | 1.1e23 | 1.8e16 | 1.6e-7 | 0.46 | 1.3e-6 |
Table 2 presents the beam averaged upper limits on O2 column densities based on these calculations, and upper abundance limits to O2/H2 in the range (0.6 – 1.6)10-7, assuming a constant H2 column density over an area larger than the beam.
If the O2 gas is only present in the inner, most CO-depleted parts of the cores, the emission would be significantly diluted in the large HIFI beam, and higher abundances could remain undetected. For example, assuming Gaussian O2 source distributions with half intensities close to the 90% contours of the N2D+ maps by Crapsi et al. (2005), the abundance limits are instead of the order of 10-6, see Table 2 for corresponding beam dilution factors and abundances.
5 Discussion
Recent experiments indicate a much higher physisorption binding energy for O atoms on amorphous water ice (1660 K; He et al., 2015). This is almost twice the value previously considered in chemical models (800 K, Tielens & Allamandola, 1987) and was in fact suggested by Hollenbach et al. (2009). Model calculations confirm that, in the case of PDRs, higher O atom sticking efficiencies lead to a significant reduction in the gas phase O2 abundance (He et al., 2015).
The inferred low abundance of atomic oxygen in L1544 is consistent with the low gaseous H2O abundance measured by Caselli et al. (2012) since higher O atom abundances would also produce more water (e.g. Bergin et al., 2000). Experiments show that O atoms could diffuse on grain surfaces faster than by pure thermal hopping (Minissale et al., 2014) and so, when O/H1 in the accreting gas, reactions between O atoms (Tielens & Hagen, 1982) could form solid O2 efficiently (cf. Charnley, 2005), although some may be hydrogenated to H2O (Ioppolo et al., 2008; Oba et al., 2009). Photodesorption of this O2 would be dissociative (Fayolle et al., 2013) and would not increase the O2 abundance in the gas of, say, L1544. However, competition for binding sites between these O2 molecules and CO molecules arriving on the surface could lead to their ejection into the gas (Noble et al., 2015). Our O2 non-detections could therefore place limits on these processes in CO-depleted cores.
We did not detect molecular oxygen at abundances as high as in the survey of depletion cores. The derived upper limits of 10-7 or less are similar to those obtained elsewhere. Yıldız et al. (2013) determined O2/H in NGC 1333 IRAS 4A although there is a tentative O2 detection in the surrounding cloud material. A low value for O2/H2 of has been detected in Oph A by Liseau et al. (2012). The widespread distribution of D-enriched formaldehyde and the detection of H2O2 in Oph A (Bergman et al., 2011a, b) both support the idea that the O2 could be present following the evaporation of ice mantles from dust grains. A search for H2O2 in Orion was unsuccessful (Liseau & Larsson, 2015) although the upper limits for hydrogen peroxide in interstellar ices, H2O2/H2O, do not rule out it being quite abundant on dust grains (Smith et al., 2011). In Orion, the O2 emission is confined to the H2 Peak 1 position and the originally reported abundance ratio was O2/H (Goldsmith et al., 2011b). A combination of postshock chemistry in a UV-illuminated MHD shock wave with a fortuitous line-of-sight can account for the presence of O2 in Orion, and suggest that the O2 abundance could possibly be even higher 10-5–10-4 (Chen et al., 2014; Melnick & Kaufman, 2015). In Sgr A, Sandqvist et al. (2015) find O2/H but also suggest that higher abundances, O2/H, could exist in foreground clouds.
In conclusion, as with much of the dense interstellar medium, O2 is underabundant in CO-depletion cores, most probably due to a large degree of O atom freezout to form water ice. The reasons why it remains so generally underabundant and yet is detectable in a few sources remains a mystery. Nevertheless, understanding the interstellar O2 deficiency can shed light on many poorly understood issues in astrochemistry (Melnick et al., 2012).
References
- Acharyya et al. (2007) Acharyya, K., Fuchs, G. W., Fraser, H. J., van Dishoeck, E. F., & Linnartz, H. 2007, A&A, 466, 1005
- Bacmann et al. (2002) Bacmann, A., Lefloch, B., Ceccarelli, C., et al. 2002, A&A, 389, L6
- Belloche & André (2004) Belloche, A., & André, P. 2004, A&A, 419, L35
- Bergin et al. (2002) Bergin, E. A., Alves, J., Huard, T., & Lada, C. J. 2002, ApJ, 570, L101
- Bergin & Tafalla (2007) Bergin, E. A., & Tafalla, M. 2007, ARA&A, 45, 339
- Bergin et al. (2000) Bergin, E. A., Melnick, G. J., Stauffer, J. R., et al. 2000, ApJ, 539, L129
- Bergman et al. (2011a) Bergman, P., Parise, B., Liseau, R., & Larsson, B. 2011a, A&A, 527, A39
- Bergman et al. (2011b) Bergman, P., Parise, B., Liseau, R., et al. 2011b, A&A, 531, L8
- Caselli et al. (2008) Caselli, P., Vastel, C., Ceccarelli, C., et al. 2008, A&A, 492, 703
- Caselli et al. (2002) Caselli, P., Walmsley, C. M., Zucconi, A., et al. 2002, ApJ, 565, 344
- Caselli et al. (2012) Caselli, P., Keto, E., Bergin, E. A., et al. 2012, ApJ, 759, L37
- Caux et al. (1999) Caux, E., Ceccarelli, C., Castets, A., et al. 1999, A&A, 347, L1
- Ceccarelli et al. (2000) Ceccarelli, C., Castets, A., Caux, E., et al. 2000, A&A, 355, 1129
- Charnley (2005) Charnley, S. B. 2005, Advances in Space Research, 36, 132
- Charnley & Rodgers (2002) Charnley, S. B., & Rodgers, S. D. 2002, ApJ, 569, L133
- Charnley et al. (2001) Charnley, S. B., Rodgers, S. D., & Ehrenfreund, P. 2001, A&A, 378, 1024
- Chen et al. (2014) Chen, J.-H., Goldsmith, P. F., Viti, S., et al. 2014, ApJ, 793, 111
- Cordiner & Charnley (2012) Cordiner, M. A., & Charnley, S. B. 2012, ApJ, 749, 120
- Crapsi et al. (2005) Crapsi, A., Caselli, P., Walmsley, C. M., et al. 2005, ApJ, 619, 379
- de Graauw et al. (2010) de Graauw, T., Helmich, F. P., Phillips, T. G., et al. 2010, A&A, 518, L6
- Drouin et al. (2010) Drouin, B. J., Yu, S., Miller, C. E., et al. 2010, J. Quant. Spec. Radiat. Transf., 111, 1167
- Dulieu et al. (2010) Dulieu, F., Amiaud, L., Congiu, E., et al. 2010, A&A, 512, A30
- Fayolle et al. (2013) Fayolle, E. C., Bertin, M., Romanzin, C., et al. 2013, A&A, 556, A122
- Flower et al. (2005) Flower, D. R., Pineau Des Forêts, G., & Walmsley, C. M. 2005, A&A, 436, 933
- Fuente et al. (1993) Fuente, A., Cernicharo, J., Garcia-Burillo, S., & Tejero, J. 1993, A&A, 275, 558
- Goldsmith & Li (2005) Goldsmith, P. F., & Li, D. 2005, ApJ, 622, 938
- Goldsmith et al. (2002) Goldsmith, P. F., Li, D., Bergin, E. A., et al. 2002, ApJ, 576, 814
- Goldsmith et al. (2000) Goldsmith, P. F., Melnick, G. J., Bergin, E. A., et al. 2000, ApJ, 539, L123
- Goldsmith et al. (2011a) Goldsmith, P. F., Liseau, R., Bell, T. A., et al. 2011a, ApJ, 737, 96
- Goldsmith et al. (2011b) Goldsmith, P. F., Liseau, R., Bell, T. A., et al. 2011b, in IAU Symposium, Vol. 280, The Molecular Universe, ed. J. Cernicharo & R. Bachiller
- Gupta et al. (2009) Gupta, H., Gottlieb, C. A., McCarthy, M. C., & Thaddeus, P. 2009, ApJ, 691, 1494
- Hasegawa & Herbst (1993) Hasegawa, T. I., & Herbst, E. 1993, MNRAS, 261, 83
- He et al. (2016) He, J., Acharyya, K., & Vidali, G. 2016, ApJ, 823, 56
- He et al. (2015) He, J., Shi, J., Hopkins, T., Vidali, G., & Kaufman, M. J. 2015, ApJ, 801, 120
- Hily-Blant et al. (2010) Hily-Blant, P., Walmsley, M., Pineau Des Forêts, G., & Flower, D. 2010, A&A, 513, A41+
- Hollenbach et al. (2009) Hollenbach, D., Kaufman, M. J., Bergin, E. A., & Melnick, G. J. 2009, ApJ, 690, 1497
- Ioppolo et al. (2008) Ioppolo, S., Cuppen, H. M., Romanzin, C., van Dishoeck, E. F., & Linnartz, H. 2008, ApJ, 686, 1474
- Jørgensen et al. (2005) Jørgensen, J. K., Schöier, F. L., & van Dishoeck, E. F. 2005, A&A, 435, 177
- Larsson et al. (2007) Larsson, B., Liseau, R., Pagani, L., et al. 2007, A&A, 466, 999
- Leger et al. (1985) Leger, A., Jura, M., & Omont, A. 1985, A&A, 144, 147
- Leung et al. (1984) Leung, C. M., Herbst, E., & Huebner, W. F. 1984, ApJS, 56, 231
- Lique (2010) Lique, F. 2010, J. Chem. Phys., 132, 044311
- Liseau & Larsson (2015) Liseau, R., & Larsson, B. 2015, A&A, 583, A53
- Liseau et al. (2012) Liseau, R., Goldsmith, P. F., Larsson, B., et al. 2012, A&A, 541, A73
- Marechal et al. (1997) Marechal, P., Viala, Y. P., & Benayoun, J. J. 1997, A&A, 324, 221
- Maret et al. (2006) Maret, S., Bergin, E. A., & Lada, C. J. 2006, Nature, 442, 425
- Masel (1996) Masel, R. I. 1996, Principles of adsorption and reaction on solid surfaces, Wiley series in chemical engineering (New York, NY: Wiley)
- Melnick & Kaufman (2015) Melnick, G. J., & Kaufman, M. J. 2015, ApJ, 806, 227
- Melnick et al. (2012) Melnick, G. J., Tolls, V., Goldsmith, P. F., et al. 2012, ApJ, 752, 26
- Minissale et al. (2014) Minissale, M., Congiu, E., & Dulieu, F. 2014, J. Chem. Phys., 140, 074705
- Noble et al. (2015) Noble, J. A., Diana, S., & Dulieu, F. 2015, MNRAS, 454, 2636
- Oba et al. (2009) Oba, Y., Miyauchi, N., Hidaka, H., et al. 2009, ApJ, 701, 464
- Öberg et al. (2005) Öberg, K. I., van Broekhuizen, F., Fraser, H. J., et al. 2005, ApJ, 621, L33
- Ott (2010) Ott, S. 2010, in Astronomical Society of the Pacific Conference Series, Vol. 434, Astronomical Data Analysis Software and Systems XIX, ed. Y. Mizumoto, K.-I. Morita, & M. Ohishi, 139
- Padovani et al. (2011) Padovani, M., Walmsley, C. M., Tafalla, M., Hily-Blant, P., & Pineau Des Forêts, G. 2011, A&A, 534, A77
- Pagani et al. (2012) Pagani, L., Bourgoin, A., & Lique, F. 2012, A&A, 548, L4
- Pagani et al. (1993) Pagani, L., Langer, W. D., & Castets, A. 1993, A&A, 274, L13
- Pagani et al. (2005) Pagani, L., Pardo, J.-R., Apponi, A. J., Bacmann, A., & Cabrit, S. 2005, A&A, 429, 181
- Pagani et al. (2003) Pagani, L., Olofsson, A. O. H., Bergman, P., et al. 2003, A&A, 402, L77
- Pilbratt et al. (2010) Pilbratt, G. L., Riedinger, J. R., Passvogel, T., et al. 2010, A&A, 518, L1
- Roberts & Herbst (2002) Roberts, H., & Herbst, E. 2002, A&A, 395, 233
- Roelfsema et al. (2012) Roelfsema, P. R., Helmich, F. P., Teyssier, D., et al. 2012, A&A, 537, A17
- Sandqvist et al. (2015) Sandqvist, A., Larsson, B., Hjalmarson, Å., et al. 2015, A&A, 584, A118
- Smith et al. (2011) Smith, R. L., Pontoppidan, K. M., Young, E. D., & Morris, M. R. 2011, in Lunar and Planetary Inst. Technical Report, Vol. 42, Lunar and Planetary Institute Science Conference Abstracts, 1281
- Tielens & Allamandola (1987) Tielens, A. G. G. M., & Allamandola, L. J. 1987, in Astrophysics and Space Science Library, Vol. 134, Interstellar Processes, ed. D. J. Hollenbach & H. A. Thronson, Jr., 397–469
- Tielens & Hagen (1982) Tielens, A. G. G. M., & Hagen, W. 1982, A&A, 114, 245
- Vandenbussche et al. (1999) Vandenbussche, B., Ehrenfreund, P., Boogert, A. C. A., et al. 1999, A&A, 346, L57
- Vastel et al. (2000) Vastel, C., Caux, E., Ceccarelli, C., et al. 2000, A&A, 357, 994
- Viti et al. (2001) Viti, S., Roueff, E., Hartquist, T. W., Pineau des Forêts, G., & Williams, D. A. 2001, A&A, 370, 557
- Willacy & Millar (1998) Willacy, K., & Millar, T. J. 1998, MNRAS, 298, 562
- Willacy & Williams (1993) Willacy, K., & Williams, D. A. 1993, MNRAS, 260, 635
- Yıldız et al. (2013) Yıldız, U. A., Acharyya, K., Goldsmith, P. F., et al. 2013, A&A, 558, A58