Neon and [C II] 158 m Emission Line Profiles in Dusty Starbursts and Active Galactic Nuclei
Abstract
The sample of 379 extragalactic sources is presented that have mid-infrared, high resolution spectroscopy with the Spitzer Infrared Spectrograph (IRS) and also spectroscopy of the [C II] 158 m line with the Herschel Photodetector Array Camera and Spectrometer (PACS). The emission line profiles of [Ne II] 12.81 m, [Ne III] 15.55 m, and [C II] 158 m are presented, and intrinsic line widths are determined (full width half maximum of Gaussian profiles after instrumental correction). All line profiles together with overlays comparing positions of PACS and IRS observations are made available in the Cornell Atlas of Spitzer IRS Sources (CASSIS). Sources are classified from AGN to starburst based on equivalent widths of the 6.2 m polycyclic aromatic hydrocarbon feature. It is found that intrinsic line widths do not change among classification for [C II], with median widths of 207 km s-1 for AGN, 248 km s-1 for composites, and 233 km s-1 for starbursts. The [Ne II] line widths also do not change with classification, but [Ne III] lines are progressively broader from starburst to AGN. A small number of objects with unusually broad lines or unusual redshift differences in any feature are identified.
Subject headings:
infrared: galaxies — galaxies: starburst— galaxies: active—- galaxies: distances and redshifts—-1. Introduction
Identifying and understanding the initial formation of massive galaxies and quasars in the early universe is a fundamental goal of observational cosmology. A rapidly developing capability for tracing luminosity sources to high redshifts is the observation of the [C II] 158 m emission line at redshifts z 4 using ground based submillimeter interferometers (e.g. Huynh et al., 2013; Wang et al., 2013; Carilli et al., 2013; Banados et al., 2015), with detections now having been made to z = 7. This has long been known as the strongest far-infrared line in most sources (Stacey et al., 1991; Malhotra et al., 1997; Nikola et al., 1998; Luhman et al., 2003; Brauher et al., 2008), often carrying 1% of the total source luminosity, and is thought to be associated with star formation because it should arise within the photodissociation region (PDR) surrounding starbursts (Tielens and Hollenbach, 1985; Helou et al., 2001; Malhotra et al., 2001; Meijerink et al., 2007).
In many high redshift sources, especially dust obscured sources, the [C II] feature is the only diagnostic atomic emission line which can be observed. This makes it vital to optimize use of this line for learning about intrinsic source properties. Not only line luminosities but also accurate line profiles are observed. For example, the submillimeter galaxy in the group BRI 1202-0725 at z = 4.7 has a [C II] FWHM of 700 km s-1 measured with the Atacama Large Millimeter Array, but the associated quasar has FWHM of only 275 km s-1 (Carilli et al., 2013). What can we learn from such differences?
A great amount of diagnostic information concerning the observable differences between dusty, obscured sources powered by active galactic nuclei (AGN) and those powered by rapid star formation (“starbursts”) accumulated with the mid-infrared spectroscopy of the Infrared Spectrograph (IRS; Houck et al. 2004) on the Spitzer Space Telescope (Werner et al., 2004). Classifications of AGN and starburst sources were developed using both the strength of PAH features in low resolution spectra and various emission line ratios in high resolution spectra (e.g. Brandl et al., 2006; Farrah et al., 2007; Desai et al., 2007; Bernard-Salas et al., 2009; Weedman and Houck, 2009; Veilleux et al., 2009; Tommasin et al., 2010; Wu et al., 2010; Sargsyan et al., 2011; Stierwalt et al., 2013; Inami et al., 2013).
More recently, numerous observations of the [C II] line were made (Sargsyan et al., 2012; Farrah et al., 2013; Diaz-Santos et al., 2014; Sargsyan et al., 2014; De Looze et al., 2014; Diaz-Santos et al., 2013) using the Photodetector Array Camera and Spectrometer (PACS) instrument (Poglitsch et al., 2010) on the Herschel Space Observatory (Pilbratt et al., 2010) and included many sources that had previously been observed by the IRS. Our own previous studies were specifically designed to compare the [C II] line luminosities to mid-infrared polycyclic aromatic hydrocarbon (PAH) emission features and mid-infrared emission lines observed with the IRS in order to calibrate the star formation rate (SFR) using the [C II] line. We found that [C II] luminosities most closely track [Ne II] luminosities, from which we concluded that the [C II] is showing PDRs associated with the HII regions seen in [Ne II].
The observational study of forbidden emission line profiles has long been a key technique for classifying and understanding active galaxies. The most extensive early studies used the optical [O III] line at 0.50 m, from which a conclusion was reached that the width of this line could generally distinguish AGN and starbursts (Feldman et al., 1982; Whittle, 1985). All conclusions based on optical lines were restricted to sources with little extinction by dust, however, which led to uncertainties in interpreting differences among profiles if different components of sources have different values of extinction. Now that forbidden emission line profiles are available in mid-infrared and far infrared, comparisons can be made without this uncertainty. An initial indication that such line profiles provide interesting results is in the line profile comparisons by Spoon et al. (2013) among 24 ultraluminous infrared galaxies (ULIRGS) with the goal of seeking outflows from AGN.
To evaluate further the utility of the [C II] line for understanding AGN and starbursts, we compare in the present paper the [C II] emission line profiles to the mid-infrared diagnostics for all extragalactic sources which have archival observations available for both PACS [C II] and IRS spectra. This study of line profiles is an extension of previous analyses of total [C II] line fluxes. We present emission line profiles for [C II], [Ne II] 12.81 m, and [Ne III] 15.55 mfor extragalactic sources which have archival observations available for both PACS [C II] and IRS high resolution spectra. Our resulting sample of 379 extragalactic sources includes all sources with both [C II] and IRS high resolution observations, except for nearby extended galaxies for which IRS observations were made in a mapping mode. The latter are omitted because our goal is to understand overall, global properties of sources that would generally be unresolved at high redshift. There are 390 [C II] profiles in our total sample, representing 379 different IRS pointings (the remaining 11 are duplicate [C II] observations made at the same IRS position).
We present the source list and measurements of line widths and redshifts along with overall comparisons among line widths. All of the [C II] line profiles with Gaussian fits are made available in the Cornell Atlas of Spitzer/IRS Sources (CASSIS; Lebouteiller et al. 2011, 2015111http://cassis.sirtf.com. The [C II] profiles are in http://cassis.sirtf.com/herschel. CASSIS is a product of the Infrared Science Center at Cornell University.) Further comparisons with other source properties will be considered in a future paper (in preparation, Samsonyan 2016).
2. Observations
2.1. Sample Selection
Our sample was selected by examining abstracts of Herschel observing programs which described observations of extragalactic emission line sources222http://www.cosmos.esa.int/web/herschel/observations and then studying archival sources from these programs to identify those for which the [C II] line was observed, either in line or range spectroscopy. Once all extragalactic sources with [C II] observations were identified, we searched for these sources in CASSIS to locate sources having high resolution IRS observations, necessary for line profile information. The individual Herschel observing programs and the number of sources taken from each are SDP-esturm-3, DDT-esturm-4, and KPGT-esturm-1(56); KPGT-smadde01-(13); KPOT-pvanderw-1(11); GT1-lspinogl-4 and GT2-lspinogl-6(14); OT1-dfarrah-1 and OT2-dfarrah-5(23); OT1-dweedman-1(112); OT1-larmus-1(136); OT2-tdiazsan-1(4); OT1-lyoung-1(5); OT1-nwerner-1(3); OT1-sveilleu-2(1); OT2-idelooze-1(1); OT2-lsargsyan-1(2); OT2-nnesvadb-3(2); OT2-pguillar-7(5); KPOT-aedge-1(1); and OT1-bweiner-1(1). Although we intended a complete search, it is possible that some sources having both [C II] and IRS high resolution observations have been overlooked. The source list and all results are given in Table 1.
2.2. IRS High Resolution Spectra
A few previous studies have determined line widths from IRS high resolution spectra (Dasyra et al., 2011; Spoon et al., 2013; Inami et al., 2013). These results have all been approximated by applying a uniform estimate of instrumental resolution using the typical resolution of 500 km s-1 for full width half maximum (FWHM) of the instrumental profile listed in the instrument description. For our analysis, we apply two additional steps for improving determination of the instrumental profile. The first is to determine empirical instrumental profiles for individual emission lines, and the second is to apply an “optimal” extraction for the high resolution spectra, which enhances signal to noise (S/N) for unresolved sources. These steps are described below.
Spectral extraction is the process of producing a one dimensional spectrum from the two dimensional images obtained with the IRS detectors. The best possible extraction of unresolved sources applies the point spread function (PSF) of the telescope/spectrograph combination so that the pixels in the cross dispersion direction are weighted by the fraction of source flux which falls on them, thereby reducing background and instrumental noise. This is defined as an “optimal” extraction. These extractions have been implemented for the spectra shown in CASSIS using empirically determined PSFs for both low resolution (Lebouteiller et al., 2011) and high resolution (Lebouteiller et al., 2015). If a source is fully extended over the observing aperture, a better alternative is a full aperture extraction that equally weights all pixels within the aperture. The choices provided in CASSIS for spectral extractions of high resolution IRS spectra are described in detail by Lebouteiller et al. (2015). All previous measures of IRS high resolution spectra have used full aperture extractions, which are provided by the “post-BCD” spectra of the Spitzer Heritage Archive333http://irsa.ipac.caltech.edu/data/SPITZER/docs/spitzerdataarchives/.
For both low resolution and high resolution spectra, the source extent is estimated in CASSIS by noting differences between the source spatial profile compared to the PSF. This estimate is more reliable for low resolution spectra than for high resolution because of the limited spatial profile sampling in high resolution; the PSF has full width half maximum (FWHM) of about 2 pixels compared to the 6 pixel length of the high resolution slits. The majority of our sources are not extended on the scale of the observing aperture, so our final adopted measurements utilize the optimal extraction. For our objective of measuring line profiles, the best possible S/N is crucial in order to obtain the best profiles. This also leads to the choice of optimal extraction even if some flux is underestimated for extended sources.
The extraction labeled as “optimal” in CASSIS uses a simultaneous fitting to the two separate observing nod positions. This option also provides an estimate of the underlying background by using residuals beneath the fitted PSF. Another alternative, “optimal differential”, that differences the two nods before fitting the PSF profile is also given in CASSIS for comparison to aid in removing bad pixels, but this method gives a reliable flux calibration only for unresolved sources. CASSIS illustrates both of the optimal extractions in addition to a full aperture extraction so that users can make a final choice but recommends “optimal” if the source appears spatially unresolved.
The IRS instrumental spectral resolution for the high resolution modes is approximately defined by the two pixel projected width of the observing aperture. Spectral resolution varies among different lines because the IRS high resolution spectrographs are echelle spectrographs with different lines seen in different orders, so resolution increases as the order increases. Because our objective is the best possible measurement of line widths, the instrumental resolutions for the [Ne II] and [Ne III] lines presented in this paper are measured empirically. This is done using spatially unresolved planetary nebulae in which these emission lines are strong. The intrinsic widths of planetary nebula emission lines are much smaller than the IRS instrumental line width so the observed line profiles illustrate the instrumental profile.
The sources used are the planetary nebulae from the Large Magellanic Cloud, Small Magellanic Cloud, and Galactic Halo included in Bernard-Salas et al. (2009b) and Pottasch and Bernard-Salas (2010). Because these planetaries are spatially unresolved, the CASSIS optimal extraction is used to measure the lines. Gaussian fits match the observed profiles well so we adopt instrumental profiles that are Gaussians described by the FWHM of the planetary nebula profiles.
The FWHM and dispersion among individual planetaries is FWHM([Ne II]) = 331 35 km s-1 and FWHM([Ne III]) = 377 35 km s-1 . The somewhat better resolution for [Ne II] 12.81 m is expected, because this line is in short-high order 16 whereas [Ne III] 15.55 m is in order 13. These instrumental line widths were also measured using full aperture extractions; the full aperture extractions give consistent but slightly larger median widths compared to the optimal extractions, 371 km s-1 for [Ne II] and 465 km s-1 for [Ne III]. These differences can be explained by small tilts of the observing slits compared to the dispersion direction of the spectra. The optimal extractions give more weight to the center of the slit where any line smearing from tilt effects is negligible, but the full extractions equally weight flux near the edges, where slit tilts would produce a larger shift of the dispersed image.
Because the optimal extraction is used for sources in this paper, we adopt as the instrumental resolution profile (FWHMres) the values of 331 km s-1 for [Ne II] and 377 km s-1 for [Ne III], with an uncertainty of about 10% for each. The intrinsic FWHMintrinsic of the observed spectral lines in sources are then determined as FWHMintrinsic2 = FWHMobserved2 - FWHMres2.
Redshift measurement for sources depend on the position of the line centroids, which depends on the wavelength calibration of the spectra (“WAVESAMP” files). This calibration is applied differently in optimal and full aperture extraction. To determine any systematic uncertainties arising from the extraction technique, we compared line centroids for the planetary nebulae and find that the 1 dispersion between full aperture and optimal extractions for the Neon lines is 25 km s-1. These results mean that redshift uncertainties arising from different analysis techniques for the high resolution spectra are only 0.00008.
The observed results for line widths from the CASSIS optimal extractions are given in Table 1. All IRS emission lines, including those obtained with the alternative extractions, can be examined within CASSIS by source name or coordinate using the browse tools provided without requiring any downloads of the spectra. The CASSIS results provide the actually observed coordinate of the source, which sometimes differs from the nominal coordinate corresponding to the source name in other data bases. In “cluster” mode for IRS observations, several independent sources may be included within the same Astronomical Observation Request (AOR), and these sources are sometimes components of the same galaxy. For these reasons, it is necessary to use the accurate coordinates from CASSIS for comparisons to locate the PACS spaxel corresponding to the same position, and these coordinates are those in Table 1.
To determine uncertainties in FWHM for line profiles depending on extraction techique, we compared both full aperture and optimal extractions for the [Ne II] and [Ne III] lines in all sources. Line profiles were measured using Gaussian fits to the [Ne II] and [Ne III] emission lines with a first order underlying continuum, fitting with the Spectroscopic Modeling Analysis and Reduction Tool (SMART; Higdon et al. 2004, Lebouteiller et al. 2010). The dispersions among the differences between full aperture and optimal extractions for the same profiles are a measure of the observational uncertainties that arise from independent fitting of undersampled profiles with different Gaussians. For both lines, these dispersions ( 50 km s-1 for [Ne II] and 46 km s-1 for [Ne III]) are 10% of the observed median line width (470 km s-1 for [Ne II] and 512 km s-1 for [Ne III]).
Dispersions are a larger fraction of the measured width for narrower lines so the fractional uncertainty is greater for narrow lines. This effect is an additional reason to prefer optimal extractions for the line measurements. In some cases, the observed FWHM from the best Gaussian fit is smaller than the instrumental resolution, which cannot be physically correct. In these cases, the adopted intrinsic FWHM is arbitrarily listed as 100 km s-1 and displayed at that value in Figures so that these anomalous cases can be recognized. There is an offset in measured FWHM such that the full aperture measures are systematically larger, by 20 km s-1 for [Ne II] and 70 km s-1 for [Ne III]. We attribute this difference to a similar effect as noted above for instrumental resolution - that weighting all pixels of the tilted slit evenly in the full aperture extraction leads to a smearing of the line in direction of dispersion, which artificially increases the line width.
2.3. Herschel PACS [C II] Spectra
The PACS instrument (Poglitsch et al., 2010) simultaneously obtains spectra at 25 positions in a source with square apertures called “spaxels”. If all sources were spatially unresolved and all pointings were perfect, direct comparisons of lines observed with IRS and PACS would be straightforward. Although neither condition is perfectly met for all of these observations, both the IRS slit and a PACS spaxel observe similar fractions of a source. The IRS short wavelength, high resolution observing slit for the Neon lines is 4.7 wide, designed to match approximately the FWHM of the telescope diffraction profile at these wavelengths. The PACS spaxels are 9.4 wide, also nearly equal to the FWHM of the Herschel diffraction profile at the [C II] wavelength. Because of this similarity in fraction of a source observed by the two spectrographs, we compare line profiles seen in the IRS slit to the [C II] profile seen in the single PACS spaxel that is closest in location to the IRS slit, as illustrated in Figure 1.
A factor which might affect profile widths in spatially resolved sources is the size of the emitting region observed by PACS. These sizes vary by a large amount because distances range from 0.05 Mpc to 1003 Mpc. In Table 1, we list the projected sizes of the PACS 9.4″ spaxel based on the angular size distances to the sources. Redshift independent distances are used if these are listed in the NASA/IPAC Extragalactic Database (NED). If not, redshift derived distances are determined from Wright (2006) using H0 = 71 , =0.27 and =0.73. The distribution in projected spaxel size among sources in Table 1 is shown in Figure 2. The distributions illustrate that the PACS results refer primarily to global properties of sources on observed scales of many kpc.
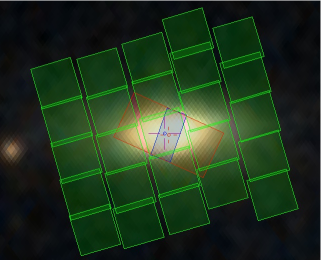

For our studies of line profiles, an important consideration is to match the position of a PACS spaxel to the position of the IRS aperture. We did this individually for each source, producing overlays of PACS spaxels and IRS aperture using the observed positions given in the headers for the final IRS spectra, the coordinates in Table 1. Overlays such as the example in Figure 1 are shown in CASSIS for all of our sources. The individual spaxel corresponding most closely to the position of the IRS aperture is listed in Table 1, using the numbering convention shown in Figure 1, and the profile from this spaxel is the [C II] profile shown in CASSIS.
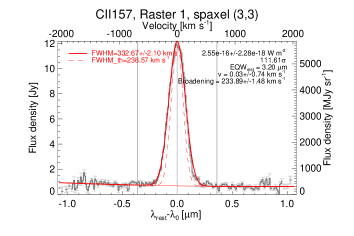
All [C II] observations were reduced with version 12.1.0 of the Herschel Interactive Processing Environment (HIPE), together with the “PACSman” software (Lebouteiller et al., 2012) to fit line profiles and continuum within the spaxels. An illustration of a Gaussian line fit provided by PACSman is in Figure 3, and all profiles which we use are shown for the individual sources in CASSIS, searchable by source name or coordinate. Displaying Gaussian fits is particularly useful for seeking sources which might have a core Gaussian but broad or asymmetric underlying wings (e.g. Janssen et al., 2016). There are 34 sources in our sample for which [C II] was observed but yields a profile with insufficent S/N for an accurate width or radial velocity measurement. These profiles are shown as “no data” in Table 1, but they are illustrated in CASSIS with an attempted Gaussian profile fit at the line position.
As was done for the IRS spectra, we determined an empirical instrumental profile for the [C II] observations. This was done using all 25 spaxels in the observation of the 30 Doradus HII region listed in Table 1, because all spaxels give the same observed FWHM, the intrinsic line widths are small compared to the instrumental resolution, and the intrinsic line widths are known. The observed FWHM among these 25 profiles is 239 km s-1. Internal motions within the HII region have been measured for the optical [O III] 0.50 m line and have median FWHM of 45 km s-1 FWHM at spatial resolutions similar to PACS (Smith and Weedman, 1972). Removing this intrinsic width from the width observed by PACS results in an instrumental FWHM of 236 km s-1. The intrinsic FWHMintrinsic of the observed [C II] lines in sources are then determined as FWHMintrinsic2 = FWHMobserved2 - 2362. The intrinsic widths are listed in Table 1.
3. Analysis of [C II] and Neon Line Profiles
Our primary objective for the present paper is to present the measurements in Table 1 and the profiles in CASSIS, which together provide an observational atlas of [C II] 158 m, [Ne II] 12.81 m, and [Ne III] 15.55 m line widths that can be used for comparing among various properties for a wide variety of sources. Our eventual objective is to understand in more detail what determines line widths in different galaxies. For now, we only use these results to determine if there are trends with classification as AGN or starburst, or any systematic differences among [C II] and mid-infrared Neon lines.
3.1. Comparisons of Line Profile Widths
Previous studies using IRS line widths found some indications that higher ionization lines sometimes show broader widths or outflow effects from AGN, but these effects were found primarily for the high ionization [SIV] and [OIV] lines in a few cases of sources with the broadest lines (Dasyra et al., 2011; Spoon et al., 2013; Inami et al., 2013). We emphasize the lower ionization Neon lines, especially [Ne II] because this line most closely tracks [C II] in comparisons of line fluxes (Sargsyan et al., 2014). These Neon lines are also the best for comparison with previous studies of line profiles of the strongest optical forbidden line, [O III] 0.50 m (Feldman et al., 1982; Whittle, 1985; Nelson and Whittle, 1996), because of similar ionization potentials (21.6 eV to produce Ne II, 41.0 eV to produce Ne III, and 35.1 eV to produce O III.)
The AGN/starburst classification used here, based on strength of the 6.2 m PAH feature, is similar to that used in many previous studies, although different authors use different PAH features and different methods for measuring strength (e.g. Genzel et al., 1998; Laurent et al., 2000; Brandl et al., 2006; Desai et al., 2007; Veilleux et al., 2009; Tommasin et al., 2010; Wu et al., 2010; Sargsyan et al., 2011; Petric et al., 2011; Stierwalt et al., 2013). The essential result used by all of these authors is that the PAH features increase in strength as the starburst component increases although different authors adopt somewhat different definitions of AGN-dominated compared to starburst-dominated. The quantitative divisions illustrated in our results are that AGN have EW(6.2 m) 0.1 m, composite AGN plus starburst have 0.1 m EW(6.2 m) 0.4 m, and starbursts have EW(6.2 m) 0.4 m.
The divisions we use began with an IRS spectroscopic survey of starburst galaxies by Brandl et al. (2006) and in a flux limited IRS survey of sources including all classifications (Houck et al., 2007), subsequently verified by comparison with optical classifications using several hundred IRS spectra (Sargsyan et al., 2011). Our primary motive for using the 6.2 m feature instead of the stronger 11.3 m feature has been to allow classification of sources having sufficiently high redshifts that the 11.3 m feature is not visible in IRS spectra. The strongest PAH complex centered at 7.7 m is not used because this feature can be confused with an apparent spectral peak at similar wavelength arising because of strong absorption on either side of the peak in heavily obscured AGN. By illustrating various parameters regarding line profiles as functions of EW(6.2 m), any trends with AGN/starburst classes are readily seen.
The well established correlation between level of ionization and PAH classification of AGN and starbursts is illustrated in Sargsyan et al. (2014) for various flux ratios among mid-infrared and [C II] emission lines as a function of PAH classification. For our present use, the important result is that the [Ne II] line tracks [C II] independent of classification whereas the higher ionization [Ne III] line is stronger relative to [C II] in AGN than in starbursts. (Ratio of line fluxes for [Ne III]/[Ne II] for the optimal extractions is given in Table 1 for each source.) This implies that the line profiles from [Ne III] should be more affected by the AGN, whereas the [Ne II] and [C II] lines should characterize the starburst component. We first consider, therefore, whether line profiles for these three features show any differences between AGN and starbursts.
Comparisons of AGN/starburst classification with intrinsic line widths (those given in Table 1, after correction for instrumental broadening) are shown in Figures 4, 5, and 6. We think that the most important result is shown in Figure 4 for [C II] because a primary goal of our study is to seek any evidence that the [C II] line width is a diagnostic of AGN/starburst classification. There is no evidence of any trend, however. The medians and dispersions among [C II] line widths in Figure 4 are very similar for all classifications, with medians 207 km s-1 for AGN, 248 km s-1 for composites, and 233 km s-1 for starbursts with dispersions in all cases of about 130 km s-1. The most important result for [C II] in Figure 4, therefore, is that line widths do not change among classification, indicating that [C II] is dominated by the starbursts within any source and not affected by the presence of an AGN. This confirms our conclusions in Sargsyan et al. (2012) and Sargsyan et al. (2014) based only on line fluxes.
The results for [Ne II] in Figure 5 show a similar result to [C II], with only a slight trend of increased widths for AGN; the median FWHM for AGN and composites is 340 km s-1 compared to 300 km s-1 for starbursts. The best comparison with [C II] is for the starbursts to rule out any broadening of [Ne II] by an AGN. For starbursts, the difference between median FWHM of 233 km s-1 for [C II] and 300 km s-1 for [Ne II] is interesting, but we cannot be confident that it is meaningful. This difference is less than the uncertainty in the individual IRS width measures shown in Figure 5. The difference would disappear if we assume a broader instrumental line width for [Ne II] than we have adopted, requiring an instrumental width of 380 km s-1 instead of the 331 km s-1 that is used. This larger value is close to the full aperture instrumental width discussed in section 2.2, but such a large instrumental width would not be appropriate for unresolved sources, which require an optimal extraction. If this larger instrumental width were used, full aperture extractions would also have to be used, and these are systematically larger than the optimal extraction widths that are given in Table 1. The net result would remain that intrinsic widths for [Ne II] are greater than those for [C II]. We must conclude, therefore, that we cannot precisely compare the [C II] widths from PACS with the Neon widths from the IRS because of uncertainties in determining the most accurate extraction procedure for the IRS lines.
Despite these uncertainties among comparisons of [C II] and Neon line widths, the relative widths between the [Ne II] and [Ne III] lines are meaningful. Unlike the [Ne II] FWHM in Figure 5, the [Ne III] FWHM in Figure 6 show a trend for increasing line widths from starbursts through AGN. Both the median values of line widths and upper values of the dispersions are progressively larger from starbursts through composites to AGN, with medians of 289 km s-1 for starbursts, 367 km s-1 for composites, and 426 km s-1 for AGN. Upper values of the observed one dispersions are 417 km s-1 for starbursts, 580 km s-1 for composites, and 748 km s-1 for AGN. This trend for AGN to be offset to larger values of intrinsic [Ne III] line width is independent of the adopted value for [Ne III] instrumental width and demonstrates that some additional [Ne III] line broadening is associated with AGN. This is additional confirmation that we should not expect similar profiles between [C II] and higher ionization features such as [Ne III] because they often arise in different physical regions of sources.


Having confirmed that [C II] and [Ne II] line profiles generally track one another, an additional use of the results in Table 1 is to compare line widths for [C II] and [Ne II] lines to find anomalous sources that are broad in one line but not the other. For example, are there sources where [C II] arises in regions where [Ne II] is not seen, either because of too much extinction or because there is a diffuse [C II] not associated with starbursts? Or, are there sources in which even the low ionization [Ne II] is dominated by the AGN? This comparison is shown in Figure 7. This Figure is used to identify sources with unusually broad features, defined as having FWHM that exceed the median values by two . These sources are noted in Table 1 for further future study.
A similar comparison is also made in Figure 8 between [C II] and [Ne III], although it would be less surprising in this case to find broad [Ne III] associated with an AGN. The few [C II] sources that equal or exceed the [Ne III] width are particularly interesting. Broad profiles seen in this comparison are also noted in Table 1.


3.2. Comparisons of Radial Velocities
An alternative way to seek sources with significant differences between the physical locations of [C II] and Neon emission is to compare observed radial velocities measured in these different features. These comparisons are in Figures 9 and 10. The velocity differences between the profile centroids are given in Table 1, determined from the redshifts measured independently for the [C II] and Neon lines and transformed to velocity units so that . Comparisons of are made to the [C II] FWHM to learn if broader lines have systematically more scatter in measures, although we see no indication of this. From these plots, sources with differing from the medians by more than 2 are selected and noted in Table 1, because these sources may also prove to be unusual. Dispersions in measures between [C II] and Neon are 50 km s-1, or 10% of the observed median FWHM for the Neon lines.
In both Figures 9 and 10, there is little difference in median radial velocities determined from PACS [C II] or IRS Neon. For , the median difference is 21 km s-1 and is 34 km s-1 for . These small systematic differences are a confirmation of the careful wavelength calibrations that were done independently for both instruments. There is a known instrumental effect in PACS which can lead to a skewed profile and offset in velocity. This effect arises when an unresolved source is not perfectly centered in a spaxel 444http://herschel.esac.esa.int/Docs/PACS/pdf/pacs-om.pdf, Figures 4.16 and 4.18 and can produce velocity offsets up to 30 km s-1 for [C II]. This is less than the offsets which we note as unusually large, and offsets caused by this instrumental effect would be recognized by having a skewed profile.


4. Summary and Conclusions
We measure emission line profiles and redshifts for extragalactic sources observed in both [C II] 158 m with Herschel PACS together with [Ne II] 12.81 m and [Ne III] 15.55 m observed with the high resolution Spitzer IRS. Data are presented and compared for 379 different sources. Results for [C II] and Neon are compared by locating the PACS observing spaxel that most closely corresponds to the position of the IRS slit. Intrinsic line profile widths are determined by applying empirically measured instrumental widths from observed planetary nebulae or HII regions. All [C II] and Neon line profiles together with overlays of PACS spaxels compared to IRS slits are illustrated in the CASSIS spectral atlas (http://cassis.sirtf.com/herschel).
Sources are classified as AGN, composite, or starburst based on equivalent width of the PAH 6.2 m feature. The median intrinsic FWHM for [C II] shows no change with classification, being 207 km s-1 for AGN, 248 km s-1 for composites, and 233 km s-1 for starbursts with dispersions in intrinsic line widths of about 130 km s-1. Results show that [C II] line widths generally match those of [Ne II], as previously indicated in comparisons of line fluxes. A small number of sources are identified with unusually broad lines or with radial velocity differences between [C II] and Neon measures. Accurate redshifts are determined for sources as demonstrated by a systematic difference of only 21 km s-1 between the independent measures of [C II] and [Ne II] radial velocities using PACS and IRS.
References
- Banados et al. (2015) Banados, E., Decarli, R., Walter, F., Venemans, B., Farina, E., and Fan, X. 2015, ApJ, 805, 8
- Bernard-Salas et al. (2009) Bernard-Salas, J., Spoon, H. W. W., Charmandaris, V. et al. 2009, ApJ, 672, 274
- Bernard-Salas et al. (2009b) Bernard-Salas, J., Peeters, E., Sloan, G. C. et al. 2009, ApJ, 699, 1541
- Brandl et al. (2006) Brandl, B. R., Bernard-Salas, J., Spoon, H. W. W., et al. 2006, ApJ, 653, 1129.
- Brauher et al. (2008) Brauher, J. R., Dale, D. A., and Helou, G. 2008, ApJS, 178, 280
- Carilli et al. (2013) Carilli, C. L., Riechers, D., Walter, F., et al. 2013, ApJ, 763, 120
- Dasyra et al. (2011) Dasyra, K. M., Ho, L. C., Netzer, H. et al. 2011, ApJ, 740, 94
- De Looze et al. (2014) De Looze, I., Cormier, D., Lebouteiller, V. et al. 2014, A&A, 568, 62
- Desai et al. (2007) Desai, V., Armus, L., Spoon, H. W. W., et al. 2007, ApJ, 669, 810
- Diaz-Santos et al. (2013) Diaz-Santos, T., Armus, L., Charmandaris, V., et al. 2013, ApJ, 774, 68
- Diaz-Santos et al. (2014) Diaz-Santos, T., Armus, L., Charmandaris, V., et al. 2014, ApJ, 788, 17
- Farrah et al. (2007) Farrah, D., Bernard-Salas, J., Spoon, H. W. W., et al. 2007, ApJ, 667, 149
- Farrah et al. (2013) Farrah, D., Lebouteiller, V., Spoon, H. W. W., et al. 2013, ApJ, 776, 38
- Feldman et al. (1982) Feldman, F. R., Weedman, D. W., Balzano, V. A. and Ramsey, L. W. 1982, ApJ, 256, 427
- Genzel et al. (1998) Genzel, R., Lutz, D., Sturm, E., et al. 1998, ApJ, 498, 579
- Higdon et al. (2004) Higdon, S. J. U., Devost, D., Higdon, J. L., et al. 2004, PASP, 116, 975
- Helou et al. (2001) Helou, G., Malhotra, S., Hollenbach, D. J., Dale, D. A., and Contursi, A. 2001, ApJ, 548, L73
- Houck et al. (2004) Houck, J. R., Roellig, T.L., van Cleve, J., et al. 2004, ApJS, 154, 18
- Houck et al. (2007) Houck, J. R. Weedman, D. W., Le Floc’h, E., and Hao, L. 2007, ApJ, 671,323
- Huynh et al. (2013) Huynh, M. T., Norris, R. P., Coppin, K. E. K., et al. 2013, MNRAS, 431, 88
- Inami et al. (2013) Inami, H., Armus, L., Charmandaris, V. et al. 2013, ApJ, 777, 156
- Janssen et al. (2016) Janssen, A. W., Christopher, N., Sturm, E. et al. 2016, arxiv1604.00185
- Laurent et al. (2000) Laurent, O., Mirabel, R. F., Charmandaris, V., et al. 2000, A&A, 359, 887
- Lebouteiller et al. (2010) Lebouteiller, V., Bernard-Salas, J., Sloan, G. C., and Barry, D. J. 2010, PASP, 122, 231
- Lebouteiller et al. (2011) Lebouteiller, V., Barry, D. J., Bernard-Salas, H., Sloan, G. C., Houck, J. R., and Weedman, D. W. 2010, ApJS, 196, 8
- Lebouteiller et al. (2012) Lebouteiller, V., Cormier, D., Madden, S. C., et al. 2012, A&A, 548, A91
- Lebouteiller et al. (2015) Lebouteiller, V., Barry, D. J., Goes, C. et al. 2015, ApJS, 218, 21
- Luhman et al. (2003) Luhman, M. L., Satyapal, S., Fischer, J., et al. 2003, ApJ, 594, 758
- Malhotra et al. (1997) Malhotra, S., Helou, G., Stacey, G., et al. 1997, ApJ, 491, L27
- Malhotra et al. (2001) Malhotra, S., Kaufman, M. J., Hollenbach, D., et al. 2001, ApJ, 561, 766
- Meijerink et al. (2007) Meijerink, R., Spaans, M., and Israel, F. P. 2007, A&A, 461, 793
- Nelson and Whittle (1996) Nelson, C. H. and Whittle, M. 1996, ApJ, 465, 96
- Nikola et al. (1998) Nikola, T., Genzel, R., Herrmann, F., et al. 1998, ApJ, 504, 749
- Petric et al. (2011) Petric, A. O., Armus, L., Howell, J., et al. 2011, ApJ, 730, 28
- Pilbratt et al. (2010) Pilbratt, G. L., Riedinger, J. R., Passvogel, T., et al. 2010, A&A, 518, L1
- Poglitsch et al. (2010) Poglitsch, A., Waelkens, C., Geis, N., et al. 2010, A&A, 518, L2
- Pottasch and Bernard-Salas (2010) Pottasch, S. and Bernard-Salas, J. 2010, A&A, 517, 95
- Sargsyan et al. (2011) Sargsyan, L., Weedman, D., Lebouteiller, V., Houck, J., Barry, D., Hovhannisyan, A., and Mickaelian, A. 2011, ApJ, 730, 19
- Sargsyan et al. (2012) Sargsyan, L., Lebouteiller, V., Weedman, D., et al. 2012, ApJ, 755, 171
- Sargsyan et al. (2014) Sargsyan, L., Samsonyan, A., Lebouteiller, V. et al. 2014, ApJ, 790, 15
- Smith and Weedman (1972) Smith, M. G. and Weedman, D. W. 1972, ApJ, 172, 307
- Spoon et al. (2013) Spoon, H. W. W., Farrah, D., Lebouteiller, V., et al. 2013, ApJ, 775, 127
- Stacey et al. (1991) Stacey, G., Geis, N., Genzel, R., et al. 1991, ApJ, 373, 423
- Stierwalt et al. (2013) Stierwalt, S.,Armus, L., Surace, J. A., et al. 2013, ApJS, 206, 1
- Tielens and Hollenbach (1985) Tielens, A. G. G. M., and Hollenbach, D. 1985, ApJ, 291, 722
- Tommasin et al. (2010) Tommasin, S., Spinoglio, L., Malkan, M., and Fazio, G. 2010, ApJ, 709, 1257
- Veilleux et al. (2009) Veilleux, S., Rupke, D. S. N., Kim, D.-C., et al. 2009, ApJS, 182, 628
- Wang et al. (2013) Wang, R., Wagg, J., Carilli, C.L., et al. 2013, ApJ, 773, 44
- Weedman and Houck (2009) Weedman, D.W. and Houck, J.R. 2009, ApJ, 693, 370
- Werner et al. (2004) Werner, M. W., Roellig, T. L., Low, F. J., et al. 2004, ApJS, 154, 1
- Whittle (1985) Whittle, M. 1985, MNRAS, 213, 1
- Wright (2006) Wright, E. L. 2006, PASP, 118, 1711
- Wu et al. (2010) Wu, Y., Helou, G. , Armus, L., et al. 2010, ApJ, 723, 895
| No. | Herschel | Nameaafootnotemark: | R.A.bbfootnotemark: | Dec.bbfootnotemark: | zccfootnotemark: | ddfootnotemark: | eefootnotemark: | FWHMfffootnotemark: | FWHMggfootnotemark: | FWHMhhfootnotemark: | EWiifootnotemark: | Neonjjfootnotemark: | spaxkkfootnotemark: | sizellfootnotemark: | refnnfootnotemark: |
|---|---|---|---|---|---|---|---|---|---|---|---|---|---|---|---|
| AOR | [C II] | km s-1 | km s-1 | [C II] | [Ne II] | [Ne III] | m | ratio | kpc | ||||||
| 1 | 1342235847 | Mkn334 | 00:03:09.62 | 21:57:36.60 | 0.022151 | 31 | 98 | 249 | 328 | 460 | 0.25 | 0.41 | 3.3 | 4.15 | 9 |
| 2 | 1342235658 | NGC0023 | 00:09:53.36 | 25:55:27.70 | 0.015119 | 33 | -56 | 386 | 240 | 207 | 0.58 | 0.16 | 3.3 | 2.86 | 10 |
| 3 | 1342199416 | NGC34/Mkn938 | 00:11:06.55 | -12:06:26.30 | 0.019418 | 52 | 73 | 364 | 448 | 450 | 0.45 | 0.14 | 3.3 | 3.65 | 6 |
| 4 | 1342235846 | MCG-02-01-051/2 | 00:18:50.90 | -10:22:36.70 | 0.027243 | 13 | 34 | 197 | 321 | 300 | 0.72 | 0.22 | 3.3 | 5.08 | 9 |
| 5 | 1342237570 | IRAS00188-0856 | 00:21:26.48 | -08:39:27.10 | 0.128447 | -12 | 92 | 310 | 328 | 959ppfootnotemark: | 0.07 | 0.15 | 3.3 | 21.30 | 8 |
| 6 | 1342237574 | IRAS00199-7426 | 00:22:07.01 | -74:09:41.70 | 0.096064 | 13 | 23 | 269 | 339 | 299 | 0.35 | 0.09 | 3.3 | 16.52 | 9 |
| 7 | 1342199236 | Haro11 | 00:36:52.53 | -33:33:18.60 | 0.020717 | 50 | 38 | 157 | 249 | 236 | 0.15 | 3.65 | 3.3 | 3.88 | 5 |
| 8 | 1342247543 | NGC185 | 00:38:57.97 | 48:20:14.60 | -0.000605 | 47 | 0.12 | 3.3 | (0.03) | 2 | |||||
| 9 | 1342232583 | E12-G21 | 00:40:46.16 | -79:14:24.30 | 0.032967 | 42 | 42 | 333 | 381 | 276 | 0.28 | 0.49 | 3.3 | 6.10 | 9 |
| 10 | 1342238351 | IRAS00397-1312 | 00:42:15.50 | -12:56:03.50 | 452 | 316 | 0.03 | 0.5 | 3.3 | 37.67 | 8 | ||||
| 11 | 1342238142 | NGC0232a | 00:42:45.83 | -23:33:41.00 | 0.022890 | 53 | 107 | 449 | 210 | 373 | 0.55 | 0.16 | 3.3 | 4.28 | 10 |
| 12 | 1342238144 | NGC0232b | 00:42:52.82 | -23:32:27.80 | 0.022302 | 71 | 40 | 499 | 520 | 477 | 0.16 | 0.9 | 3.4 | 4.18 | 10 |
| 13 | 1342199415 | NGC253 | 00:47:33.12 | -25:17:17.60 | 0.000773 | 41 | 53 | 67 | 342 | 352 | 0.34 | 0.07 | 3.4 | (0.14) | 1 |
| 14 | 1342238141 | IRASF00456-2904SW | 00:48:06.75 | -28:48:18.60 | 0.109910 | 23 | 42 | 167 | 219 | 289 | 0.43 | 0.19 | 3.3 | 18.62 | 9 |
| 15 | 1342262037 | IZw1 | 00:53:34.94 | 12:41:36.20 | 0.061170 | 140qqfootnotemark: | 310 | 331 | 0.003 | 3.3 | 10.94 | 17 | |||
| 16 | 1342193211 | MCG+12-02-001 | 00:54:03.88 | 73:05:05.90 | 0.016092 | 53 | 50 | 106 | 260 | 272 | 0.65 | 0.35 | 2.3 | 3.03 | 6 |
| 17 | 1342236877 | NGC0317B | 00:57:40.41 | 43:47:32.50 | 0.016949 | 3 | 28 | 399 | 364 | 302 | 0.57 | 0.09 | 3.3 | 3.20 | 10 |
| 18 | 1342262033 | ESO541-IG12 | 01:02:17.55 | -19:40:08.70 | 0.056695 | -20 | 23 | 340 | 172 | 395 | 3.28 | 3.3 | 10.20 | 17 | |
| 19 | 1342238371 | IRAS01003-2238 | 01:02:49.94 | -22:21:57.30 | 0.117807 | -18 | 21 | 100 | 204 | 361 | 0.043 | 0.31 | 3.3 | 19.77 | 8 |
| 20 | 1342247782 | 3C31 | 01:07:24.94 | 32:24:45.20 | 0.016941 | 55 | 2 | 699nnfootnotemark: | 607 | 544 | 0.11 | 3.3 | 3.19 | 16 | |
| 21 | 1342212532 | IC1623 | 01:07:47.57 | -17:30:24.40 | 0.020201 | 161qqfootnotemark: | 182rrfootnotemark: | 264 | 255 | 264 | 0.3 | 0.89 | 2.3 | 3.79 | 6 |
| 22 | 1342238385 | MCG-03-04-014 | 01:10:08.96 | -16:51:09.80 | 0.035210 | 14 | 13 | 347 | 405 | 289 | 0.67 | 0.1 | 3.3 | 6.50 | 9 |
| 23 | 1342232616 | NGC0454 | 01:14:24.90 | -55:23:52.00 | 0.012129 | 114 | 98 | 202 | 427 | 348 | 0.008 | 1.58 | 3.3 | 2.30 | 9 |
| 24 | 1342234998 | ESO244-G012 | 01:18:08.31 | -44:27:43.40 | 0.022489 | -24 | -10 | 199 | 350 | 365 | 0.66 | 0.23 | 3.3 | 4.21 | 9 |
| 25 | 1342238602 | CGCG436-030 | 01:20:02.72 | 14:21:42.90 | 0.031363 | 82 | 103 | 220 | 250 | 215 | 0.5 | 0.27 | 3.3 | 5.81 | 10 |
| 26 | 1342238600 | ESO353-G020 | 01:34:51.26 | -36:08:14.40 | 0.016083 | 7 | 16 | 396 | 474 | 438 | 0.54 | 0.11 | 3.3 | 3.03 | 9 |
| 27 | 1342222218 | NGC625-1-1 | 01:35:06.68 | -41:26:13.00 | 0.001386 | 119 | 124 | 100 | 197 | 100 | 6.53 | 3.4 | (0.17) | 1 | |
| 28 | 1342238556 | ESO297-G011b | 01:36:23.39 | -37:19:18.10 | 0.017190 | -5 | -28 | 140 | 187 | 284 | 0.52 | 0.14 | 3.3 | 3.24 | 10 |
| 29 | 1342238558 | ESO297-G011a | 01:36:24.14 | -37:20:25.90 | 149 | 231 | 0.7 | 0.29 | 3.5 | 3.26 | 10 | ||||
| 30 | 1342238601 | IRASF01364-1042 | 01:38:52.92 | -10:27:11.40 | 0.048408 | 8 | -11 | 384 | 395 | 488 | 0.39 | 0.22 | 3.3 | 8.79 | 9 |
| 31 | 1342238637 | IRASF01417+1651 | 01:44:30.50 | 17:06:05.00 | 0.027452 | -7 | 108 | 270 | 462 | 559 | 0.37 | 0.17 | 3.3 | 5.11 | 10 |
| 32 | 1342238392 | NGC0695 | 01:51:14.24 | 22:34:56.50 | 0.032434 | 28 | 45 | 181 | 405 | 333 | 0.65 | 0.17 | 3.3 | 6.01 | 10 |
| 33 | 1342237475 | UGC01385 | 01:54:53.82 | 36:55:04.30 | 0.018487 | -7 | -14 | 49 | 279 | 229 | 0.64 | 0.12 | 3.3 | 3.47 | 9 |
| 34 | 1342238723 | Mkn1014 | 01:59:50.23 | 00:23:40.50 | 0.163097 | -8 | 40 | 226 | 543 | 911 | 0.04 | 1.61 | 3.3 | 26.04 | 8 |
| 35 | 1342238364 | NGC0788 | 02:01:06.45 | -06:48:55.90 | 0.013539 | -19 | -24 | 152 | 230 | 265 | 0.003 | 2.24 | 3.3 | 2.56 | 9 |
| 36 | 1342239376 | IRAS02054+0835 | 02:08:06.90 | 08:50:04.30 | 447 | 0.02 | 3.3 | 45.67 | 9 | ||||||
| 37 | 1342238923 | NGC0838c | 02:09:24.61 | -10:08:09.40 | 0.013568 | 78 | 28 | 345 | 528 | 300 | 0.45 | 0.21 | 3.3 | 2.56 | 10 |
| 38 | 1342238919 | NGC0838a | 02:09:38.60 | -10:08:46.90 | 0.012798 | 48 | 47 | 205 | 206 | 73 | 0.74 | 0.28 | 3.3 | 2.42 | 10 |
| 39 | 1342238921 | NGC0838b | 02:09:42.75 | -10:11:01.90 | 0.012922 | -41 | 21 | 173 | 318 | 238 | 0.5 | 0.27 | 3.3 | 2.45 | 10 |
| 40 | 1342238724 | NGC0828 | 02:10:09.53 | 39:11:24.70 | 0.017750 | 45 | 50 | 425 | 444 | 339 | 0.61 | 0.1 | 3.3 | 3.34 | 10 |
| 41 | 1342238950 | IC0214 | 02:14:05.56 | 05:10:23.70 | 0.030017 | -3 | 53 | 192 | 361 | 348 | 0.64 | 0.67 | 3.3 | 5.57 | 10 |
| 42 | 1342238636 | Mkn590 | 02:14:33.56 | -00:46:00.10 | 0.026591 | -23 | -4 | 218 | 835oofootnotemark: | 629 | 0.007 | 0.79 | 3.3 | 4.96 | 9 |
| 43 | 1342238956 | NGC0877b | 02:17:53.26 | 14:31:18.40 | 0.012795 | -65qqfootnotemark: | -48 | 118 | 365 | 338 | 0.46 | 0.18 | 3.4 | 2.42 | 10 |
| 44 | 1342238952 | NGC0877a | 02:17:59.68 | 14:32:38.20 | 0.013317 | 50 | 77 | 100 | 434 | 100 | 0.35 | 0.28 | 4.1 | 2.52 | 10 |
| 45 | 1342238422 | MCG+05-06-36b | 02:23:18.92 | 32:11:18.40 | 0.033639 | 24 | 7 | 246 | 410 | 487 | 0.54 | 0.07 | 3.5 | 6.22 | 10 |
| 46 | 1342238420 | MCG+05-06-36a | 02:23:21.99 | 32:11:49.50 | 0.034079 | 109 | -23 | 523nnfootnotemark: | 445 | 587 | 0.48 | 0.2 | 3.3 | 6.29 | 10 |
| 47 | 1342239504 | UGC01845 | 02:24:07.97 | 47:58:11.90 | 0.015702 | 56 | 105 | 400 | 365 | 313 | 0.58 | 0.1 | 3.3 | 2.96 | 9 |
| 48 | 1342238946 | NGC0958 | 02:30:42.84 | -02:56:20.40 | 0.019294 | 88 | -7 | 250 | 415 | 100 | 0.29 | 0.32 | 4.4 | 3.63 | 10 |
| 49 | 1342239370 | IC1816 | 02:31:51.00 | -36:40:19.40 | 0.016937 | -13 | -2 | 125 | 440 | 502 | 0.03 | 1.27 | 3.3 | 3.19 | 9 |
| 50 | 1342239500 | NGC0973 | 02:34:20.11 | 32:30:20.20 | 0.016215 | -3 | 44 | 300 | 434 | 391 | 0.002 | 1.21 | 3.3 | 3.05 | 9 |
| 51 | 1342238958 | NGC0992 | 02:37:25.46 | 21:06:02.80 | 0.013630 | 58 | 35 | 240 | 142 | 121 | 0.72 | 0.24 | 3.3 | 2.57 | 10 |
| 52 | 1342191154 | NGC1068 | 02:42:40.71 | -00:00:47.80 | 0.003748 | 88 | 110 | 200 | 796oofootnotemark: | 884ppfootnotemark: | 12.55 | 3.4 | (0.57) | 1 | |
| 53 | 1342203121 | NGC1068-1 | 02:42:40.71 | -00:00:47.80 | 0.003721 | 80 | 102 | 204 | 796oofootnotemark: | 884ppfootnotemark: | 12.55 | 3.3 | (0.57) | 1 | |
| 54 | 1342203122 | NGC1068-1 | 02:42:40.71 | -00:00:47.80 | 0.003717 | 79 | 101 | 204 | 796oofootnotemark: | 884ppfootnotemark: | 12.55 | 3.3 | (0.57) | 1 | |
| 55 | 1342216210 | NGC1056 | 02:42:48.47 | 28:34:24.70 | 0.005203 | -107qqfootnotemark: | -56 | 187 | 302 | 269 | 0.35 | 3.3 | (1.22) | 14 | |
| 56 | 1342216212 | NGC1056 | 02:42:48.47 | 28:34:24.70 | 0.005460 | -30 | 21 | 68 | 302 | 269 | 0.35 | 3.4 | (1.22) | 14 | |
| 57 | 1342238425 | UGC02238 | 02:46:17.49 | 13:05:44.40 | 0.021696 | 15 | 15 | 342 | 249 | 227 | 0.63 | 0.17 | 3.3 | 4.07 | 10 |
| 58 | 1342239499 | IRASF02437+2122 | 02:46:39.15 | 21:35:10.30 | 342 | 387 | 0.15 | 0.09 | 3.5 | 4.36 | 9 | ||||
| 59 | 1342239497 | UGC02369 | 02:54:01.79 | 14:58:25.00 | 0.031632 | 122 | 196 | 235 | 0.57 | 3.3 | 5.85 | 9 | |||
| 60 | 1342214034 | NGC1140-1 | 02:54:33.58 | -10:01:39.90 | 0.004961 | 19 | -11 | 100 | 136 | 100 | 0.57 | 3.58 | 2.4 | (0.83) | 1 |
| 61 | 1342238915 | Mkn1066 | 02:59:58.59 | 36:49:14.30 | 0.012189 | 7 | 36 | 202 | 331 | 465 | 0.25 | 0.46 | 3.3 | 2.31 | 9 |
| 62 | 1342239496 | NGC1222 | 03:08:56.74 | -02:57:18.50 | 0.008245 | 44 | 68 | 67 | 117 | 171 | 0.58 | 1.47 | 3.3 | 1.57 | 11 |
| 63 | 1342238960 | UGC02608 | 03:15:01.47 | 42:02:08.60 | 0.023531 | 25 | 73 | 260 | 260 | 395 | 0.2 | 1.19 | 3.3 | 4.40 | 10 |
| 64 | 1342238963 | IRAS03158+4227 | 03:19:12.60 | 42:38:28.00 | 0.134629 | 220 | 2.47 | 3.3 | 22.18 | 8 | |||||
| 65 | 1342191351 | NGC1275 | 03:19:48.16 | 41:30:42.10 | 0.017569 | 6 | 35 | 280 | 732oofootnotemark: | 727 | 0.02 | 0.46 | 3.3 | 3.31 | 1 |
| 66 | 1342214362 | NGC1275 | 03:19:48.16 | 41:30:42.10 | 0.017526 | -7 | 22 | 287 | 732oofootnotemark: | 737 | 0.008 | 0.46 | 1.1 | 3.30 | 15 |
| 67 | 1342238940 | IRASF03217+4022 | 03:25:05.37 | 40:33:32.20 | 0.023439 | 132qqfootnotemark: | 118 | 349 | 293 | 258 | 0.55 | 0.09 | 3.3 | 4.38 | 9 |
| 68 | 1342239752 | Mkn609 | 03:25:25.34 | -06:08:38.70 | 0.034600 | 35 | 51 | 100 | 273 | 327 | 0.32 | 0.29 | 3.3 | 6.39 | 9 |
| 69 | 1342191294 | NGC1365 | 03:33:36.37 | -36:08:25.50 | 0.005530 | 42 | 76 | 289 | 260 | 265 | 0.13 | 0.7 | 3.3 | (0.83) | 1 |
| 70 | 1342192138 | NGC1386 | 03:36:46.20 | -35:59:57.00 | 0.002536 | -132qqfootnotemark: | -128rrfootnotemark: | 142 | 271 | 365 | 0.001 | 2.87 | 3.4 | (0.74) | 1 |
| 71 | 1342214221 | SBS0335-052 | 03:37:44.00 | -05:02:38.00 | 0.013585 | 86 | 100 | 92 | 0.006 | 39.16 | 3.3 | 2.57 | 1 | ||
| 72 | 1342238916 | IRASF03359+1523 | 03:38:47.14 | 15:32:53.80 | 0.036012 | 150qqfootnotemark: | 140 | 246 | 319 | 364 | 0.36 | 0.3 | 2.3 | 6.64 | 9 |
| 73 | 1342238943 | IRASF03450+0055 | 03:47:40.18 | 01:05:14.00 | 325 | 600 | 0.001 | 1.84 | 3.2 | 5.75 | 9 | ||||
| 74 | 1342238967 | CGCG465-012b | 03:54:07.67 | 15:59:24.30 | 0.022214 | 92 | 67 | 134 | 271 | 258 | 0.67 | 0.13 | 3.5 | 4.16 | 10 |
| 75 | 1342238965 | CGCG465-012a | 03:54:15.95 | 15:55:43.40 | 0.022278 | 97 | 59 | 100 | 265 | 248 | 0.6 | 0.09 | 3.3 | 4.17 | 10 |
| 76 | 1342223119 | IRAS03538-6432 | 03:54:25.21 | -64:23:44.70 | 498 | 577 | 0.08 | 0.26 | 3.1 | 41.61 | 9 | ||||
| 77 | 1342239746 | IRAS03521+0028 | 03:54:42.15 | 00:37:02.00 | 0.151785 | 9 | -9 | 587nnfootnotemark: | 425 | 604 | 0.25 | 0.39 | 3.3 | 24.54 | 8 |
| 78 | 1342243655 | IRAS03582+6012 | 04:02:32.99 | 60:20:41.80 | 0.029984 | 42 | 84 | 183 | 78 | 100 | 0.64 | 0.48 | 3.3 | 5.57 | 10 |
| 79 | 1342239509 | IRAS04103-2838 | 04:12:19.53 | -28:30:24.40 | 0.117712 | 41 | 94 | 280 | 442 | 502 | 0.18 | 0.76 | 3.3 | 19.76 | 9 |
| 80 | 1342239505 | UGC02982 | 04:12:22.68 | 05:32:49.10 | 0.017841 | -5 | 51 | 285 | 189 | 128 | 0.68 | 0.14 | 3.3 | 3.36 | 10 |
| 81 | 1342226902 | IRAS04114-5117 | 04:12:44.92 | -51:09:34.20 | 0.125096 | -122qqfootnotemark: | 128 | 100 | 564 | 1023ppfootnotemark: | 0.34 | 0.22 | 3.3 | 20.82 | 9 |
| 82 | 1342238379 | ESO420-G013 | 04:13:49.70 | -32:00:25.30 | 0.012080 | 23 | 30 | 57 | 299 | 255 | 0.3 | 0.22 | 3.3 | 2.29 | 9 |
| 83 | 1342239480 | NGC1572 | 04:22:42.81 | -40:36:03.10 | 0.020504 | -2 | 31 | 366 | 404 | 415 | 0.46 | 0.08 | 3.3 | 3.85 | 10 |
| 84 | 1342239696 | IRAS04271+3849 | 04:30:33.09 | 38:55:47.80 | 0.019178 | 8 | 10 | 369 | 332 | 294 | 0.61 | 0.1 | 3.3 | 3.61 | 10 |
| 85 | 1342225795 | 3C120 | 04:33:11.10 | 05:21:15.60 | 0.033501 | 143qqfootnotemark: | 133 | 289 | 285 | 302 | 0.001 | 3.73 | 3.4 | 6.19 | 9 |
| 86 | 1342190367 | NGC1614 | 04:33:59.85 | -08:34:44.00 | 0.015835 | 68 | 7 | 245 | 346 | 381 | 0.61 | 0.96 | 3.3 | 2.98 | 6 |
| 87 | 1342239698 | UGC03094 | 04:35:33.83 | 19:10:18.20 | 0.024673 | -36 | -4 | 339 | 296 | 289 | 0.43 | 0.33 | 3.3 | 4.61 | 10 |
| 88 | 1342238378 | ESO203-IG001 | 04:46:49.55 | -48:33:30.60 | 0.052950 | 37 | 185rrfootnotemark: | 281 | 442 | 100 | 0.03 | 0.22 | 3.3 | 9.56 | 9 |
| 89 | 1342239733 | MCG-05-12-006 | 04:52:04.96 | -32:59:26.00 | 0.018472 | -4 | -15 | 198 | 297 | 304 | 0.53 | 0.09 | 3.3 | 3.47 | 9 |
| 90 | 1342219440 | NGC1808 | 05:07:42.32 | -37:30:45.70 | 0.003385 | 74 | 45 | 267 | 350 | 441 | 0.58 | 0.36 | 3.3 | (0.45) | 1 |
| 91 | 1342270686 | NGC1808 | 05:07:42.32 | -37:30:45.70 | 0.003386 | 90 | 61 | 267 | 350 | 441 | 0.58 | 0.1 | 3.3 | (0.45) | 3 |
| 92 | 1342239765 | NGC1797 | 05:07:44.84 | -08:01:08.70 | 0.015021 | 17 | -16 | 256 | 178 | 242 | 0.62 | 0.11 | 3.3 | 2.84 | 10 |
| 93 | 1342243518 | CGCG468-002b | 05:08:19.71 | 17:21:47.80 | 0.017603 | -23 | 12 | 360 | 270 | 334 | 0.12 | 0.96 | 3.3 | 3.31 | 10 |
| 94 | 1342243520 | CGCG468-002a | 05:08:21.21 | 17:22:08.00 | 0.016725 | 53 | 38 | 202 | 228 | 198 | 0.54 | 0.11 | 3.3 | 3.16 | 10 |
| 95 | 1342239694 | IRAS05083+2441 | 05:11:25.88 | 24:45:18.20 | 0.023535 | 59 | 74 | 262 | 254 | 78 | 0.72 | 0.32 | 3.3 | 4.40 | 10 |
| 96 | 1342226750 | Akn120 | 05:16:11.42 | -00:08:59.40 | 0.032865 | 11 | 49 | 297 | 349 | 424 | 0.001 | 1.37 | 3.3 | 6.08 | 9 |
| 97 | 1342219853 | VIIZw31 | 05:16:46.39 | 79:40:12.90 | 0.054229 | -4 | -26 | 113 | 217 | 227 | 0.64 | 0.11 | 3.4 | 9.80 | 9 |
| 98 | 1342243529 | IRAS05129+5128 | 05:16:55.96 | 51:31:56.90 | 0.027664 | 16 | 23 | 133 | 254 | 242 | 0.54 | 0.94 | 3.3 | 5.15 | 10 |
| 99 | 1342219442 | IRAS05189-2524 | 05:21:01.41 | -25:21:45.50 | 0.042708 | -6 | 419rrfootnotemark: | 181 | 345 | 754 | 0.02 | 0.93 | 3.3 | 7.81 | 1 |
| 100 | 1342227348 | IRASF05187-1017 | 05:21:06.54 | -10:14:46.70 | 0.028617 | -38 | -6 | 348 | 395 | 388 | 0.53 | 0.17 | 3.5 | 5.32 | 9 |
| 101 | 1342230077 | IRAS05223+1908 | 05:25:16.69 | 19:10:47.80 | 0.01 | 3.3 | 5.50 | 10 | |||||||
| 102 | 1342222085 | 30dorEstrip-1 | 05:38:34.58 | -69:05:57.50 | 0.000912 | 27 | 56 | 45 | 212 | 264 | 0.008 | 15.23 | 5.3 | (0.002) | 1 |
| 103 | 1342243527 | MCG+08-11-002 | 05:40:43.70 | 49:41:41.60 | 0.019183 | 0 | -19 | 458 | 548 | 438 | 0.56 | 0.09 | 3.3 | 3.61 | 10 |
| 104 | 1342230951 | NGC1961 | 05:42:04.80 | 69:22:43.00 | 0.013053 | -4 | -13 | 280 | 568 | 618 | 0.24 | 0.31 | 4.3 | 2.47 | 10 |
| 105 | 1342243531 | UGC03351 | 05:45:48.03 | 58:42:03.60 | 0.014914 | -31 | 37 | 276 | 352 | 339 | 0.53 | 0.12 | 3.3 | 2.82 | 10 |
| 106 | 1342243522 | IRAS05442+1732 | 05:47:11.20 | 17:33:46.40 | 0.018485 | -35 | -12 | 249 | 312 | 274 | 0.66 | 0.33 | 3.3 | 3.47 | 10 |
| 107 | 1342239744 | 2MASXJ0558-3820 | 05:58:02.00 | -38:20:04.70 | 0.034224 | 212qqfootnotemark: | 122 | 100 | 524 | 467 | 0.001 | 1.69 | 3.3 | 6.32 | 9 |
| 108 | 1342239479 | IRAS06035-7102 | 06:02:53.63 | -71:03:11.90 | 0.079450 | -65qqfootnotemark: | 23 | 236 | 415 | 522 | 0.076 | 0.27 | 3.3 | 13.93 | 8 |
| 109 | 1342230910 | IRASF06076-2139 | 06:09:45.74 | -21:40:24.50 | 0.037644 | 20 | 37 | 142 | 359 | 464 | 0.33 | 0.07 | 3.3 | 6.93 | 9 |
| 110 | 1342230944 | UGC03410b | 06:13:58.59 | 80:28:35.50 | 0.012585 | -54 | -32 | 112 | 268 | 311 | 0.56 | 0.13 | 3.3 | 2.38 | 10 |
| 111 | 1342230997 | UGC03410a | 06:14:30.35 | 80:27:00.20 | 0.013040 | 36 | 18 | 182 | 318 | 422 | 0.63 | 0.11 | 3.3 | 2.47 | 10 |
| 112 | 1342219851 | Mkn334 | 06:15:36.36 | 71:02:15.10 | 0.013450 | -51 | -58rrfootnotemark: | 332 | 729oofootnotemark: | 748 | 0.002 | 1.83 | 3.3 | 2.54 | 1 |
| 113 | 1342193210 | NGC2146-nuc | 06:18:37.71 | 78:21:25.30 | 0.002792 | -69qqfootnotemark: | -45 | 143 | 293 | 205 | 0.67 | 0.64 | 2.3 | (1.00) | 6 |
| 114 | 1342230961 | IRAS06206-6315 | 06:21:00.80 | -63:17:23.20 | 0.092098 | 54 | 181rrfootnotemark: | 385 | 523 | 608 | 0.107 | 0.52 | 3.3 | 15.91 | 8 |
| 115 | 1342231278 | IRAS06301-7934 | 06:26:42.20 | -79:36:30.40 | 0.156284 | -60 | -343rrfootnotemark: | 271 | 437 | 495 | 0.15 | 0.38 | 3.3 | 25.14 | 9 |
| 116 | 1342226880 | ESO255-IG007a | 06:27:21.70 | -47:10:36.20 | 0.039435 | -10 | -7 | 210 | 395 | 349 | 0.62 | 0.22 | 3.3 | 7.23 | 10 |
| 117 | 1342226190 | ESO255-IG007b | 06:27:23.09 | -47:11:02.60 | 0.039165 | -44 | -47 | 220 | 172 | 100 | 0.65 | 0.6 | 3.3 | 7.19 | 10 |
| 118 | 1342230958 | ESO557-G002b | 06:31:45.71 | -17:38:44.90 | 0.021277 | 3 | -8 | 157 | 128 | 196 | 0.7 | 0.49 | 3.5 | 3.98 | 10 |
| 119 | 1342230956 | ESO557-G002a | 06:31:47.20 | -17:37:16.60 | 0.021308 | 38 | 61 | 67 | 165 | 219 | 0.6 | 0.15 | 3.3 | 3.99 | 10 |
| 120 | 1342238377 | IRAS06361-6217 | 06:36:35.85 | -62:20:32.60 | 0.160096 | 113 | 64 | 270 | 247 | 361 | 0.05 | 0.25 | 3.3 | 25.65 | 9 |
| 121 | 1342230996 | NGC2273 | 06:50:08.72 | 60:50:45.00 | 0.006183 | -81qqfootnotemark: | -42 | 276 | 202 | 289 | 0.13 | 0.57 | 3.3 | (1.41) | 9 |
| 122 | 1342230955 | UGC03608 | 06:57:34.41 | 46:24:10.60 | 0.021647 | 85 | 45 | 149 | 174 | 207 | 0.53 | 0.14 | 3.3 | 4.06 | 9 |
| 123 | 1342231286 | IRASF06592-6313 | 06:59:40.26 | -63:17:52.40 | 0.023044 | 10 | 22 | 299 | 353 | 449 | 0.48 | 0.1 | 3.3 | 4.31 | 9 |
| 124 | 1342226876 | IRASF07027-6011a | 07:03:24.14 | -60:15:21.90 | 0.031754 | 65 | 285rrfootnotemark: | 161 | 281 | 648 | 0.04 | 0.68 | 3.3 | 5.89 | 10 |
| 125 | 1342226878 | IRASF07027-6011b | 07:03:28.52 | -60:16:43.70 | 0.031019 | 32 | 18 | 81 | 255 | 217 | 0.68 | 0.1 | 3.5 | 5.75 | 10 |
| 126 | 1342229686 | NGC2342a | 07:09:18.08 | 20:38:09.50 | 0.017579 | -42 | -19 | 247 | 202 | 240 | 0.67 | 0.15 | 3.3 | 3.31 | 10 |
| 127 | 1342207825 | IRAS07251-0248 | 07:27:37.62 | -02:54:54.80 | 0.087810 | -9 | -15 | 331 | 442 | 183 | 0.09 | 0.12 | 3.3 | 15.24 | 1 |
| 128 | 1342229716 | NGC2388a | 07:28:53.44 | 33:49:08.80 | 0.013723 | 1 | 11 | 203 | 257 | 236 | 0.53 | 0.08 | 3.3 | 2.60 | 10 |
| 129 | 1342230946 | MCG+02-20-003 | 07:35:43.44 | 11:42:34.80 | 0.016580 | 8 | 25 | 209 | 239 | 289 | 0.17 | 0.11 | 3.3 | 3.13 | 10 |
| 130 | 1342243533 | Mkn9 | 07:36:56.98 | 58:46:13.40 | 0.040100 | -7 | 22 | 100 | 278 | 215 | 0.142 | 1.06 | 3.3 | 7.36 | 9 |
| 131 | 1342243534 | IRAS07598+6508 | 08:04:30.46 | 64:59:52.90 | 0.148697 | 95 | 1449rrfootnotemark: | 211 | 528 | 1044ppfootnotemark: | 0.01 | 0.39 | 3.3 | 24.12 | 9 |
| 132 | 1342229688 | Mkn622 | 08:07:41.04 | 39:00:15.20 | 0.023510 | 148qqfootnotemark: | 97 | 148 | 414 | 821ppfootnotemark: | 0.24 | 0.52 | 3.3 | 4.39 | 9 |
| 133 | 1342220753 | HS0822+3542 | 08:25:55.52 | 35:32:32.00 | 100 | 0.13 | 3.3 | 0.47 | 5 | ||||||
| 134 | 1342230967 | IRAS08311-2459 | 08:33:20.47 | -25:09:33.10 | 0.100478 | -53 | -58rrfootnotemark: | 244 | 265 | 717 | 0.14 | 1.03 | 3.3 | 17.20 | 8 |
| 135 | 1342186306 | He2-10 | 08:36:15.18 | -26:24:33.90 | 189 | 121 | 0.61 | 1.23 | 3.4 | (0.43) | 1 | ||||
| 136 | 1342221975 | He2-10 | 08:36:15.18 | -26:24:33.90 | 0.002864 | 4 | 12 | 60 | 189 | 121 | 0.61 | 1.23 | 3.3 | (0.43) | 1 |
| 137 | 1342225823 | IRAS08355-4944 | 08:37:01.87 | -49:54:30.00 | 0.025928 | 57 | 106 | 91 | 290 | 131 | 0.19 | 0.56 | 3.3 | 4.83 | 10 |
| 138 | 1342208904 | NGC2623 | 08:38:24.08 | 25:45:16.90 | 0.018427 | 43 | 84 | 344 | 392 | 469 | 0.27 | 0.27 | 3.3 | 3.46 | 6 |
| 139 | 1342230964 | ESO432-IG006b | 08:44:27.21 | -31:41:50.80 | 0.016292 | -60 | -5 | 325 | 214 | 287 | 0.64 | 0.12 | 3.5 | 3.08 | 10 |
| 140 | 1342230962 | ESO432-IG006a | 08:44:28.93 | -31:41:30.30 | 0.016257 | -21 | 13 | 394 | 437 | 463 | 0.41 | 0.14 | 3.3 | 3.07 | 10 |
| 141 | 1342228521 | ESO60-IG016 | 08:52:32.07 | -69:01:54.80 | 0.044863 | 13 | 45 | 192 | 144 | 287 | 0.07 | 0.75 | 3.3 | 8.18 | 9 |
| 142 | 1342208952 | IRAS08572+3915 | 09:00:25.38 | 39:03:54.30 | 0.058238 | -8 | 198 | 226 | 0.03 | 3.3 | 10.46 | 1 | |||
| 143 | 1342231958 | Mkn18 | 09:01:58.39 | 60:09:06.20 | 0.011332 | 63 | 50 | 236 | 170 | 192 | 0.27 | 0.58 | 3.3 | 2.15 | 9 |
| 144 | 1342209403 | IRAS09022-3615 | 09:04:12.00 | -36:27:01.00 | 0.059827 | -32 | -41 | 343 | 352 | 402 | 0.14 | 0.58 | 2.3 | 10.72 | 1 |
| 145 | 1342230935 | UGC04881 | 09:15:55.10 | 44:19:55.00 | 0.039950 | 32 | 15 | 194 | 354 | 267 | 0.4 | 0.08 | 3.3 | 7.33 | 10 |
| 146 | 1342231718 | MCG-01-24-012 | 09:20:46.25 | -08:03:22.10 | 0.019814 | 27 | 28 | 268 | 328 | 371 | 0.005 | 0.96 | 3.3 | 3.72 | 9 |
| 147 | 1342231715 | Mkn705 | 09:26:03.29 | 12:44:03.60 | 0.028791 | -7 | 43 | 285 | 183 | 396 | 0.02 | 1.03 | 3.3 | 5.35 | 9 |
| 148 | 1342220973 | IZw18 | 09:34:02.03 | 55:14:28.10 | 0.002585 | -8 | 27 | 66 | 100 | 100 | 0.09 | 8.49 | 2.3 | (0.86) | 1 |
| 149 | 1342208949 | UGC5101 | 09:35:51.65 | 61:21:11.30 | 0.039277 | 71 | 87 | 498 | 477 | 706 | 0.18 | 0.37 | 3.3 | 7.21 | 1 |
| 150 | 1342231716 | IC0563 | 09:46:20.30 | 03:02:44.70 | 0.020094 | 16 | -30 | 225 | 392 | 410 | 0.6 | 0.11 | 3.3 | 3.77 | 10 |
| 151 | 1342231731 | IRASF09437+0317 | 09:46:21.10 | 03:04:16.30 | 0.020027 | 19 | 29 | 195 | 416 | 321 | 0.57 | 0.09 | 3.3 | 3.76 | 10 |
| 152 | 1342221391 | NGC3079 | 10:01:57.80 | 55:40:47.10 | 0.003843 | 75 | 99 | 452 | 570 | 633 | 0.4 | 0.25 | 3.3 | (0.88) | 1 |
| 153 | 1342270667 | Mkn25 | 10:03:51.90 | 59:26:10.00 | 0.010103 | 41 | 48 | 100 | 136 | 27 | 0.46 | 0.46 | 3.3 | 1.92 | 3 |
| 154 | 1342231725 | NGC3110a | 10:04:02.11 | -06:28:29.20 | 0.016982 | 28 | 32 | 280 | 338 | 200 | 0.64 | 0.08 | 3.3 | 3.20 | 10 |
| 155 | 1342254278 | 3C236 | 10:06:01.74 | 34:54:10.40 | 0.099224 | -11 | -25 | 491 | 1298oofootnotemark: | 541 | 0.4 | 3.3 | 17.00 | 4 | |
| 156 | 1342235705 | IRASF10038-3338 | 10:06:04.65 | -33:53:06.10 | 0.034215 | 29 | -26 | 90 | 180 | 181 | 0.002 | 0.29 | 3.3 | 6.31 | 9 |
| 157 | 1342231729 | IRASF10173+0828 | 10:20:00.22 | 08:13:34.00 | 0.048963 | -32 | -384rrfootnotemark: | 294 | 364 | 100 | 0.35 | 0.24 | 3.3 | 8.89 | 10 |
| 158 | 1342233703 | NGC3221 | 10:22:20.26 | 21:34:22.30 | 0.013379 | 4 | 59 | 73 | 154 | 100 | 0.75 | 0.42 | 4.3 | 2.53 | 10 |
| 159 | 1342197796 | NGC3227 | 10:23:30.60 | 19:51:54.00 | 0.003907 | 33 | 60 | 290 | 465 | 508 | 0.09 | 1.1 | 3.3 | (0.99) | 14 |
| 160 | 1342232315 | IRAS10378+1109 | 10:40:29.17 | 10:53:17.70 | 0.136400 | -78qqfootnotemark: | 28 | 373 | 477 | 295 | 0.078 | 0.2 | 3.3 | 22.43 | 8 |
| 161 | 1342225718 | ESO264-G036 | 10:43:07.51 | -46:12:44.10 | 0.020642 | 139qqfootnotemark: | 144 | 271 | 404 | 217 | 0.44 | 0.12 | 3.3 | 3.87 | 10 |
| 162 | 1342221892 | Haro3 | 10:45:22.33 | 55:57:37.30 | 0.003205 | 51 | 73 | 100 | 170 | 100 | 0.51 | 2.95 | 3.3 | (0.86) | 5 |
| 163 | 1342232587 | NGC3393 | 10:48:23.39 | -25:09:42.80 | 0.012587 | 9 | 14 | 171 | 425 | 454 | 0.003 | 3.89 | 3.3 | 2.38 | 9 |
| 164 | 1342209015 | Mkn153 | 10:49:05.03 | 52:20:07.80 | 303 | 128 | 0.07 | 6.41 | 3.4 | 1.52 | 5 | ||||
| 165 | 1342225716 | ESO264-G057 | 10:59:01.70 | -43:26:25.20 | 0.017158 | -28 | 11 | 142 | 279 | 207 | 0.6 | 0.07 | 3.3 | 3.23 | 10 |
| 166 | 1342207788 | IRAS10565+2448 | 10:59:18.14 | 24:32:34.30 | 0.043080 | 7 | 8 | 139 | 242 | 292 | 0.38 | 0.12 | 3.3 | 7.88 | 1 |
| 167 | 1342223365 | NGC3489 | 11:00:18.57 | 13:54:04.40 | 0.002331 | -17 | 14 | 152 | 151 | 151 | 1.53 | 3.3 | (0.41) | 11 | |
| 168 | 1342233712 | MCG+07-23-019 | 11:03:53.20 | 40:50:57.00 | 0.035245 | 84 | 77 | 234 | 435 | 380 | 0.64 | 0.2 | 2.2 | 6.50 | 10 |
| 169 | 1342245980 | NGC3516 | 11:06:47.49 | 72:34:06.90 | 0.009168 | 63 | 113 | 86 | 613 | 403 | 1.98 | 3.4 | (2.55) | 14 | |
| 170 | 1342232612 | IRAS11095-0238 | 11:12:03.34 | -02:54:24.10 | 0.106358 | 30 | 17 | 208 | 322 | 276 | 0.027 | 0.38 | 3.3 | 18.08 | 8 |
| 171 | 1342232307 | IRAS11119+3257 | 11:14:38.88 | 32:41:33.10 | 360 | 937ppfootnotemark: | 0.01 | 0.58 | 3.3 | 29.35 | 9 | ||||
| 172 | 1342223770 | CGCG011-076 | 11:21:12.26 | -02:59:03.50 | 0.024900 | 62 | 43 | 198 | 490 | 476 | 0.32 | 0.12 | 3.3 | 4.43 | 10 |
| 173 | 1342223753 | IC2810a | 11:25:45.05 | 14:40:35.90 | 0.034607 | 178qqfootnotemark: | 189rrfootnotemark: | 229 | 393 | 375 | 0.6 | 0.11 | 3.4 | 6.39 | 10 |
| 174 | 1342235704 | ESO319-G022 | 11:27:54.18 | -41:36:51.70 | 0.016339 | 5 | 28 | 171 | 302 | 367 | 0.3 | 0.07 | 3.3 | 3.09 | 9 |
| 175 | 1342199289 | VIIZw31403 | 11:27:59.90 | 78:59:39.00 | -0.000289 | 46 | 100 | 0.16 | 13.32 | 4.2 | (0.05) | 5 | |||
| 176 | 1342208906 | Arp299 | 11:28:31.19 | 58:33:49.00 | 0.010944 | 101 | 86 | 202 | 268 | 248 | 0.48 | 5.4 | 2.07 | 1 | |
| 177 | 1342199419 | NGC3690/Arp299 | 11:28:31.32 | 58:33:42.50 | 0.010635 | 123 | 163rrfootnotemark: | 151 | 100 | 340 | 0.34 | 3.3 | 2.02 | 1 | |
| 178 | 1342222070 | Mkn1450 | 11:38:35.62 | 57:52:27.20 | 0.003202 | -17 | 7 | 100 | 159 | 142 | 0.26 | 10.66 | 3.3 | (0.61) | 5 |
| 179 | 1342212225 | NGC3783 | 11:39:01.78 | -37:44:18.70 | 0.009825 | 82 | 106 | 59 | 245 | 229 | 0.001 | 1.47 | 3.3 | (2.18) | 1 |
| 180 | 1342222201 | UM448 | 11:42:12.30 | 00:20:03.00 | 0.018460 | 10 | -6 | 145 | 274 | 242 | 0.45 | 2.27 | 3.3 | 3.47 | 5 |
| 181 | 1342245394 | NGC3894 | 11:48:50.36 | 59:24:56.40 | 787oofootnotemark: | 626 | 0.02 | 0.98 | 3.3 | 2.04 | 16 | ||||
| 182 | 1342222205 | UM461 | 11:51:33.04 | -02:22:22.80 | 0.003610 | 32 | 120 | 100 | 0.05 | 18.54 | 3.3 | (0.69) | 5 | ||
| 183 | 1342197912 | NGC3982 | 11:56:28.10 | 55:07:30.60 | 0.003704 | -44 | -29 | 79 | 279 | 244 | 0.99 | 3.3 | (0.99) | 14 | |
| 184 | 1342210822 | Antennae/NGC4038 | 12:01:54.75 | -18:52:51.10 | 0.005265 | 115 | 185rrfootnotemark: | 95 | 242 | 248 | 0.95 | 3.3 | (0.97) | 1 | |
| 185 | 1342199228 | SBS1159+545 | 12:02:02.44 | 54:15:50.10 | 0.04 | 3.3 | 2.27 | 5 | |||||||
| 186 | 1342197812 | NGC4051 | 12:03:09.61 | 44:31:52.80 | 0.002354 | 4 | 39 | 66 | 244 | 336 | 0.05 | 1.12 | 3.3 | (0.66) | 1 |
| 187 | 1342208880 | NGC4051 | 12:03:09.61 | 44:31:52.80 | 0.002317 | -7 | 27 | 50 | 244 | 336 | 0.05 | 1.12 | 3.3 | (0.66) | 14 |
| 188 | 1342223403 | IRAS12018+1941 | 12:04:24.53 | 19:25:09.80 | 0.167849 | 34 | -11 | 100 | 287 | 389 | 0.11 | 0.15 | 3.3 | 26.67 | 9 |
| 189 | 1342223404 | UGC07064 | 12:04:43.34 | 31:10:38.20 | 0.025079 | 20 | 30 | 100 | 244 | 246 | 0.08 | 0.98 | 3.3 | 4.68 | 9 |
| 190 | 1342225714 | ESO440-IG058 | 12:06:51.87 | -31:56:59.20 | 0.022994 | 19 | 23 | 358 | 369 | 395 | 0.66 | 0.13 | 3.3 | 4.30 | 10 |
| 191 | 1342234994 | IRAS12071-0444 | 12:09:45.12 | -05:01:13.90 | 0.128861 | 1 | 311rrfootnotemark: | 251 | 305 | 859ppfootnotemark: | 0.05 | 0.96 | 3.3 | 21.36 | 8 |
| 192 | 1342198305 | NGC4151 | 12:10:32.58 | 39:24:20.60 | 0.003396 | 80 | 104 | 196 | 350 | 325 | 0.011 | 1.92 | 3.3 | (0.64) | 1 |
| 193 | 1342223773 | NGC4150 | 12:10:33.65 | 30:24:05.50 | 0.000838 | 36 | 33 | 149 | 324 | 348 | 0.75 | 3.3 | (0.58) | 11 | |
| 194 | 1342210832 | IRASF12112+0305 | 12:13:46.05 | 02:48:41.30 | 0.072923 | 64 | 139 | 390 | 443 | 308 | 0.3 | 0.25 | 3.3 | 12.87 | 1 |
| 195 | 1342225793 | ESO267-G030b | 12:13:52.28 | -47:16:25.40 | 0.018257 | 40 | 31 | 200 | 201 | 361 | 0.68 | 0.14 | 3.3 | 3.43 | 10 |
| 196 | 1342233265 | NGC4194 | 12:14:09.64 | 54:31:34.60 | 0.008589 | 99 | 85 | 194 | 334 | 267 | 0.55 | 0.52 | 3.3 | (1.78) | 10 |
| 197 | 1342225812 | ESO267-G030a | 12:14:12.81 | -47:13:42.50 | 0.018111 | 29 | 24 | 355 | 506 | 355 | 0.5 | 0.24 | 3.3 | 3.41 | 10 |
| 198 | 1342226873 | IRAS12116-5615 | 12:14:22.08 | -56:32:32.70 | 0.027267 | 13 | 22 | 67 | 239 | 282 | 0.36 | 0.12 | 3.3 | 5.08 | 10 |
| 199 | 1342199408 | Tol1214-277 | 12:17:17.09 | -28:02:32.70 | 153 | 0.16 | 7.43 | 3.3 | 4.84 | 5 | |||||
| 200 | 1342234057 | IRASF12224-0624 | 12:25:03.91 | -06:40:52.60 | 0.026433 | 9 | 208 | 309 | 0.07 | 3.3 | 4.92 | 10 | |||
| 201 | 1342197909 | NGC4388 | 12:25:46.75 | 12:39:43.50 | 0.008517 | 91 | 68 | 208 | 276 | 316 | 0.03 | 1.33 | 3.3 | (0.92) | 14 |
| 202 | 1342199423 | Mkn209 | 12:26:16.02 | 48:29:36.60 | 0.001039 | 87 | 51 | 100 | 202 | 272 | 0.18 | 43.56 | 3.3 | (0.26) | 5 |
| 203 | 1342210830 | NGC4418 | 12:26:54.66 | -00:52:40.30 | 0.007147 | 109 | 0.02 | 3.3 | (1.15) | 1 | |||||
| 204 | 1342202109 | NGC4418-1 | 12:26:54.66 | -00:52:40.30 | 0.007083 | 93 | 0.02 | 3.3 | (1.15) | 1 | |||||
| 205 | 1342223803 | NGC4435 | 12:27:40.49 | 13:04:44.20 | 0.002738 | -31 | -30 | 402 | 398 | 62 | 0.23 | 0.2 | 3.3 | (0.78) | 11 |
| 206 | 1342234949 | NGC4459 | 12:29:00.03 | 13:58:42.80 | 0.004103 | 63 | -1 | 362 | 240 | 100 | 1.1 | 3.3 | (0.75) | 11 | |
| 207 | 1342235707 | 3C273 | 12:29:06.67 | 02:03:08.10 | 538 | 736 | 0.002 | 2.61 | 3.3 | 25.42 | 8 | ||||
| 208 | 1342234992 | NGC4472 | 12:29:46.78 | 08:00:01.90 | 700oofootnotemark: | 523 | 0.002 | 0.54 | 3.3 | 0.63 | 12 | ||||
| 209 | 1342225720 | NGC4507 | 12:35:36.55 | -39:54:33.30 | 0.011874 | 10 | 52 | 287 | 383 | 392 | 0.002 | 0.96 | 3.3 | 2.25 | 9 |
| 210 | 1342198302 | NGC4593 | 12:39:39.43 | -05:20:39.30 | 0.008407 | 66 | 55 | 247 | 180 | 171 | 0.006 | 1.21 | 3.3 | (1.58) | 1 |
| 211 | 1342212224 | TOL1238-364 | 12:40:52.86 | -36:45:21.10 | 0.011083 | 50 | 24 | 100 | 223 | 388 | 0.7 | 3.4 | 2.07 | 14 | |
| 212 | 1342212222 | TOL1238-364 | 12:40:52.86 | -36:45:21.10 | 0.011083 | 50 | 24 | 100 | 223 | 388 | 0.7 | 3.4 | 2.07 | 14 | |
| 213 | 1342236279 | PG1244+026 | 12:46:35.24 | 02:22:08.70 | 0.048578 | -45 | 54 | 100 | 255 | 384 | 0.02 | 0.58 | 3.3 | 8.83 | 9 |
| 214 | 1342237582 | IRAS12514+1027 | 12:54:00.82 | 10:11:12.40 | 758oofootnotemark: | 0.009 | 3.3 | 43.26 | 9 | ||||||
| 215 | 1342186811 | Mkn231 | 12:56:14.29 | 56:52:25.10 | 0.042180 | 34 | 153 | 193 | 0.01 | 3.3 | 7.71 | 1 | |||
| 216 | 1342223759 | NGC4922 | 13:01:25.26 | 29:18:49.60 | 0.023740 | 31 | 40 | 167 | 223 | 384 | 0.16 | 0.27 | 3.3 | 4.43 | 10 |
| 217 | 1342225721 | CGCG043-099 | 13:01:50.80 | 04:20:00.00 | 0.037912 | 118 | 124 | 278 | 359 | 313 | 0.55 | 0.1 | 2.2 | 6.97 | 10 |
| 218 | 1342225747 | MCG-02-33-098 | 13:02:19.66 | -15:46:04.20 | 0.015976 | 43 | 14 | 118 | 230 | 360 | 0.55 | 0.23 | 3.3 | 3.01 | 10 |
| 219 | 1342225742 | ESO507-G070 | 13:02:52.42 | -23:55:17.80 | 0.021534 | 5 | -9 | 500 | 517 | 443 | 0.56 | 0.15 | 3.3 | 4.04 | 9 |
| 220 | 1342225749 | NGC4941 | 13:04:13.06 | -05:33:05.80 | 0.003718 | -56 | -18 | 156 | 212 | 276 | 0.041 | 2.03 | 3.3 | (0.78) | 9 |
| 221 | 1342225811 | ESO323-G077 | 13:06:26.13 | -40:24:52.50 | 0.015786 | -6 | 21 | 400 | 482 | 548 | 0.03 | 0.59 | 3.3 | 2.98 | 9 |
| 222 | 1342226187 | IRAS13052-5711 | 13:08:18.73 | -57:27:30.30 | 0.021851 | 56 | 56 | 399 | 371 | 321 | 0.61 | 0.17 | 3.3 | 4.10 | 10 |
| 223 | 1342234990 | IC0860 | 13:15:03.53 | 24:37:07.90 | 0.012973 | 4 | -26 | 218 | 318 | 100 | 0.43 | 0.14 | 3.3 | 2.45 | 10 |
| 224 | 1342214629 | IRAS13120-5453 | 13:15:06.40 | -55:09:23.30 | 0.031083 | -38 | 31 | 340 | 288 | 411 | 0.45 | 0.16 | 3.3 | 5.76 | 1 |
| 225 | 1342232597 | VV250b | 13:15:30.69 | 62:07:45.80 | 555 | 610 | 0.76 | 0.31 | 3.5 | 5.71 | 10 | ||||
| 226 | 1342232595 | VV250a | 13:15:34.96 | 62:07:29.20 | 0.031262 | 26 | 45 | 337 | 435 | 486 | 0.63 | 0.37 | 3.3 | 5.79 | 10 |
| 227 | 1342197801 | Arp193 | 13:20:35.34 | 34:08:22.20 | 0.023412 | 65 | 27 | 391 | 317 | 292 | 0.62 | 0.17 | 3.3 | 4.38 | 6 |
| 228 | 1342225750 | NGC5104 | 13:21:23.08 | 00:20:32.70 | 0.018611 | 102 | 109 | 495 | 365 | 462 | 0.51 | 0.11 | 3.3 | 3.50 | 10 |
| 229 | 1342225746 | MCG-03-34-064 | 13:22:24.45 | -16:43:42.40 | 816oofootnotemark: | 801ppfootnotemark: | 0.01 | 2.18 | 3.5 | 3.12 | 9 | ||||
| 230 | 1342202589 | CenA | 13:25:27.62 | -43:01:08.80 | 0.001838 | 54 | 62 | 122 | 520 | 428 | 0.003 | 14.98 | 3.4 | (0.17) | 1 |
| 231 | 1342190371 | NGC5135 | 13:25:43.97 | -29:50:00.00 | 0.013717 | 81 | 131 | 57 | 302 | 346 | 0.39 | 0.46 | 3.3 | 2.60 | 6 |
| 232 | 1342190368 | ESO173-G015 | 13:27:23.79 | -57:29:21.80 | 0.010034 | 33 | 45 | 183 | 303 | 238 | 0.53 | 0.2 | 3.3 | 1.91 | 6 |
| 233 | 1342232550 | IRASF13279+3401 | 13:30:15.23 | 33:46:29.40 | 154 | 0.04 | 3.4 | 4.44 | 9 | ||||||
| 234 | 1342237579 | IC4280 | 13:32:53.40 | -24:12:25.50 | 0.016255 | -35 | 18 | 231 | 486 | 407 | 0.59 | 0.08 | 3.3 | 3.07 | 10 |
| 235 | 1342225810 | M-6-30-15 | 13:35:53.78 | -34:17:44.10 | 0.008006 | 40 | 70 | 106 | 208 | 100 | 0.001 | 1.87 | 4.3 | (1.52) | 9 |
| 236 | 1342234948 | IRAS13342+3932 | 13:36:24.07 | 39:17:30.10 | 0.179642 | 87 | 158 | 375 | 328 | 562 | 0.07 | 0.98 | 3.3 | 28.18 | 9 |
| 237 | 1342231427 | IRAS13352+6402 | 13:36:51.15 | 63:47:04.70 | 352 | 948ppfootnotemark: | 0.08 | 0.26 | 3.3 | 34.95 | 9 | ||||
| 238 | 1342236984 | IRASF13349+2438 | 13:37:18.73 | 24:23:03.30 | 0.108287 | -121rrfootnotemark: | 387 | 415 | 0.001 | 3.3 | 18.37 | 9 | |||
| 239 | 1342231735 | NGC5256 | 13:38:17.69 | 48:16:33.90 | 0.028120 | -9 | 85 | 449 | 468 | 559 | 0.44 | 0.87 | 3.3 | 5.23 | 10 |
| 240 | 1342225569 | NGC5257a | 13:39:52.95 | 00:50:25.90 | 0.022732 | 215 | 0.63 | 3.2 | 4.25 | 10 | |||||
| 241 | 1342225571 | NGC5257b | 13:39:57.72 | 00:49:53.00 | 0.022533 | 100 | 79 | 261 | 414 | 238 | 0.54 | 0.11 | 2.2 | 4.22 | 10 |
| 242 | 1342207802 | Mkn273 | 13:44:42.12 | 55:53:13.10 | 0.037816 | 103 | 77 | 496 | 534 | 605 | 0.09 | 0.68 | 3.3 | 6.96 | 1 |
| 243 | 1342236886 | IRAS13451+1232 | 13:47:33.36 | 12:17:24.20 | 0.121928 | 140qqfootnotemark: | 592rrfootnotemark: | 470 | 743oofootnotemark: | 1801 | 0.003 | 1.2 | 3.3 | 20.37 | 8 |
| 244 | 1342233263 | UGC08739 | 13:49:13.94 | 35:15:26.20 | 0.016874 | 44 | 37 | 330 | 249 | 134 | 0.51 | 0.14 | 2.3 | 3.18 | 10 |
| 245 | 1342223809 | IC4329A | 13:49:19.29 | -30:18:34.40 | 0.015966 | 72 | 90 | 450 | 521 | 589 | 0.001 | 2.45 | 3.3 | 3.01 | 1 |
| 246 | 1342238373 | ESO221-IG010 | 13:50:56.92 | -49:03:18.80 | 0.010544 | 63 | 90 | 146 | 204 | 284 | 0.69 | 0.13 | 3.3 | 2.00 | 10 |
| 247 | 1342224240 | NGC5331a | 13:52:16.21 | 02:06:05.10 | 0.033202 | 41 | 71 | 480 | 512 | 520 | 0.61 | 0.12 | 3.3 | 6.14 | 10 |
| 248 | 1342225723 | NGC5331b | 13:52:16.43 | 02:06:30.90 | 0.033086 | 3 | 0 | 431 | 485 | 328 | 0.6 | 0.1 | 3.3 | 6.12 | 10 |
| 249 | 1342223133 | NGC5347 | 13:53:17.83 | 33:29:27.00 | 0.008137 | -1 | 13 | 100 | 90 | 346 | 0.03 | 1.16 | 3.3 | (1.25) | 9 |
| 250 | 1342236982 | Mkn463 | 13:56:02.90 | 18:22:19.00 | 0.050817 | 68 | 22 | 219 | 667 | 555 | 0.001 | 3.52 | 3.3 | 9.21 | 8 |
| 251 | 1342222240 | NGC5394 | 13:58:33.65 | 37:27:12.60 | 0.011634 | 30 | 34 | 100 | 204 | 153 | 0.62 | 0.11 | 3.3 | 2.21 | 10 |
| 252 | 1342236271 | IRAS14026+4341 | 14:04:38.72 | 43:27:07.30 | 353 | 0.01 | 3.4 | 43.73 | 9 | ||||||
| 253 | 1342247534 | OQ208 | 14:07:00.39 | 28:27:14.70 | 0.076773 | 19 | -62rrfootnotemark: | 474 | 488 | 776ppfootnotemark: | 0.02 | 0.58 | 3.3 | 13.50 | 4 |
| 254 | 1342237584 | OQ208 | 14:07:00.39 | 28:27:14.70 | 488 | 776ppfootnotemark: | 0.02 | 0.58 | 3.5 | 13.47 | 9 | ||||
| 255 | 1342191297 | CircinusGalaxy | 14:13:09.91 | -65:20:20.50 | 0.001456 | -1 | 7 | 156 | 245 | 173 | 0.04 | 3.4 | 3.3 | (0.19) | 1 |
| 256 | 1342213758 | NGC5506 | 14:13:14.87 | -03:12:27.00 | 0.006192 | 65 | 88 | 241 | 529 | 506 | 0.007 | 1.52 | 3.3 | (1.08) | 1 |
| 257 | 1342199733 | SBS1415+437 | 14:17:01.76 | 43:30:13.40 | 0.002093 | 100 | 0.097 | 3.3 | (0.62) | 5 | |||||
| 258 | 1342236985 | NGC5548 | 14:17:59.53 | 25:08:12.40 | 0.017262 | 32 | 39 | 100 | 400 | 311 | 0.02 | 1 | 3.3 | 3.25 | 9 |
| 259 | 1342232331 | Mkn1490 | 14:19:43.25 | 49:14:11.70 | 201 | 311 | 0.56 | 0.1 | 3.5 | 4.79 | 9 | ||||
| 260 | 1342238159 | PG1426+015 | 14:29:06.59 | 01:17:06.50 | 0.086587 | 14 | 36 | 287 | 551 | 572 | 0.002 | 1.91 | 3.3 | 15.05 | 9 |
| 261 | 1342238163 | NGC5653 | 14:30:10.44 | 31:12:55.80 | 0.011737 | -68qqfootnotemark: | -26 | 120 | 156 | 260 | 0.54 | 0.14 | 3.3 | 2.23 | 10 |
| 262 | 1342224242 | IRAS14348-1447 | 14:37:38.27 | -15:00:24.60 | 0.082551 | -5 | -32 | 286 | 454 | 299 | 0.174 | 0.18 | 3.3 | 14.42 | 1 |
| 263 | 1342204338 | IRAS14378-3651 | 14:40:58.90 | -37:04:33.00 | 0.068118 | 124 | 124 | 148 | 341 | 231 | 0.39 | 0.08 | 3.3 | 12.10 | 1 |
| 264 | 1342223736 | PG1440+356 | 14:42:07.46 | 35:26:22.90 | 0.077692 | 75 | 6 | 182 | 327 | 453 | 0.02 | 0.81 | 3.3 | 13.64 | 9 |
| 265 | 1342238133 | NGC5728 | 14:42:23.93 | -17:15:11.40 | 0.009492 | 60 | 16 | 351 | 514 | 668 | 0.08 | 2.34 | 3.3 | (1.39) | 9 |
| 266 | 1342238131 | NGC5734a | 14:45:09.04 | -20:52:13.20 | 0.013214 | -91qqfootnotemark: | -138rrfootnotemark: | 105 | 535 | 411 | 0.47 | 0.15 | 3.5 | 2.50 | 10 |
| 267 | 1342238129 | NGC5734b | 14:45:11.02 | -20:54:48.60 | 0.014030 | 74 | 41 | 141 | 423 | 281 | 0.49 | 0.19 | 3.3 | 2.66 | 10 |
| 268 | 1342248560 | 3C305 | 14:49:21.80 | 63:16:15.30 | 0.041809 | 59 | 6 | 802nnfootnotemark: | 843oofootnotemark: | 918 | 1.96 | 3.3 | 7.65 | 4 | |
| 269 | 1342236986 | VV340b | 14:57:00.32 | 24:36:24.60 | 0.032869 | 36 | -7 | 100 | 247 | 100 | 0.58 | 0.12 | 3.3 | 6.08 | 10 |
| 270 | 1342234963 | VV340a | 14:57:00.70 | 24:37:05.80 | 0.034909 | 95 | 125 | 264 | 273 | 333 | 0.58 | 0.29 | 3.3 | 6.44 | 10 |
| 271 | 1342239742 | IC4518ABa | 14:57:41.18 | -43:07:55.60 | 0.015817 | -20 | 44 | 229 | 392 | 381 | 0.06 | 1.46 | 3.3 | 2.98 | 10 |
| 272 | 1342238134 | NGC5793 | 14:59:24.76 | -16:41:36.10 | 0.011596 | 43 | 55 | 401 | 361 | 351 | 0.39 | 0.2 | 3.3 | 2.20 | 9 |
| 273 | 1342238158 | NGC5813 | 15:01:11.25 | 01:42:07.10 | 0.006891 | 83 | -101rrfootnotemark: | 227 | 273 | 593 | 0.016 | 1.06 | 3.3 | (1.33) | 12 |
| 274 | 1342236887 | IRAS15001+1433 | 15:02:31.94 | 14:21:35.30 | 0.162125 | 60 | 65 | 378 | 488 | 675 | 0.14 | 0.36 | 3.3 | 25.92 | 9 |
| 275 | 1342238157 | NGC5846 | 15:06:29.26 | 01:36:20.00 | 0.005721 | -16 | 25 | 449 | 52 | 153 | 1.2 | 3.3 | (1.23) | 12 | |
| 276 | 1342223161 | VV705 | 15:18:06.34 | 42:44:36.70 | 0.040912 | 165qqfootnotemark: | 173rrfootnotemark: | 272 | 254 | 255 | 0.75 | 0.21 | 2.3 | 7.50 | 10 |
| 277 | 1342238152 | IRAS15225+2350 | 15:24:43.94 | 23:40:10.20 | 0.138699 | -29 | 344rrfootnotemark: | 100 | 450 | 870ppfootnotemark: | 0.05 | 0.31 | 3.3 | 22.74 | 9 |
| 278 | 1342238352 | ESO099-G004 | 15:24:57.98 | -63:07:29.40 | 0.029281 | -49 | -41 | 279 | 294 | 277 | 0.53 | 0.2 | 3.3 | 5.44 | 10 |
| 279 | 1342213752 | IRAS15250+3609 | 15:26:59.40 | 35:58:37.50 | 0.055377 | 49 | 117 | 239 | 290 | 375 | 0.03 | 0.25 | 3.3 | 9.97 | 1 |
| 280 | 1342238153 | NGC5936 | 15:30:00.85 | 12:59:22.10 | 0.013487 | -6 | 7 | 100 | 208 | 164 | 0.62 | 0.08 | 3.3 | 2.55 | 10 |
| 281 | 1342191306 | Arp220 | 15:34:57.24 | 23:30:11.70 | 0.018101 | -8 | 4 | 470 | 369 | 486 | 0.17 | 0.14 | 3.3 | 3.40 | 1 |
| 282 | 1342238136 | NGC5990 | 15:46:16.41 | 02:24:55.60 | 0.012594 | -25 | 8 | 214 | 535 | 606 | 0.15 | 0.4 | 3.3 | 2.39 | 10 |
| 283 | 1342238135 | IRAS15462-0450 | 15:48:56.80 | -04:59:33.70 | 0.100358 | -2 | 274rrfootnotemark: | 102 | 294 | 1296ppfootnotemark: | 0.05 | 0.51 | 3.3 | 17.18 | 8 |
| 284 | 1342253766 | PKS1549-79 | 15:56:58.87 | -79:14:04.30 | 0.152545 | 192qqfootnotemark: | 367 | 954oofootnotemark: | 0.008 | 3.3 | 24.64 | 4 | |||
| 285 | 1342237487 | NGC6052 | 16:05:12.87 | 20:32:33.00 | 0.015809 | 52 | 53 | 80 | 214 | 169 | 0.69 | 0.76 | 3.3 | 2.98 | 10 |
| 286 | 1342234492 | 16052+5334 | 16:06:32.99 | 53:26:32.10 | 0.087864 | -74qqfootnotemark: | -33 | 636nnfootnotemark: | 387 | 327 | 0.13 | 3.3 | 15.25 | 7 | |
| 287 | 1342238907 | IRAS16090-0139 | 16:11:40.42 | -01:47:05.80 | 0.133631 | 37 | 21 | 311 | 474 | 322 | 0.057 | 0.17 | 3.3 | 22.04 | 8 |
| 288 | 1342227214 | NGC6090 | 16:11:40.70 | 52:27:24.00 | 0.029573 | -116qqfootnotemark: | -16 | 55 | 139 | 276 | 0.73 | 0.27 | 3.3 | 5.50 | 10 |
| 289 | 1342222163 | Mkn876 | 16:13:57.18 | 65:43:09.60 | 0.129276 | -54 | 7 | 384 | 510 | 531 | 0.01 | 0.7 | 3.3 | 21.43 | 9 |
| 290 | 1342227799 | IRASF16164-0746 | 16:19:11.79 | -07:54:02.80 | 0.023400 | 14 | 35 | 374 | 467 | 458 | 0.42 | 0.3 | 3.2 | 4.37 | 9 |
| 291 | 1342238911 | Mkn883 | 16:29:52.85 | 24:26:38.30 | 0.038311 | 7 | 68 | 296 | 291 | 473 | 0.26 | 0.65 | 3.3 | 7.04 | 9 |
| 292 | 1342238909 | CGCG052-037 | 16:30:56.54 | 04:04:58.40 | 0.024785 | 15 | 25 | 198 | 204 | 200 | 0.62 | 0.08 | 3.3 | 4.63 | 9 |
| 293 | 1342232265 | IRAS16334+4630 | 16:34:52.37 | 46:24:53.00 | 0.190795 | 15 | 62 | 263 | 452 | 646 | 0.3 | 0.24 | 3.3 | 29.58 | 9 |
| 294 | 1342238731 | NGC6156 | 16:34:52.55 | -60:37:08.00 | 0.011001 | -6 | 51 | 146 | 299 | 377 | 0.37 | 0.29 | 3.3 | 2.08 | 10 |
| 295 | 1342231301 | ESO069-IG006 | 16:38:11.85 | -68:26:08.20 | 0.046332 | 60 | 31 | 497 | 491 | 609 | 0.64 | 0.14 | 3.3 | 8.44 | 9 |
| 296 | 1342240777 | IRASF16399-0937N | 16:42:40.11 | -09:43:13.70 | 0.027296 | 15 | 1 | 248 | 554 | 725 | 0.38 | 0.31 | 3.3 | 5.09 | 9 |
| 297 | 1342250583 | ESO453-G005 | 16:47:31.09 | -29:21:21.60 | 0.021071 | 21 | 44 | 53 | 274 | 242 | 0.42 | 0.23 | 3.3 | 3.95 | 10 |
| 298 | 1342216623 | NGC6240 | 16:52:58.89 | 02:24:03.40 | 0.024818 | 119 | 57 | 561nnfootnotemark: | 832oofootnotemark: | 803ppfootnotemark: | 0.35 | 0.51 | 3.3 | 4.63 | 1 |
| 299 | 1342239382 | IRASF16516-0948 | 16:54:23.72 | -09:53:20.90 | 0.023099 | -17 | 5 | 215 | 388 | 417 | 0.69 | 0.37 | 3.3 | 4.32 | 10 |
| 300 | 1342230134 | NGC6286b/6285 | 16:58:24.01 | 58:57:21.50 | 0.019076 | 14 | 14 | 300 | 383 | 375 | 0.66 | 0.18 | 3.3 | 3.59 | 10 |
| 301 | 1342230132 | NGC6286a | 16:58:31.38 | 58:56:10.50 | 0.018497 | 45 | 65 | 286 | 322 | 315 | 0.59 | 0.1 | 3.3 | 3.48 | 10 |
| 302 | 1342238910 | 2MASSJ1659+1834 | 16:59:39.80 | 18:34:36.90 | 288 | 471 | 0.02 | 1.82 | 3.3 | 27.04 | 9 | ||||
| 303 | 1342225993 | PG1700+518 | 17:01:24.80 | 51:49:20.00 | 0.009 | 3.3 | 40.76 | 9 | |||||||
| 304 | 1342223716 | IRAS17044+6720 | 17:04:28.41 | 67:16:28.50 | 0.135376 | 21 | 127 | 219 | 477 | 757 | 0.04 | 0.4 | 3.3 | 22.28 | 9 |
| 305 | 1342232574 | IRAS17068+4027 | 17:08:32.12 | 40:23:28.20 | 0.179438 | 113 | 107 | 375 | 435 | 392 | 0.079 | 0.53 | 3.3 | 28.16 | 9 |
| 306 | 1342223740 | IRASF17132+5313 | 17:14:20.00 | 53:10:30.00 | 0.051145 | 76 | 56 | 395 | 415 | 394 | 0.42 | 0.14 | 3.3 | 9.26 | 9 |
| 307 | 1342243510 | IRASF17138-1017 | 17:16:35.60 | -10:20:38.00 | 0.017492 | 60 | 127 | 199 | 346 | 262 | 0.68 | 0.11 | 3.3 | 3.29 | 10 |
| 308 | 1342229693 | IRAS17208-0014 | 17:23:21.93 | -00:17:00.40 | 0.042812 | 39 | 48 | 480 | 475 | 455 | 0.31 | 0.18 | 3.3 | 7.83 | 1 |
| 309 | 1342240168 | ESO138-G027 | 17:26:43.35 | -59:55:55.20 | 0.020923 | 45 | 66 | 46 | 268 | 272 | 0.35 | 0.11 | 3.3 | 3.92 | 9 |
| 310 | 1342229809 | UGC11041 | 17:54:51.82 | 34:46:34.20 | 0.016332 | 31 | 19 | 341 | 239 | 187 | 0.58 | 0.08 | 3.3 | 3.08 | 10 |
| 311 | 1342231759 | CGCG141-034 | 17:56:56.65 | 24:01:02.00 | 0.020162 | 51 | 65 | 450 | 384 | 370 | 0.39 | 0.18 | 3.3 | 3.78 | 9 |
| 312 | 1342239716 | IRAS17578-0400 | 18:00:31.86 | -04:00:53.40 | 0.013425 | 56 | 89 | 214 | 377 | 297 | 0.68 | 0.19 | 3.3 | 2.54 | 10 |
| 313 | 1342229821 | IRAS18090+0130b | 18:11:33.41 | 01:31:42.40 | 0.029190 | -3 | 18 | 252 | 217 | 435 | 0.52 | 0.15 | 3.3 | 5.43 | 10 |
| 314 | 1342243548 | IRAS18090+0130a | 18:11:38.42 | 01:31:40.30 | 0.028936 | -53 | -23 | 408 | 97 | 217 | 0.61 | 0.12 | 3.3 | 5.37 | 10 |
| 315 | 1342225996 | NGC6621 | 18:12:55.39 | 68:21:48.20 | 0.020843 | 84 | 63 | 299 | 318 | 348 | 0.56 | 0.08 | 3.3 | 3.91 | 10 |
| 316 | 1342230139 | CGCG142-034b | 18:16:33.83 | 22:06:38.90 | 0.018463 | -44 | 44 | 448 | 442 | 453 | 0.48 | 0.27 | 3.3 | 3.47 | 10 |
| 317 | 1342230141 | CGCG142-034a | 18:16:40.69 | 22:06:46.40 | 455 | 517 | 0.51 | 0.13 | 3.5 | 3.51 | 10 | ||||
| 318 | 1342222100 | H1821+643 | 18:21:57.31 | 64:20:36.40 | 612 | 561 | 0.002 | 2.96 | 3.3 | 41.24 | 9 | ||||
| 319 | 1342192112 | IRASF18293-3413 | 18:32:41.10 | -34:11:27.00 | 0.018265 | 39 | -22 | 287 | 383 | 391 | 0.63 | 0.24 | 3.4 | 3.43 | 6 |
| 320 | 1342233700 | NGC6670Ab | 18:33:34.26 | 59:53:17.90 | 0.028937 | -34 | -37 | 249 | 315 | 385 | 0.63 | 0.14 | 3.5 | 5.37 | 10 |
| 321 | 1342233698 | NGC6670Aa | 18:33:37.74 | 59:53:22.80 | 0.029141 | 43 | 26 | 121 | 262 | 260 | 0.61 | 0.27 | 3.3 | 5.42 | 10 |
| 322 | 1342192143 | F18325-5926 | 18:36:58.29 | -59:24:08.60 | 0.020101 | 27 | 62 | 450 | 599 | 767 | 0.02 | 1.18 | 3.3 | 3.77 | 1 |
| 323 | 1342251096 | ESO103-G035 | 18:38:20.30 | -65:25:40.00 | 0.013499 | 163qqfootnotemark: | 149 | 123 | 603 | 630 | 0.003 | 1.44 | 3.4 | 2.55 | 14 |
| 324 | 1342241710 | IC4734 | 18:38:25.75 | -57:29:25.40 | 0.015496 | -56 | -34 | 201 | 341 | 453 | 0.38 | 0.1 | 3.3 | 2.92 | 9 |
| 325 | 1342232253 | IRAS18443+7433 | 18:42:55.60 | 74:36:26.10 | 475 | 637 | 0.051 | 0.21 | 2.3 | 22.19 | 9 | ||||
| 326 | 1342235677 | NGC6701 | 18:43:12.52 | 60:39:11.60 | 0.013181 | -25 | 13 | 100 | 245 | 223 | 0.55 | 0.1 | 3.3 | 2.49 | 10 |
| 327 | 1342240169 | ESO140-G043 | 18:44:53.98 | -62:21:53.40 | 0.014195 | -16 | 60 | 151 | 257 | 249 | 0.02 | 1.29 | 3.3 | 2.69 | 9 |
| 328 | 1342231316 | 1H1836-786 | 18:47:03.20 | -78:31:51.00 | 0.074745 | 161qqfootnotemark: | 142 | 289 | 413 | 284 | 0.012 | 1 | 3.3 | 13.17 | 9 |
| 329 | 1342231709 | NGC6786b | 19:10:54.01 | 73:24:36.00 | 0.025157 | 22 | 52 | 180 | 142 | 178 | 0.64 | 0.11 | 3.5 | 4.70 | 10 |
| 330 | 1342231707 | NGC6786a | 19:11:04.37 | 73:25:32.50 | 0.025319 | 12 | 23 | 198 | 225 | 292 | 0.29 | 0.24 | 3.3 | 4.72 | 10 |
| 331 | 1342231749 | ESO593-IG008 | 19:14:31.15 | -21:19:06.30 | 0.048834 | -189qqfootnotemark: | -328rrfootnotemark: | 496 | 667oofootnotemark: | 352 | 0.56 | 0.19 | 3.5 | 8.87 | 9 |
| 332 | 1342231317 | ESO-141-G055 | 19:21:14.15 | -58:40:13.10 | 0.037265 | 17 | 91 | 100 | 279 | 330 | 0.003 | 2.03 | 3.3 | 6.86 | 9 |
| 333 | 1342231722 | IRAS19254-7245 | 19:31:21.55 | -72:39:22.00 | 0.061594 | -57 | -151rrfootnotemark: | 576nnfootnotemark: | 835oofootnotemark: | 1055ppfootnotemark: | 0.032 | 0.37 | 2.3 | 11.01 | 8 |
| 334 | 1342208891 | IRAS19297-0406 | 19:32:21.25 | -03:59:56.30 | 460 | 349 | 0.3 | 0.13 | 4.2 | 14.92 | 1 | ||||
| 335 | 1342208916 | IRAS19542+1110 | 19:56:35.78 | 11:19:04.90 | 0.062666 | 82 | 89 | 273 | 335 | 629 | 0.29 | 0.27 | 2.3 | 11.20 | 1 |
| 336 | 1342232296 | ESO339-G011 | 19:57:37.60 | -37:56:08.40 | 0.019191 | 13 | -19 | 350 | 306 | 331 | 0.27 | 0.94 | 3.3 | 3.61 | 9 |
| 337 | 1342232297 | IRAS20037-1547 | 20:06:31.70 | -15:39:08.00 | 0.192243 | -45 | 8 | 138 | 244 | 200 | 0.04 | 0.2 | 3.3 | 29.75 | 9 |
| 338 | 1342232295 | NGC6860 | 20:08:46.89 | -61:06:00.70 | 0.014790 | 36 | 29 | 301 | 300 | 354 | 0.08 | 1.97 | 3.3 | 2.80 | 9 |
| 339 | 1342232302 | IRAS20087-0308 | 20:11:23.86 | -02:59:50.80 | 0.105416 | -14 | 19 | 555nnfootnotemark: | 597 | 438 | 0.24 | 0.11 | 3.3 | 17.94 | 8 |
| 340 | 1342216371 | IRAS20100-4156 | 20:13:29.85 | -41:47:34.70 | 0.129707 | -21 | -11 | 216 | 433 | 478 | 0.144 | 0.3 | 3.3 | 21.49 | 8 |
| 341 | 1342217702 | NGC6907a | 20:25:06.58 | -24:48:32.90 | 0.010743 | -10 | 20 | 270 | 172 | 100 | 0.57 | 0.06 | 3.3 | 2.04 | 10 |
| 342 | 1342232579 | MCG+04-48-002a | 20:28:35.07 | 25:44:00.30 | 0.014071 | 8 | 48 | 309 | 480 | 450 | 0.57 | 0.24 | 3.3 | 2.66 | 10 |
| 343 | 1342217654 | NGC6926a | 20:33:06.13 | -02:01:38.90 | 0.019552 | -141qqfootnotemark: | -131rrfootnotemark: | 97 | 474 | 583 | 0.37 | 0.89 | 3.5 | 3.68 | 10 |
| 344 | 1342232581 | IRAS20351+2521 | 20:37:17.73 | 25:31:37.50 | 0.034171 | 45 | 10 | 232 | 216 | 200 | 0.57 | 0.17 | 3.3 | 6.30 | 10 |
| 345 | 1342243654 | Mkn509 | 20:44:09.74 | -10:43:24.50 | 0.034585 | 46 | 55 | 399 | 563 | 364 | 0.02 | 1.22 | 3.3 | 6.39 | 14 |
| 346 | 1342217908 | IRAS20414-1651 | 20:44:18.18 | -16:40:16.40 | 0.087027 | 101 | 148 | 492 | 518 | 443 | 0.57 | 0.19 | 3.3 | 15.12 | 8 |
| 347 | 1342254215 | IC5063-1 | 20:52:02.10 | -57:04:06.60 | 0.011153 | 14 | -37 | 396 | 422 | 395 | 0.002 | 2.77 | 3.3 | 2.11 | 4 |
| 348 | 1342218619 | CGCG448-020 | 20:57:24.38 | 17:07:39.20 | 0.036400 | -19 | -31 | 240 | 274 | 198 | 0.27 | 0.97 | 3.3 | 6.70 | 10 |
| 349 | 1342208934 | IRAS20551-4250 | 20:58:26.78 | -42:39:01.60 | 0.04296 | 117 | 88 | 177 | 226 | 111 | 0.06 | 0.2 | 3.3 | 7.86 | 1 |
| 350 | 1342232563 | ESO286-G035 | 21:04:11.11 | -43:35:36.10 | 0.017501 | 36 | 75 | 250 | 206 | 181 | 0.69 | 0.12 | 3.3 | 3.30 | 9 |
| 351 | 1342221628 | IRAS21101+5810 | 21:11:29.28 | 58:23:07.90 | 0.039436 | 92 | 56 | 194 | 306 | 231 | 0.55 | 0.09 | 2.3 | 7.23 | 10 |
| 352 | 1342217815 | ESO343-IG013 | 21:36:10.53 | -38:32:42.80 | 0.019093 | -6 | 25 | 270 | 240 | 134 | 0.61 | 0.13 | 2.2 | 3.59 | 10 |
| 353 | 1342218185 | NGC7130/IC5135 | 21:48:19.50 | -34:57:06.00 | 0.016263 | 45 | 107 | 100 | 278 | 577 | 0.3 | 0.4 | 3.3 | 3.07 | 14 |
| 354 | 1342218489 | NGC7172 | 22:02:01.90 | -31:52:11.00 | 0.009265 | 227qqfootnotemark: | 217rrfootnotemark: | 199 | 527 | 351 | 0.03 | 0.71 | 3.4 | (1.54) | 14 |
| 355 | 1342256925 | FSC22017+0319 | 22:04:19.17 | 03:33:50.20 | 0.061526 | -28 | -26 | 95 | 319 | 169 | 2.3 | 3.3 | 11.00 | 17 | |
| 356 | 1342232569 | NGC7213 | 22:09:16.25 | -47:10:00.00 | 0.005986 | 47 | 43 | 252 | 549 | 517 | 0.005 | 0.56 | 3.3 | (1.00) | 9 |
| 357 | 1342231750 | ESO467-G027 | 22:14:39.97 | -27:27:50.30 | 0.017552 | -30 | 0 | 287 | 206 | 114 | 0.62 | 0.11 | 3.3 | 3.31 | 10 |
| 358 | 1342257681 | 3C445 | 22:23:49.57 | -02:06:12.40 | 423 | 299 | 0.002 | 1.54 | 3.3 | 10.06 | 17 | ||||
| 359 | 1342233481 | ESO602-G025 | 22:31:25.48 | -19:02:04.10 | 0.025297 | 73 | 123 | 393 | 225 | 468 | 0.39 | 0.18 | 3.3 | 4.72 | 9 |
| 360 | 1342197892 | NGC7314 | 22:35:46.20 | -26:03:01.30 | 0.004739 | 20 | 36 | 100 | 126 | 192 | 0.029 | 2.72 | 3.3 | (0.83) | 1 |
| 361 | 1342235675 | UGC12138 | 22:40:17.05 | 08:03:14.10 | 0.025163 | 7 | 18 | 100 | 410 | 248 | 0.08 | 1.49 | 3.3 | 4.70 | 9 |
| 362 | 1342223714 | UGC12150 | 22:41:12.26 | 34:14:57.00 | 0.021712 | 59 | 68 | 399 | 437 | 315 | 0.43 | 0.07 | 3.3 | 4.07 | 9 |
| 363 | 1342232568 | ESO239-IG002 | 22:49:39.84 | -48:50:58.30 | 0.043002 | -15 | 20 | 295 | 396 | 410 | 0.31 | 0.1 | 3.3 | 7.86 | 9 |
| 364 | 1342211825 | IRAS22491-1808 | 22:51:49.35 | -17:52:24.00 | 0.077697 | 100 | 46 | 102 | 230 | 187 | 0.48 | 0.31 | 3.3 | 13.64 | 1 |
| 365 | 1342211171 | NGC7469 | 23:03:15.62 | 08:52:26.40 | 0.016499 | 55 | 126 | 200 | 359 | 307 | 0.23 | 0.31 | 3.3 | 3.12 | 1 |
| 366 | 1342235676 | Zw453.062 | 23:04:56.53 | 19:33:08.00 | 0.024931 | -14 | -8 | 248 | 271 | 384 | 0.58 | 0.4 | 3.3 | 4.66 | 9 |
| 367 | 1342235673 | IRAS23060+0505 | 23:08:33.97 | 05:21:29.80 | 570 | 481 | 0.01 | 0.86 | 3.3 | 27.33 | 9 | ||||
| 368 | 1342234062 | Sersic159-03 | 23:13:58.80 | -42:43:38.00 | 293 | 1234ppfootnotemark: | 1.48 | 3.3 | 10.42 | 13 | |||||
| 369 | 1342210395 | IRAS23128-5919 | 23:15:47.01 | -59:03:16.90 | 0.044720 | 169qqfootnotemark: | 127 | 178 | 299 | 426 | 0.31 | 0.7 | 2.3 | 8.15 | 1 |
| 370 | 1342237590 | IC5298 | 23:16:00.70 | 25:33:24.10 | 0.027363 | 15 | 139 | 252 | 375 | 542 | 0.142 | 0.49 | 3.3 | 5.09 | 10 |
| 371 | 1342235751 | NGC7591 | 23:18:16.28 | 06:35:08.90 | 0.016472 | -6 | -4 | 323 | 296 | 333 | 0.48 | 0.09 | 3.3 | 3.11 | 10 |
| 372 | 1342234259 | NGC7592 | 23:18:22.60 | -04:24:58.00 | 0.024721 | 29 | 67 | 200 | 392 | 392 | 0.3 | 0.24 | 2.3 | 4.62 | 10 |
| 373 | 1342211202 | NGC7582 | 23:18:23.62 | -42:22:13.60 | 0.005399 | -59 | -28 | 313 | 262 | 246 | 0.26 | 0.87 | 3.3 | (0.97) | 1 |
| 374 | 1342221357 | NGC7582 | 23:18:23.62 | -42:22:13.60 | 0.005467 | -39 | -8 | 307 | 262 | 246 | 0.26 | 0.87 | 3.3 | (0.97) | 14 |
| 375 | 1342222576 | NGC7603 | 23:18:56.62 | 00:14:38.20 | 0.029413 | -4 | -26 | 398 | 402 | 498 | 0.02 | 0.49 | 3.3 | 5.47 | 9 |
| 376 | 1342232564 | ESO077-IG014a | 23:21:03.73 | -69:13:01.00 | 0.041455 | 2 | 79 | 397 | 348 | 478 | 0.63 | 0.15 | 3.3 | 7.59 | 10 |
| 377 | 1342232566 | ESO077-IG014b | 23:21:05.45 | -69:12:47.30 | 365 | 532 | 0.49 | 0.16 | 3.5 | 7.61 | 10 | ||||
| 378 | 1342234997 | IRAS23230-6926 | 23:26:03.57 | -69:10:20.30 | 0.106342 | -22 | 11 | 285 | 387 | 295 | 0.2 | 0.27 | 3.3 | 18.07 | 8 |
| 379 | 1342234264 | NGC7674 | 23:27:56.72 | 08:46:44.50 | 0.028955 | -15 | 8 | 197 | 400 | 559 | 0.02 | 1.95 | 3.3 | 5.37 | 10 |
| 380 | 1342235703 | IRAS23253-5415 | 23:28:06.10 | -53:58:31.00 | 0.129727 | -101 | -31 | 410 | 586 | 583 | 0.15 | 0.22 | 3.3 | 21.49 | 8 |
| 381 | 1342235842 | NGC7679a | 23:28:46.62 | 03:30:41.40 | 0.017193 | -7 | 16 | 106 | 312 | 413 | 0.64 | 0.49 | 3.3 | 3.24 | 10 |
| 382 | 1342212520 | Mkn930 | 23:31:58.30 | 28:56:50.00 | 0.018269 | 39 | 21 | 100 | 197 | 190 | 0.14 | 7.13 | 3.3 | 3.43 | 5 |
| 383 | 1342212515 | IRAS23365+3604 | 23:39:01.29 | 36:21:09.80 | 0.064480 | 164qqfootnotemark: | 145 | 174 | 268 | 100 | 0.27 | 0.08 | 3.3 | 11.49 | 1 |
| 384 | 1342235844 | MCG-01-60-022 | 23:42:00.91 | -03:36:54.40 | 0.023165 | -39 | 27 | 299 | 265 | 231 | 0.5 | 0.14 | 3.3 | 4.33 | 9 |
| 385 | 1342236288 | IRAS23436+5257 | 23:46:05.43 | 53:14:01.60 | 0.034144 | 2 | 46 | 185 | 247 | 375 | 0.37 | 0.12 | 3.3 | 6.30 | 10 |
| 386 | 1342237595 | NGC7752b | 23:46:58.62 | 29:27:32.00 | 0.016642 | 26 | -5 | 115 | 314 | 274 | 0.72 | 0.22 | 3.4 | 3.14 | 10 |
| 387 | 1342237593 | NGC7752a | 23:47:04.84 | 29:29:00.50 | 0.017321 | 21 | 46 | 235 | 294 | 336 | 0.32 | 0.19 | 4.2 | 3.26 | 10 |
| 388 | 1342236876 | CGCG381-051 | 23:48:41.72 | 02:14:23.10 | 0.030934 | 1 | 58 | 196 | 338 | 602 | 0.54 | 0.13 | 3.3 | 5.73 | 9 |
| 389 | 1342238169 | NGC7771c | 23:51:04.00 | 20:09:02.00 | 0.014213 | 99 | 108 | 272 | 300 | 229 | 0.39 | 0.31 | 3.3 | 2.69 | 10 |
| 390 | 1342197840 | Mkn331 | 23:51:26.80 | 20:35:10.00 | 0.018061 | 50 | 57 | 334 | 332 | 343 | 0.63 | 0.12 | 3.3 | 3.40 | 6 |
Note. —
aSource name as used in CASSIS and the Spitzer Astronomical Observing Request.
bJ2000 coordinates of the source observed with the IRS short high aperture of size 4.7 by 11.3.
cRedshift z of [C II] emission line assuming rest wavelength of 157.74090 m and corrected to Local Standard of Rest by HIPE.
dRadial velocity of [C II] emission line in km s-1 relative to [Ne II] line, , assuming rest wavelength of 12.81355 m for [Ne II] and corrected to Local Standard of Rest by adding VLSRCORR correction from headers in Spitzer AOR.
eRadial velocity of [C II] emission line in km s-1 relative to [Ne III] line, , assuming rest wavelength of 15.55510 m for [Ne III] and corrected to Local Standard of Rest by adding VLSRCORR correction from headers in Spitzer AOR.
fIntrinsic FWHM in km s-1 of Gaussian fit to [C II] 158 m emission line after quadratic correction for instrumental resolution having FWHM of 236 km s-1. Gaussian fits to observed profiles having FWHM instrumental resolution are arbitrarily assigned intrinsic FWHM of 100 km s-1. Measured FWHM have typical uncertainties of 1%; observed profiles with uncertainties in FWHM are shown by source name or position in cassis.sirtf.com/herschel.
gIntrinsic FWHM in km s-1 of Gaussian fit to [Ne II] 12.81 m emission line from CASSIS optimal extraction after quadratic correction for instrumental resolution having FWHM of 331 km s-1. Gaussian fits to observed profiles having FWHM instrumental resolution are arbitrarily assigned intrinsic FWHM of 100 km s-1. Measured FWHM have typical uncertainties of 50 km s-1, based on comparisons of independent spectral extractions. Observed profiles can be seen in cassis.sirtf.com.
hIntrinsic FWHM in km s-1 of Gaussian fit to [Ne III] 15.55 m emission line from CASSIS optimal extraction after quadratic correction for instrumental resolution having FWHM of 377 km s-1. Gaussian fits to observed profiles having FWHM instrumental resolution are arbitrarily assigned intrinsic FWHM of 100 km s-1. Measured FWHM have typical uncertainties of 50 km s-1, based on comparisons of independent spectral extractions. Observed profiles can be seen in cassis.sirtf.com.
iObserved equivalent width of 6.2 m PAH feature from IRS low resolution spectra. EW defines source classification, with AGN having EW(6.2 m) 0.1 m, composite (AGN plus starburst) having 0.1 m EW(6.2 m) 0.4 m, and starbursts having EW(6.2 m) 0.4 m. EW measures are given by Sargsyan et al. (2011) or Stierwalt et al. (2013) or new measures from CASSIS if not in either reference.
jRatio of line fluxes for [Ne III]/[Ne II] for optimal extractions.
kPACS spaxel corresponding to position of IRS slit, using numbering convention in Figure 1. Overlays of PACS spaxels and IRS slits on source images are illustrated by source name or position in cassis.sirtf.com/herschel.
lProjected size of 9.4″ PACS spaxel in kpc at distance of source. Angular size distances determined from Wright (2006) for H0 = 71 , =0.27 and =0.73 (using [Ne II] redshift if [C II] redshift not listed) but adopting redshift independent distances (in parentheses) when given in the NASA/IPAC Extragalactic Database (NED).
mReference for Herschel PACS observing program that is source of data: 1 = SDP-esturm-3, KPGT-esturm-1 and DDT-esturm-4; 2 = OT2-idelooze-1; 3 = OT2-lsargsyan-1; 4 = OT2-pguillar-7; 5 = KPGT-smadde01-1; 6 = KPOT-pvanderw-1; 7 = OT1-bweiner-1; 8 = OT1-dfarrah-1 and OT2-dfarrah-5; 9 = OT1-dweedman-1; 10 = OT1-larmus-1; 11 = OT1-lyoung-1; 12 = OT1-nwerner-1; 13 = OT1-sveilleu-2; 14 = GT1-lspinogl-4 and GT2-lspinogl-6; 15 = KPOT-aedge-1; 16 = OT2-nnesvadb-3; 17 = OT2-tdiazsan-1.
nSource with intrinsic [C II] FWHM 518 km s-1, or more than 2 above median FWHM.
oSource with intrinsic [Ne II] FWHM 631 km s-1, or more than 2 above median FWHM.
pSource with intrinsic [Ne III] FWHM 769 km s-1, or more than 2 above median FWHM.
qSource with 131 km s-1, or -63 km s-1, values more than 2 above or below median difference.
rSource with 160 km s-1, or -56 km s-1, values more than 2 above or below median difference.