Fluence dependent femtosecond quasi-particle and Eu2+-spin relaxation dynamics in EuFe2(As,P)2
?abstractname?
We investigated temperature and fluence dependent dynamics of the time resolved optical reflectivity in undoped spin-density-wave (SDW) and doped superconducting (SC) EuFe2(As,P)2 with emphasis on the ordered Eu2+-spin temperature region. The data indicate that the SDW order coexists at low temperature with the SC and Eu2+-ferromagnetic order. Increasing the excitation fluence leads to a thermal suppression of the Eu2+-spin order due to the crystal-lattice heating while the SDW order is suppressed nonthermally at a higher fluence.
pacs:
75.78.Jp, 74.70.Xa, 74.25.Gz, 78.47.jgI Introduction
In the iron-based superconductors familyKamihara et al. (2006, 2008) EuFe2(As,P)2Ren et al. (2009) and Eu(Fe,Co)2As2Jiang et al. (2009a) offer an interesting experimental possibility to study the competition between the ferromagnetic (FM) and superconducting (SC) order parameters that can lead to nonuniform magnetic and SC statesAnderson and Suhl (1959); Buzdin et al. (1984); Jiang et al. (2009a); Błachowski et al. (2011), since the optimal critical temperature KJeevan et al. (2011) is comparable to the Eu2+-spin ordering temperatures K.Ren et al. (2008, 2009)
While no coherent picture of Eu2+-spin ordering upon P or Co doping existsJiang et al. (2009a); Zapf et al. (2011, 2013); Nandi et al. (2014), a pure FM orderingNandi et al. (2014) coexisting with superconductivity was reported by Nandi et al.Nandi et al. (2014) in EuFe2(As0.85P0.15)2. Our recent transient magneto-optical spectroscopy studyPogrebna et al. (2015) also points towards the simple FM Eu2+-spin order in the superconducting EuFe2(As1-xPx)2 with a slow energy transfer between the FeAs-plane quasiparticles and Eu2+ spins indicating a weak magnetic-dipole dominated coupling between the SC and FM order parameters.
Here we extend our previous transient reflectivity studyPogrebna et al. (2015) first focusing briefly on the spin-density-wave dominated part of the phase diagram followed by a study of the superconducting phase-diagram region at varying excitation density to study a suppression of the coexistent orders on an ultrafast timescale.
II Experimental
II.1 Samples
Single crystals of EuFe2(As1-xPx)2 were grown by the flux method, similar to the previous reportJiao et al. (2011). Small Eu chunks and powders of Fe, As and P (Alfa Aesar, > 99.9%) were mixed together in the molar ratio of Eu:Fe:As:P = 1:5:5(1-):5 ( is the nominal P content) and sealed in an evacuated quartz ampule. After heating the mixture up to 973 K for 24 hours, the obtained precursor was thoroughly ground before being loaded into an alumina crucible. The crucible was then sealed by arc wielding in a tube made of stainless steel under atmosphere of argon, and then heated up to 1573 K over 10 hours in a muffle furnace filled with argon. After holding at 1573 K for 5 hours, the furnace was cooled down to 1223 K at the rate of 5 K/h. followed by switching off the furnace. Large crystals with size up to 4×4×0.6 mm3 could be harvested.
The as-grown crystals were characterized by X-ray diffraction, which showed good crystallinity as well as single “122” phase. The exact composition of the crystals was determined by energy dispersive X-ray spectroscopy affiliated to a field-emission scanning electron microscope (FEI Model SIRION). The measurement precision was better than 5% for the elements measured.
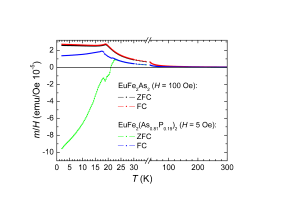
The out-of-plane magnetic susceptibilities shown in Fig. 1 are consistent with previous results. Jiang et al. (2009b); Zapf et al. (2013) From the susceptibility we infer Eu2+ spin ordering temperatures K and K in EuFe2As2 (Eu-122) and EuFe2(As0.81P0.19)2 (EuP-122), respectively. EuP-122 also shows the onset of superconductivity at K.
II.2 Optical setup
Measurements of the photoinduced reflectivity, , were performed using the standard pump-probe technique, with 50 fs optical pulses from a 250-kHz Ti:Al2O3 regenerative amplifier seeded with an Ti:Al2O3 oscillator. We used the pump photons with both, the laser fundamental ( eV) and the doubled ( eV) photon energy, and the probe photons with the laser fundamental eV photon energy. When using the doubled photon energy the scattered pump photons were rejected by long-pass filtering, while an analyzer oriented perpendicularly to the pump beam polarization was used for rejection in the case of the degenerate pump and probe photon energies. The pump and probe beams were nearly perpendicular to the cleaved sample surface (001) with polarizations perpendicular to each other and oriented with respect to the crystals to obtain the maximum/minimum amplitude of the sub-picosecond at low temperatures. The pump beam diameters were, depending on experimental conditions, in 50-100 m range with somewhat smaller probe beam diameters.
III Results
III.1 Anisotropy of the transients
At low temperatures we observe a 2-fold rotational anisotropy of the response with respect to the probe polarization at both doping levels. In the absence of information about the in-plane crystal axes orientation we denote the probe-polarization orientation according to the polarity of the observed sub-picosecond low- response as and .
In EuP-122 we found a significant variation of the anisotropy, as well as the transients shape, across the sample surface. On the other hand, as shown in Fig. 2, there is almost no variation of the , averaged transients indicating that the anisotropy variation is due to the twin domain structure on the length scale of the probe-beam diameter of 50 m. For all other measurements we therefore measured the single domain response by choosing the position on the sample surface with maximal anisotropy.
III.2 Response in the SDW state
III.2.1 Experimental data
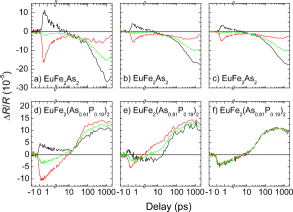
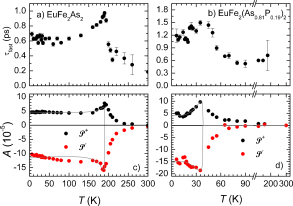
In Fig. 3 we show transients at a few characteristic temperatures for both samples. Starting at K we observe sub-picosecond isotropic transients in both samples consistent with previous results in related iron-based pnictides.Stojchevska et al. (2012, 2010); Mertelj et al. (2010) With decreasing the 2-fold anisotropy appears below K in Eu-122 and K in EuP-122. The appearance of the anisotropy is followed by a strong increase of the amplitude of the sub-picosecond response peaking near the onset of the Fe- SDW order at 188 K in Eu-122 and at significantly lower K in EuP-122 as shown in Fig. 4. The inital-picosecond-relaxation decay time, obtained from double-exponential fits shown in Fig. 3, shows a divergence-like peak at the magneto-structural SDW transition in Eu-122 while in EuP-122 it only shows a plateau with no peak, concurrent with the amplitude maximum around K. In Eu-122 the initial picosecond relaxation also appears almost twice faster than in EuP-122.
III.2.2 Discussion
The initial fast relaxation in the undoped SDW state has been analysed previously in terms of the magnon-bottleneck model.Stojchevska et al. (2010, 2012); Pogrebna et al. (2014) The data in Eu-122 are consistent with our broad-band probe results on the same samples,Pogrebna et al. (2014) with the bottleneck-fit parameters shown in Table 1.
| sample | ||
|---|---|---|
| EuFe2As2 | ||
| EuFe2(As0.81P0.19)2 |
The -dependent relaxation in doped EuP-122 is qualitatively similar to Eu-122 suggesting the presence of the magnetostructural/SDW transition at 35 K, consistent with the reported phase diagrams.Jeevan et al. (2011); Tokiwa et al. (2012); Nandi et al. (2014) The decrease of the relative charge gap magnitude with SDW suppression upon P doping is similar as in the Ba(Fe,Co)2As2.Stojchevska et al. (2012) Despite the effective SDW induced charge-gap magnitude in EuP-122 ( meV, see Table 1) falls well into the phonon energy range no significant increase of the relative number of bottleneck bosons is observed suggesting that the electron-phonon coupling in the vicinty of the SDW induced gap is weak.
III.3 Response related to Eu2+ spin ordering
Concurrently with the Eu2+-spin orderingXiao et al. (2009); Zapf et al. (2011) below K we observePogrebna et al. (2015) in both samples appearance of another much slower relaxation component with a risetime of ns in Eu-122 and ps in EuP-122 (at K) and the decay time beyond the experimental delay range (see Fig. 3). In Eu-122 the slow component is rather anisotropic, while in EuP-122 it appears almost isotropic at the chosen pump fluence.
Since the - and -dependence of this component have been already analysed and discussed previouslyPogrebna et al. (2015) we omit further details here focusing on further aspects of our data not discussed elsewhere.
III.3.1 Pump fluence dependence
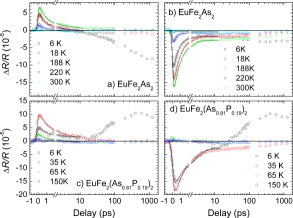
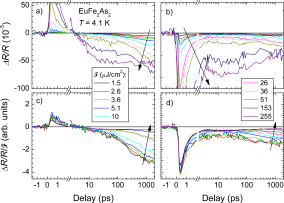
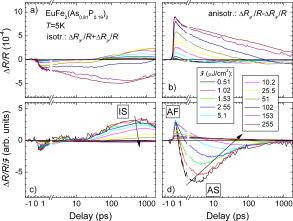
The pump fluence dependence of the response at low is shown in Figs. 5 and 6 for Eu-122 and EuP-122, respectively. While in Eu-122 the sub-picosecond response shows only a slightly sublinear -dependence (see Fig. 7) with almost -independent sub-picosecond relaxation time in the full fluence range, the slow part of the response shows a clear sublinear -dependence already at J/cm2. The saturation above J/cm2 is concurrent with an increase of the risetime beyond the experimental delay range of 1.7 ns at the highest fluences. Interestingly, independently of all transients cross zero at -ps delay. Above 0 J/cm2 an additional dynamics with a risetime on -ps and decay on a few-100-ps timescale becomes apparent.
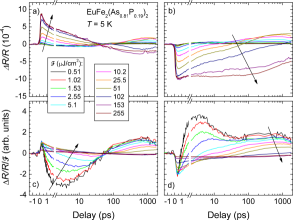
In superconducting EuP-122 the -dependence of the transients appears even more complex. There is a marked nonlinear behavior in both, the picosecond and nanosecond responses. The amplitude of the initial fast response with a sub-ps risetime is linear up to J/cm2 and clearly saturates above J/cm2 (see Fig. 8).
The shape of the fast response, contrary to Eu-122, strongly depends on the fluence. For the polarization at the lowest we observe after the initial sub-ps negative transient an increase of the signal with zero crossing to an intermediate value on a timescale of 2 ps followed by a partial decay on a -ps timescale with no further decay within our time window (see Fig. 6 ). With increasing the initial increase becomes slower with zero crossing moving beyond ps, while the 10-ps partial decay vanishes above J/cm2.
For the polarization the initial-few-ps response at low is similar to the polarization response with the opposite sign. At longer delays, beyond ps, however, the slow component is observed causing a second zero crossing with a characteristic risetime of ps at the lowest , which increases beyond the experimental delay range with increasing . As a result, appears rather isotropic at long delays.
The slow response is linear in up to J/cm2 at K showing saturation with increasing (see inset to Fig. 8). The amplitude of the initial fast relaxation saturates above J/cm2. Concurrently it slows down (Fig. 6) and starts to overlap with the onset of the slow one.
Above J/cm2 the shape of the slow response shows an apparent qualitative change without the long delay zero crossings in both polarizations resulting in a change of sign of the nanosecond-timescale transient reflectivity.
III.3.2 Discussion
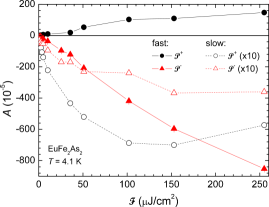
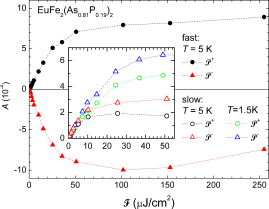
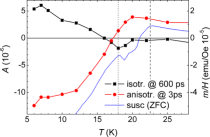
On the basis of a detailed temperature and magnetic field dependence we have shown previously Pogrebna et al. (2015) that the slow component can be associated with Eu2+ spin demagnetization in both the AFM and FM states. The saturation of the slow response at high excitation fluences can therefore be associated with a complete suppression of the Eu2+ sublattice magnetizations due to the lattice temperature rise above the magnetic ordering temperatures. Taking into account the heat capacityJeevan et al. (2008) and opticalWu et al. (2009) data we estimate111We obtain the light penetration depth of nm at eV . that the surface transient temperature rise due to the photoexcitation is K at J/cm2. This is consistent with the observed fluence dependence in EuP-122, where the departure from linearity, that is associated with the destruction of the Eu2+ magnetic order at the surface is observed at similar fluences (see Figs. 7 and 8). The departure from linearity is followed by a complete saturation above J/cm2 where the temperature within the complete probed volume exceeds the magnetic ordering , as expected from the saturation modelKusar et al. (2008), where the saturation fluence value depends on the geometry and the optical penetration depth of the beams.
In Eu-122 the saturation is, despite the same geometry of the beams, observed above J/cm2 only, which is times higher than in EuP-122. At this fluence the peak surface lattice temperature is estimated to be K. Deeper in the sample at a probe penetration depth K still significantly exceeds . The reason for the difference could be associated with the slower risetime in Eu-122 that prevented us to measure the true amplitude of the response. Instead, the value at the longest delay was measured, which is still on the rising part of the signal, and depends on both, the amplitude of the response and the rate of the magnetization suppression. It is reasonable to expect that the rate depends on and as a result on the excitation density also for .
Let us now focus on the complex fluence dependence of the transients shape in the SC EuP-122. In the absence of an external magnetic field at an intermediate 10 J/cm2 the slow component appears rather isotropic (see Fig. 3) while the anisotropy was previouslyPogrebna et al. (2015) observed only in high magnetic field. The anisotropy of the slow component observed at low excitation fluences in zero magnetic field (see Fig. 8) could therefore be a consequence of an interplay with another anisotropic component that saturates at a rather low and is masked by other nonsaturated components at increased .
To test this hypothesis we calculate the isotropic part, , and the anisotropic part, , of the data shown in Fig. 6 and plot them in Fig. 9.
The slow part of the obtained isotropic (IS) response is below J/cm2 rather similar to the response in Eu-122 and -parallel responses in high magnetic fieldPogrebna et al. (2015) in both samples and it can be associated with the out-of-plane Eu2+ demagnetization upon the photoexcitation.
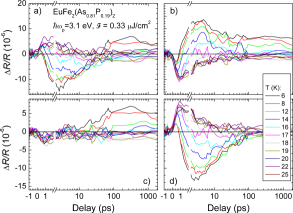
The anisotropic component of the low- response is more complex consisting from a fast positive component, marked AF in Fig. 9 (d) and a slower negative component marked AS, which is clearly observed only at low .
While component AF can be clearly related to the Fe- SDW ordering present below 35 K in our sample the origin of component AS appears more elusive. In Ba(Fe,Co)2As2 a similar slowly relaxing anisotropic response was observed and clearly associated with superconductivity.Stojchevska et al. (2012); Torchinsky et al. (2011) In optimally doped Ba(Fe,Co)2As2 this SC response is completely saturated above J/cm2 due to the nonthermal destruction of the SC state,Stojchevska et al. (2012) while in underdoped Ba(Fe,Co)2As2 and Sm(Fe,Co)AsO,Mertelj et al. (2013) with lower s, s are even lower and the magnitudes of the SC response smaller.
Since component AS is similar to a possible anisotropic SC response and the data in Fig. 9 (b) and (d) suggest, that is below J/cm2, we measured dependence also at extremely low J/cm2 as shown in Fig. 10. Component AS vanishes with increasing at K [see inset to Fig. 10 (b)], significantly below the bulk (onset) of 22.7 K and rather close to K. As a result, despite the similarity of component AS behaviour to the SC response in Ba(Fe,Co)2As2, a firm assignment of component AS to the SC response is not possible. However, in Sm(Fe,Co)AsOMertelj et al. (2013) a similar discrepancy between the bulk and the temperature at which the transient SC component vanishes was observed so a tentative assignment of the SC response to component AS in EuP-122 is plausible.
Component AF, which corresponds to the Fe- SDW order, shows very similar saturation behaviour to component IS with the linear -dependence up to a slightly higher threshold fluence, J/cm2. This fluence would correspond to a transient lattice heating of K, that is just slightly lower than the equilibrium SDW transition temperature [See Fig. 4 (d)], K, suggesting almost thermal destruction of the SDW order. However, by taking into account: the fast sub-picosecond -independent risetime, a limited accuracy of the transient-heating estimate and the small lattice heat capacity in this -range the small difference between and does not imply, that the thermal destruction of the SDW state is more likely than a fast athermal subpicosecond melting of the SDW order.
The relaxation time of component AF increases with increasing fluence. At low fluences, where the SDW gap is not yet completely suppressed, we attribute it to the bottleneck-governed SDW order recovery dynamicsPogrebna et al. (2014), as in the undoped SDW iron pnictidesStojchevska et al. (2010, 2012); Pogrebna et al. (2014). At the fluences near and above the threshold the recovery slows down to tens of picoseconds near the threshold to beyond a few hundred picoseconds at the highest experimental fluence. On this timescales the bottleneck mechanism can not be operative and the nematic lattice-strain dynamics, that was observed recentlyPatz et al. (2014) to extend to several 100 ps near the magnetostructural transition temperature, might determine the characteristic time scale at these fluences. However, on the nanosecond timescale the heat diffusion out of the experimental volume also takes place. Since no clear evidence for a slow anisotropic dynamics is observed in the low-excitation-density response at higher , where the nematic fluctuations dominate the response, the timescale is most likely governed by heat diffusion.
IV Summary and conclusions
Transient optical reflectivity was investigated in EuFe2(As1-xPx)2 in the undoped, , SDW and doped, , SC state samples as a function of the excitation fluence. The characteristic anisotropic subpicosecond transient reflectivity response indicates the presence of the SDW order below K also in the SC sample suggesting a coexistence of Fe--SDW, SC and EuFM orders. At both dopings a characteristic bottleneck behaviour of the fast picosecond transient reflectivity response due to a partial charge gap present in the SDW state was observed, consistent with previous results.Pogrebna et al. (2014)
With increasing excitation pulse fluence the saturation of different transient reflectivity components indicates a suppression of the SC order below J/cm2, followed by a suppression of the EuFM order at J/cm2 (at K). The SDW order is suppressed in the SC sample at J/cm2 while no suppression is evident in the undoped sample up to J/cm2.
While the suppression of the EuFM order appears to be thermal due to the lattice temperature rise above the respective magnetic ordering temperatures, the SDW order suppression in the SC sample is nonthermal with the peak lattice temperature reaching only K below . The slow thermal suppression of the EuFM order further confirms the rather weak couplingPogrebna et al. (2015) of the Eu2+ spins to the rest of the system.
Acknowledgements.
Work at Jozef Stefan Institute was supported by ARRS (Grant No. P1-0040). We would like to thank Z. Jaglicic for magnetic susceptibily measurements.?refname?
- Kamihara et al. (2006) Y. Kamihara, H. Hiramatsu, M. Hirano, R. Kawamura, H. Yanagi, T. Kamiya, and H. Hosono, Journal of the American Chemical Society 128, 10012 (2006).
- Kamihara et al. (2008) Y. Kamihara, T. Watanabe, M. Hirano, H. Hosono, et al., J. Am. Chem. Soc 130, 3296 (2008).
- Ren et al. (2009) Z. Ren, Q. Tao, S. Jiang, C. Feng, C. Wang, J. Dai, G. Cao, and Z. Xu, Physical Review Letters 102 (2009), 10.1103/PhysRevLett.102.137002.
- Jiang et al. (2009a) S. Jiang, H. Xing, G. Xuan, Z. Ren, C. Wang, Z.-A. Xu, and G. Cao, Phys. Rev. B 80, 184514 (2009a).
- Anderson and Suhl (1959) P. W. Anderson and H. Suhl, Phys. Rev. 116, 898 (1959).
- Buzdin et al. (1984) A. I. Buzdin, L. N. Bulaevskiĭ, M. L. Kulich, and S. V. Panyukov, Soviet Physics Uspekhi 27, 927 (1984).
- Błachowski et al. (2011) A. Błachowski, K. Ruebenbauer, J. Żukrowski, Z. Bukowski, K. Rogacki, P. J. W. Moll, and J. Karpinski, Phys. Rev. B 84, 174503 (2011).
- Jeevan et al. (2011) H. S. Jeevan, D. Kasinathan, H. Rosner, and P. Gegenwart, Phys. Rev. B 83, 054511 (2011).
- Ren et al. (2008) Z. Ren, Z. Zhu, S. Jiang, X. Xu, Q. Tao, C. Wang, C. Feng, G. Cao, and Z.-A. Xu, Physical Review B 78 (2008), 10.1103/PhysRevB.78.052501.
- Zapf et al. (2011) S. Zapf, D. Wu, L. Bogani, H. S. Jeevan, P. Gegenwart, and M. Dressel, Phys. Rev. B 84, 140503 (2011).
- Zapf et al. (2013) S. Zapf, H. S. Jeevan, T. Ivek, F. Pfister, F. Klingert, S. Jiang, D. Wu, P. Gegenwart, R. K. Kremer, and M. Dressel, Physical Review Letters 110, 237002 (2013).
- Nandi et al. (2014) S. Nandi, W. T. Jin, Y. Xiao, Y. Su, S. Price, D. K. Shukla, J. Strempfer, H. S. Jeevan, P. Gegenwart, and T. Brückel, Phys. Rev. B 89, 014512 (2014).
- Pogrebna et al. (2015) A. Pogrebna, T. Mertelj, N. Vujičić, G. Cao, Z. A. Xu, and D. Mihailovic, Sci. Rep. 5, (2015).
- Jiao et al. (2011) W.-H. Jiao, Q. Tao, J.-K. Bao, Y.-L. Sun, C.-M. Feng, Z.-A. Xu, I. Nowik, I. Felner, and G.-H. Cao, EPL (Europhysics Letters) 95, 67007 (2011).
- Jiang et al. (2009b) S. Jiang, Y. Luo, Z. Ren, Z. Zhu, C. Wang, X. Xu, Q. Tao, G. Cao, and Z.-A. Xu, New Journal of Physics 11, 025007 (2009b).
- Stojchevska et al. (2012) L. Stojchevska, T. Mertelj, J. Chu, I. Fisher, and D. Mihailovic, Physical Review B 86, 024519 (2012).
- Stojchevska et al. (2010) L. Stojchevska, P. Kusar, T. Mertelj, V. V. Kabanov, X. Lin, G. H. Cao, Z. A. Xu, and D. Mihailovic, Phys. Rev. B 82, 012505 (2010).
- Mertelj et al. (2010) T. Mertelj, P. Kusar, V. V. Kabanov, L. Stojchevska, N. D. Zhigadlo, S. Katrych, Z. Bukowski, J. Karpinski, S. Weyeneth, and D. Mihailovic, Phys. Rev. B 81, 224504 (2010).
- Pogrebna et al. (2014) A. Pogrebna, N. Vujičić, T. Mertelj, T. Borzda, G. Cao, Z. A. Xu, J.-H. Chu, I. R. Fisher, and D. Mihailovic, Phys. Rev. B 89, 165131 (2014).
- Tokiwa et al. (2012) Y. Tokiwa, S.-H. Hübner, O. Beck, H. S. Jeevan, and P. Gegenwart, Phys. Rev. B 86, 220505 (2012).
- Chu et al. (2010a) J.-H. Chu, J. G. Analytis, K. De Greve, P. L. McMahon, Z. Islam, Y. Yamamoto, and I. R. Fisher, Science 329, 824 (2010a).
- Chu et al. (2010b) J.-H. Chu, J. G. Analytis, D. Press, K. De Greve, T. D. Ladd, Y. Yamamoto, and I. R. Fisher, Phys. Rev. B 81, 214502 (2010b).
- Dusza, A. et al. (2011) Dusza, A., Lucarelli, A., Pfuner, F., Chu, J.-H., Fisher, I. R., and Degiorgi, L., EPL 93, 37002 (2011).
- Xiao et al. (2009) Y. Xiao, Y. Su, M. Meven, R. Mittal, C. M. N. Kumar, T. Chatterji, S. Price, J. Persson, N. Kumar, S. K. Dhar, A. Thamizhavel, and T. Brueckel, Physical Review B 80 (2009), 10.1103/PhysRevB.80.174424.
- Jeevan et al. (2008) H. S. Jeevan, Z. Hossain, D. Kasinathan, H. Rosner, C. Geibel, and P. Gegenwart, Phys. Rev. B 78, 052502 (2008).
- Wu et al. (2009) D. Wu, N. Barišić, N. Drichko, S. Kaiser, A. Faridian, M. Dressel, S. Jiang, Z. Ren, L. J. Li, G. H. Cao, Z. A. Xu, H. S. Jeevan, and P. Gegenwart, Phys. Rev. B 79, 155103 (2009).
- Note (1) We obtain the light penetration depth of nm at eV .
- Kusar et al. (2008) P. Kusar, V. Kabanov, J. Demsar, T. Mertelj, S. Sugai, and D. Mihailovic, Physical Review Letters 101, 227001 (2008).
- Torchinsky et al. (2011) D. H. Torchinsky, J. W. McIver, D. Hsieh, G. F. Chen, J. L. Luo, N. L. Wang, and N. Gedik, Phys. Rev. B 84, 104518 (2011).
- Mertelj et al. (2013) T. Mertelj, L. Stojchevska, N. D. Zhigadlo, J. Karpinski, and D. Mihailovic, Phys. Rev. B 87, 174525 (2013).
- Patz et al. (2014) A. Patz, T. Li, S. Ran, R. M. Fernandes, J. Schmalian, S. L. Bud’ko, P. C. Canfield, I. E. Perakis, and J. Wang, Nat Commun 5 (2014).