Compact Measurement Station for Low Energy Proton Beams
Abstract
A compact, remote controlled, cost efficient diagnostic station has been developed to measure the charge, the profile and the emittance for low energy proton beams. It has been installed and tested in the proton beam line of the Project Prometheus at SANAEM of the Turkish Atomic Energy Authority.
I Introduction
Current experiments with ever increasing beam intensities are pushing proton accelerators to higher beam powers. Moreover a large number of upgrades or new high power accelerators are on the horizon. These modern proton beam lines start with an ion source followed by a low beta accelerator cavity, generally a radio frequency quadrupole. It is crucial to know the beam properties right after the ion source and just before the low beta accelerator cavity in order to optimize the low energy beam transport (LEBT) system. The properties in question are the beam charge, the beam profile and the beam emittance. A simple, compact and efficient diagnostic station to measure these quantities, is a requirement for all low energy beamlines. We have developed such a compact, remote controlled, cost efficient diagnostic station to this end. The diagnostic station can be inserted between the LEBT solenoids, allowing the beam to pass though during normal operations. When a beam related information is needed the relevant sensor device can be moved into measurement position and data can be obtained in a completely automated way. The remainder of the manuscript explains the requirements, the design and the tests of this compact measurement station. It has been installed in the proton beam line of the SANAEM Project Prometheus (SPP) at the Turkish Atomic Energy Authority (TAEK)’s Saraykoy Nuclear Research and Training Center (SANAEM) overall .
II Requirements and Design
Given the previously discussed requirements, our approach to the problem was to envisage a closed box under vacuum (at least 10-6 mbar) which would receive the beam, do the necessary charge, profile and emittance measurements and provide analogue outputs. The simplicity and efficiency requirement could be met by simply inserting the measurement device into the beam during the beam diagnostics data collection and by pushing it out when completed. The precise motion of the measurement devices can be achieved by using computer controlled servo motors equipped with flanges and o-rings to preserve the vacuum. Such a design could be used in any beam line by simply transporting or duplicating the measurement box. A compact measurement box design that would match these criteria is shown in Fig.1 and its details are discussed below.
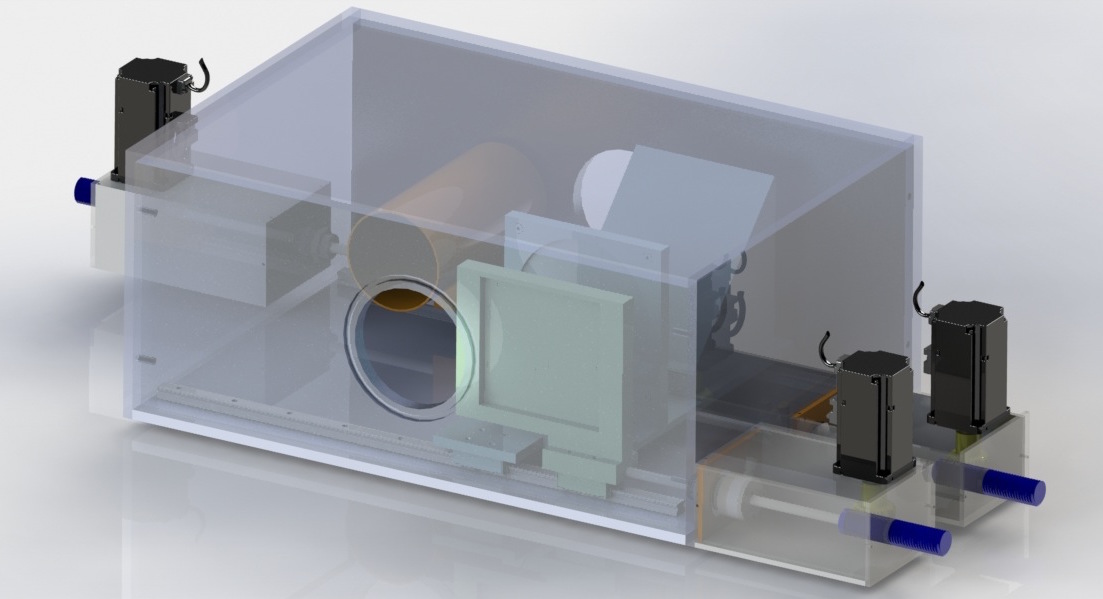
The charge measurement can be accomplished by collecting the beam in a Faraday Cup. This charge can be transferred out of the box as an analogue signal which either can be digitized by a QDC or can be read by an ammeter.
The beam profile can be obtained by intercepting the beam with an appropriate scintillator. The scintillation light is rotated 90 degrees by using a 45 degrees planar mirror and then collected with a digital camera overseeing the mirror through a glass opening.
The same setup of the beam profile can be used for the emittance measurement with an additional pepper pot plate. The pepper pot method has been selected for its relative simplicity and cost effectiveness. It also permits measuring emittance values in and planes simultaneously. The associated software to convert camera output to emittance values will be discussed in section III.2. After considering the challenges of engineering and production of a detector, we aimed to manufacture the cheapest and easiest device while trying to keep it reliable and robust. Therefore, the Pepper Pot(PP) method steps forward since it only necessitates a PP plate, a scintillating view screen, and a commercially available camera or CCD, as the only required electronics for DAQ except the computer. The challenge in this detector will be the design, since the PP is supposed to have a beam specific design. Also, one should underline that PP has a divergence pre-requisite for the beam to be measured.
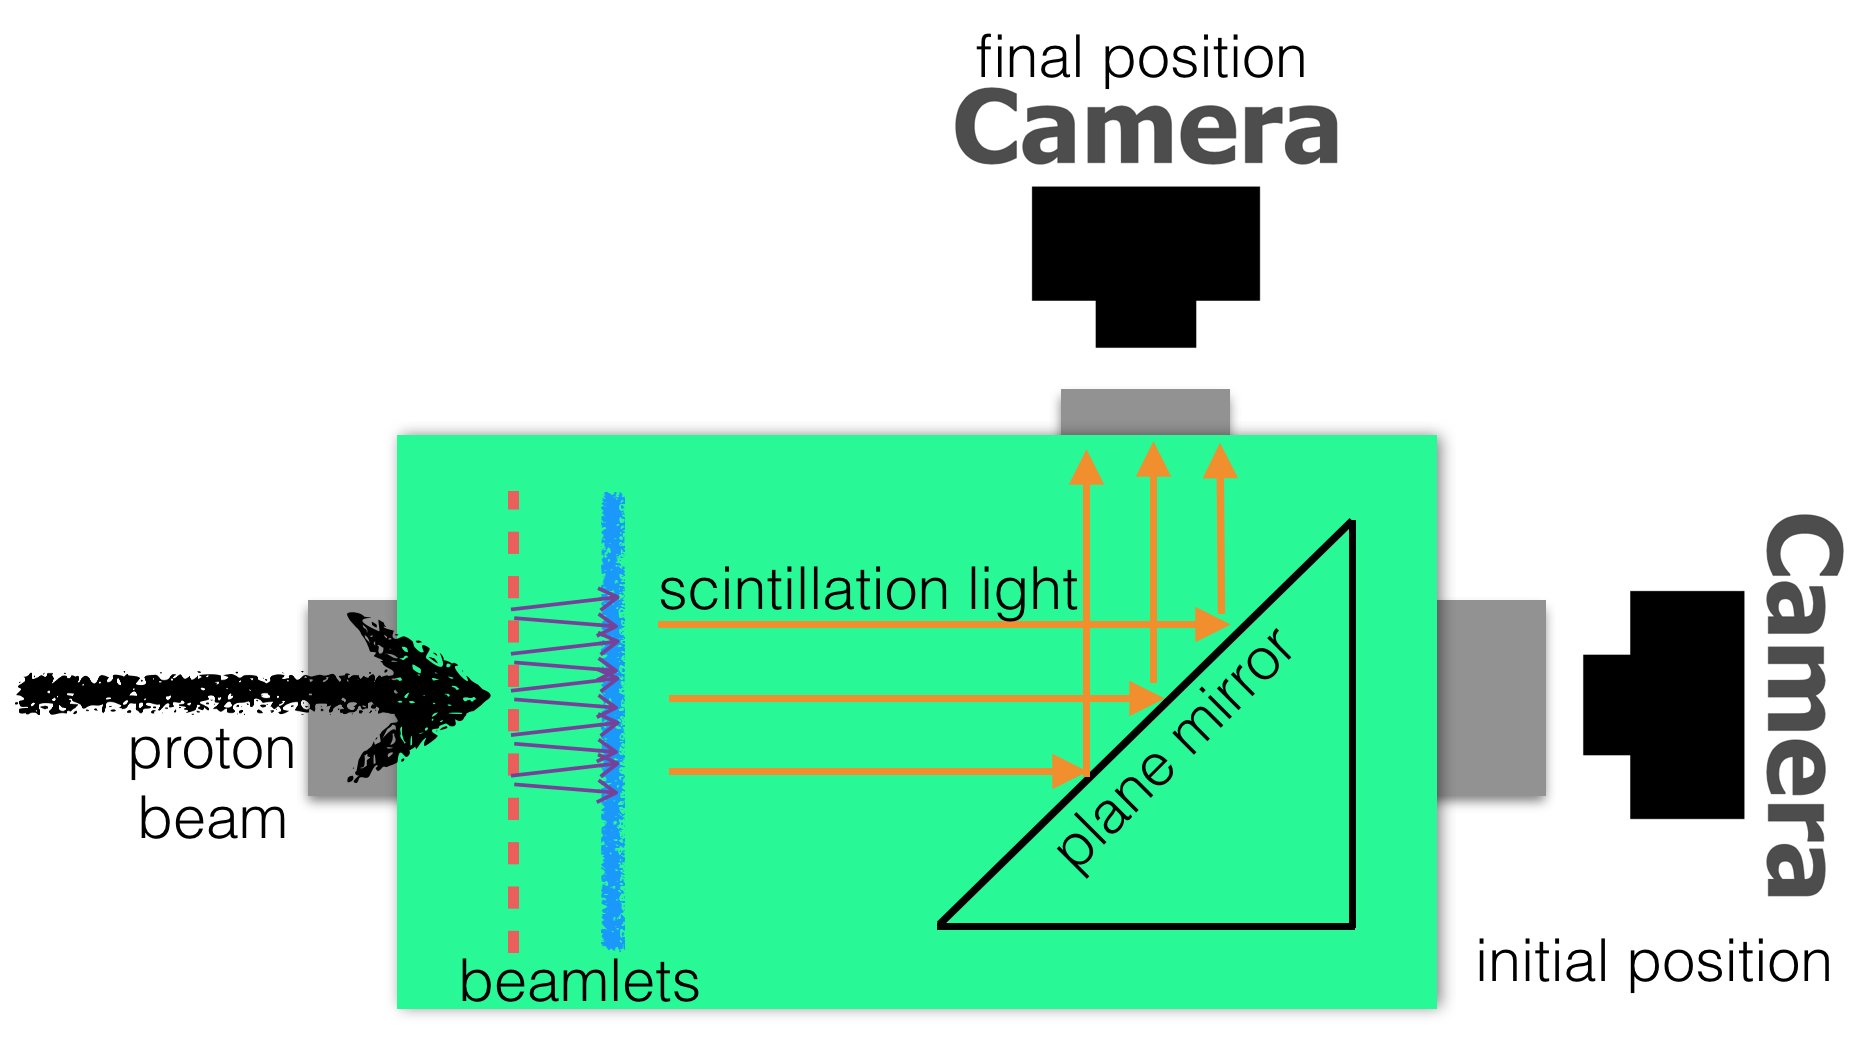
A diagram of the emittance and profile measurement apparatus is given in Fig.2. The initial beam moving from left to right hits the pepper pot plate shown by a dashed vertical line, producing beamlets shown by diverging arrows which in turn hit the scintillation screen shown by a rough vertical line. The scintillation light is initially read from the output end of the measurement station, and finally from the top of the box using a 45 degree planar mirror shown as a triangle.
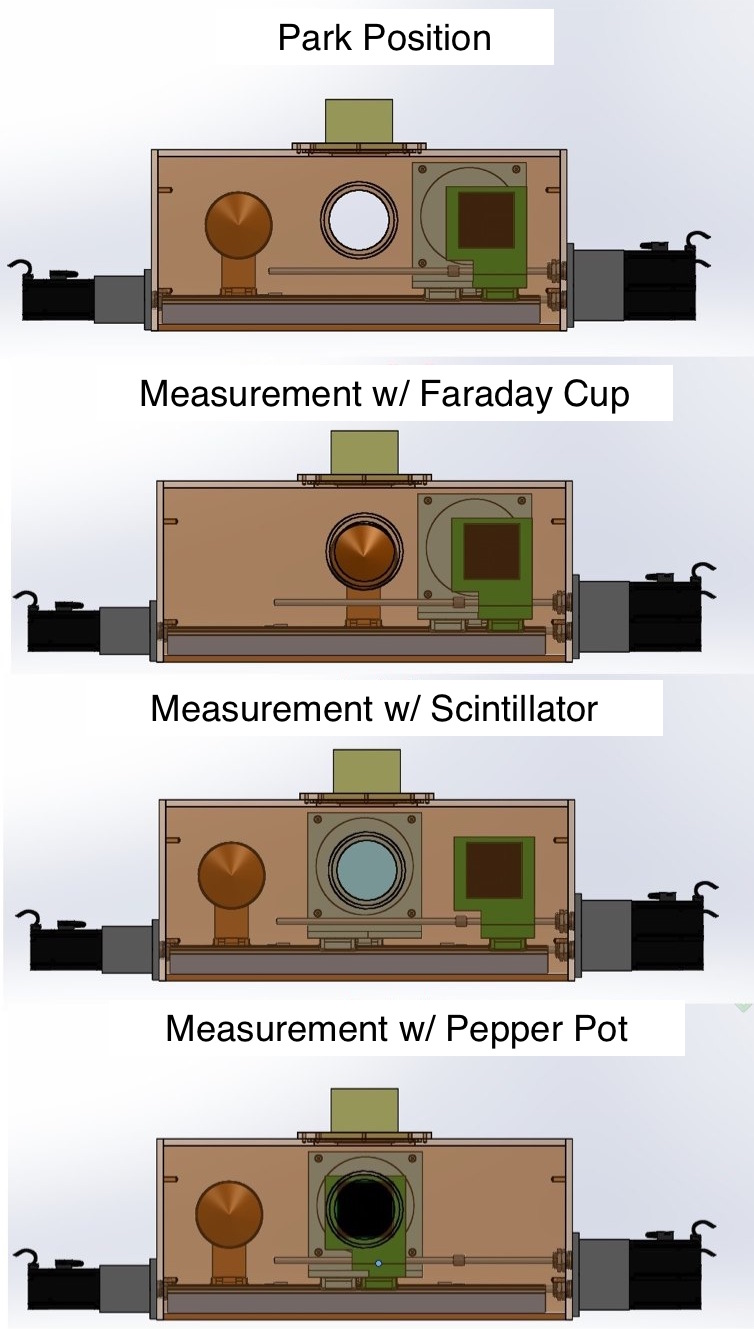
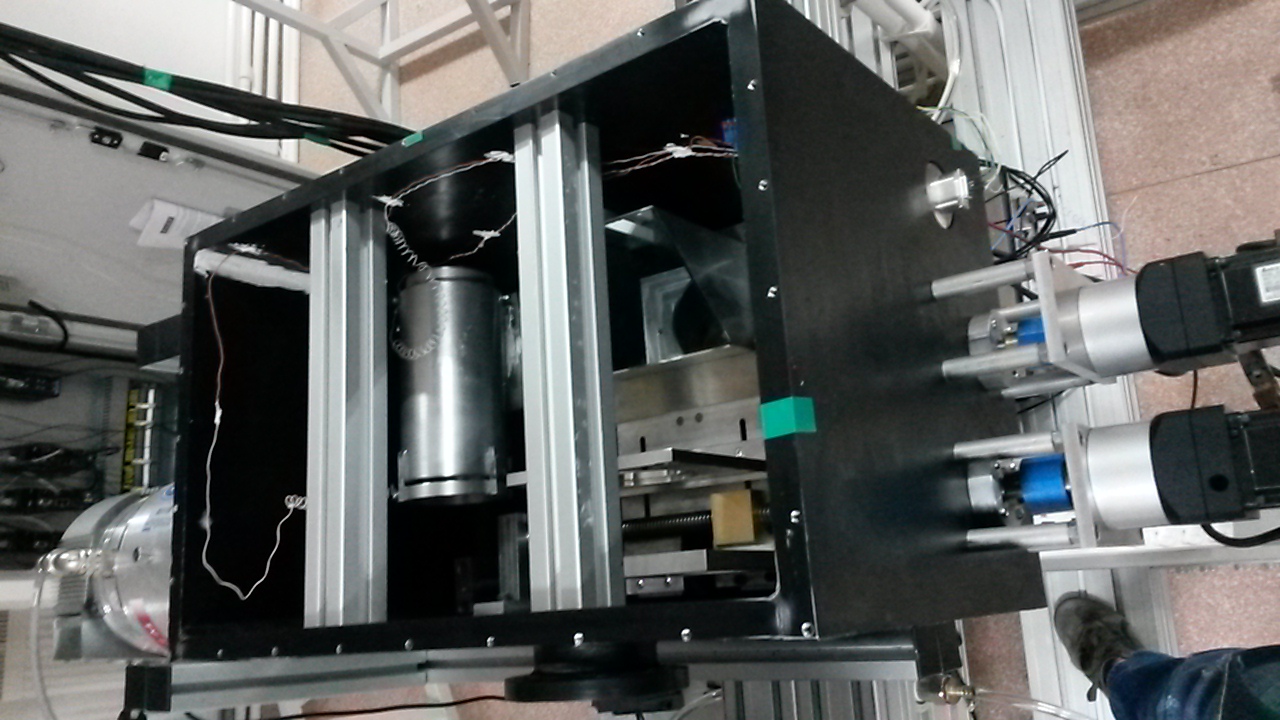
The diagnostic station’s motion system is driven by external servo motors with reducers. The diagnostic components like the scintillator, PP plate, faraday cup are moved into the beam and out to the parking position on endless screws with linear bearings. The servo motors provide a linear accuracy of 0.4 m. Fig 3 contains the sensors of the measurement box in four possible positions. These are (listed from top to bottom) as the parking position to let the beam go through, charge, beam profile and emittance measurement positions.
II.1 Mechanical Design and Manufacture
Diagnostic Station’s container box has been designed as a 380x620x395 mm rectangular box, and manufactured from (6000) Aluminum plates of 20mm thickness. The main body has been welded together, as well as the flanges which serve as ports to other components such as vacuum gauge, and beam pipes. The top cover is attached to the main body by mechanical means using screws. The vacuum sealing between the body and the top cover is achieved by using an Acrylonitrile Butadiene Rubber o-ring. The finished diagnostics station including the servo motors, camera setup, vacuum pump and vacuum gauge is currently installed at the SPP beamline, between the low energy beam transport solenoids.
II.2 Structural Analysis
The vacuum produced in the measurement box leads a force acting on the inner walls of the system. Bending rate of the system in vacuum needed to be under acceptable thresholds. The vacuum behavior of the box body made from Aluminum alloy is simulated with FEM technique using ANSYS 14.0 ansys .
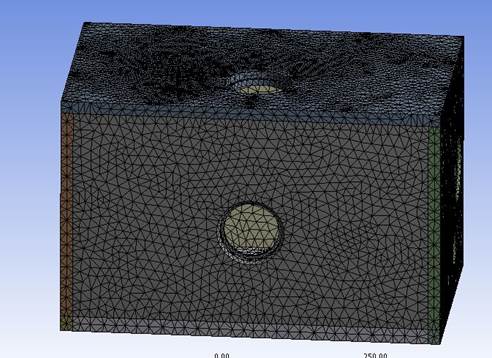
The mesh structure implemented for this analysis is shown in Fig.4. It contains 142324 elements and 237348 nodes. The element quality has been investigated by orthogonal quality method and it is observed that the result is above 0.3. The pressure on outer walls is 1 Atm, while, as a result of vacuum on inner walls it is Torr. The body is fixed from two points at the bottom. The gravity effect has been also included in the analysis.
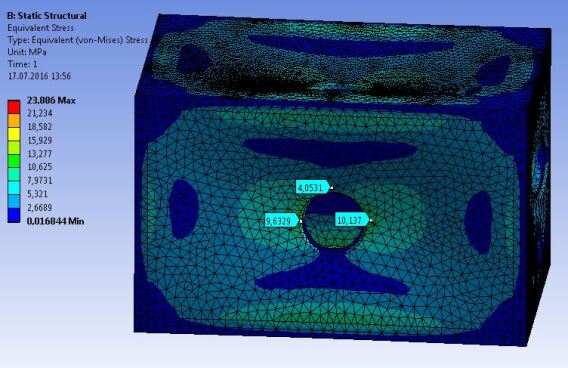
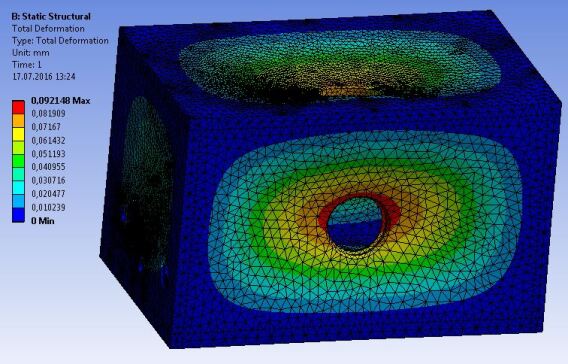
According to the results of the analysis, the highest stress has been observed in surroundings of the beam pipe which is placed in the middle of the body. Figure 5 left side shows that the stress rate is below 11 Mpa in this region. From the right side image of the same figure it is understood that the deformation of the geometry is less than 10 microns. The safety factor is calculated as 10.72 by using the maximum shear stress method. It is obvious that the obtained stress and deformation rates are within acceptable ranges.
II.3 Thermal Simulations
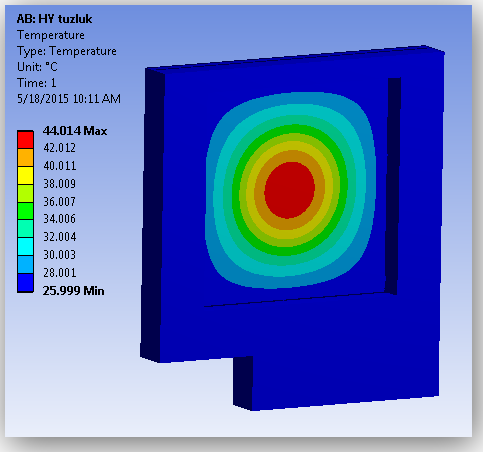
In the decision of PP plate, not only the radii of the pinholes are crucial, but also the thickness of the plate plays a significant role. When the protons hit the inner surface of the pinhole, they can free secondary particles which will introduce noise, therefore, the width of the PP plate has been determined to be as small as possible which we conclude as 100 m. This thickness is feasible to form and maintain a flat shape while the passage of particles calculated by Bethe-Bloch formula is well-above this thickness. Therefore, we only leave with the heat and its consequences such as deformation and thermal expansion. These two reasons forced us to consider Tungsten, Rhenium, Tantalum kind of refractory metals. We end up to use Tungsten which has the lowest thermal expansion coefficient. The following simulations are made with ANSYS. If we consider the worst case scenario or in other words, more heat-releasing situation which is when we get 20 mA of current at 20 keV of ion-source extraction within a beam size of =3 mm. Therefore, we have a total of 4 when the duty factor is set to 1%, yet we consider to take 100 seconds of measurement. The preliminary result calculating the heat release for sole PP plate of thickness of 100 m with a size 10 by 10 cm is a rise of 22∘C in the plate temperature as it is shown in Figure 6. For the initial application of the measurement station, the SPP LEBT, a repetition rate of 1Hz corresponds to a duty factor of about %0.015. Such a low duty factor can lead to a lack of space charge neutralization. And in turn, the space charge effects may cause emittance growth in pulsed beams that may not be there in DC beams with neutralization. However, since the designed RFQ will also operate in pulsed mode, the measured emittance value is the one that would matter for this case. Additionally for the first application, the low (1mA) current beam’s space charge effects could be considered negligible for practical purposes.
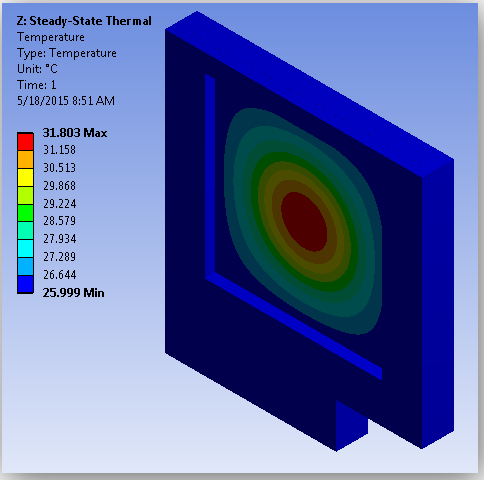
Hence, we consider to support the tungsten PP plate with an Aluminum Plate with a couple of times larger in thickness and in pinhole diameter which will to maintain the rigidity of the frontier W plate, and to avoid over-heating. Besides, the W and Al plates are held with Al rails and Al frame such that the heat is conducted through the electrically grounded and air cooled diagnostics box. The simulated maximum temperature of complex illustrated in Fig.7 is about 32∘C, which will result in negligible lengthy thermal expansion, yet providing fairly enough environment for fault free operation.
III Software Aspects
III.1 Control and Data Acquisition
The observation and control of the moving parts of the diagnostic station which has a closed structure has been done. For the realization of this task, the following components have been added to the system.
Electric Motor: Since a measurement system will be controlled, it is necessary to know the position of the components continuously and to move them to the desired positions with high precision. For this reason, servo motors have been used on the system. By using this motors, position and velocity of the shaft can be controlled accurately in a very wide range of rpm without any additional component. To satisfy the needs of high repeatability, safety and reliability of the system, the industrial standards have been adopted. Thus, both their communication capabilities and structures, the servo motors which fit to industrial applications have been used. Resulting from their low maintenance needs and more stable characteristics, the AC servo motors have been preferred. Both the advantage of price/performance ratio and the brands’ technical support capabilities at the region, Delta AC ASD-A2 servo motor and driver have been chosen.
Sensors: As mentioned before, servo systems can provide position information continuously. But they need a reference point to identify their actual position when the system turned on. Thus, the servos are provided to move a homing position in order to reset the position data. When they reached their homing positions, a digital signal is sent to the control unit for each by sensors. Because of their structural simplicities and robust characteristics, mechanical limit switches have been used. For safety reasons, the limit switches have been adjusted to normally closed configuration.
Reducers: The servo motors are outside of the diagnostic station which works in a high vacuum environment. The preventions are taken to measure vacuum leaks between the motor shafts and the station cause to mechanical strains. In order to tolerate the effects of the mechanical strains on the servo motors, reducers are used. The negative effect of the reducers to the speed of movable parts can be neglected in view of needs of the system and the servo motors’ top speed. In addition, by using this reducers, the angular sensitivity of the servo motors are increased. Because of their compact structure, high mechanical efficiency and the system’s mechanical needs, 1/10 of conversion rate planetary type reducers have been chosen.
Controller: To control positioning and activation precisely, to operate all the control algorithms including alarm state and to communicate with user interface and all other components, a controller structure is needed. Siemens S7-1200 PLC is used to meet such requirements in industrial standards.
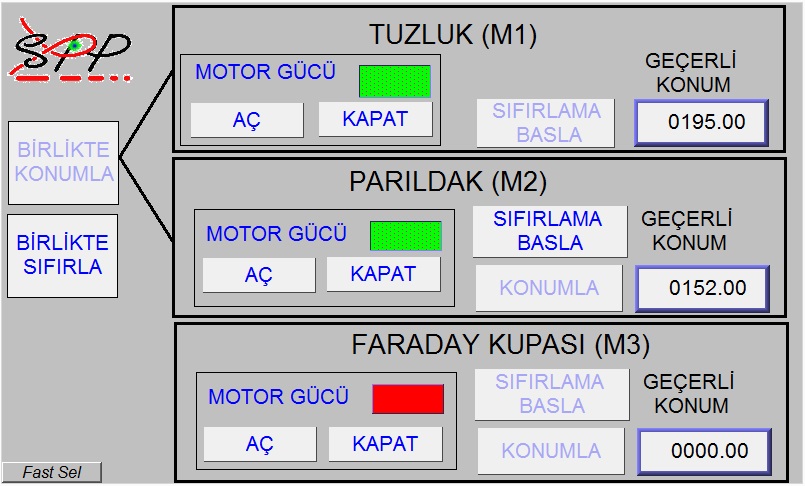
User Interface: In order to visualize the collected data gathered in the PLC unit and to send the user commands to PLC unit to process them on demand, a user interface is needed. Thus, a Weintek 8100ie series HMI(Human Machine Interface) unit has been placed on the control panel, which is also containing the PLC unit. The main factor of choosing this 10” sized touch panel is to reach the tag based addressing data of the PLC unit directly. This provides great convenience especially in terms of programming of the HMI unit. A copy of the operator panel GUI, seen on Fig.8, may also be operated on a personal computer connected to the system.
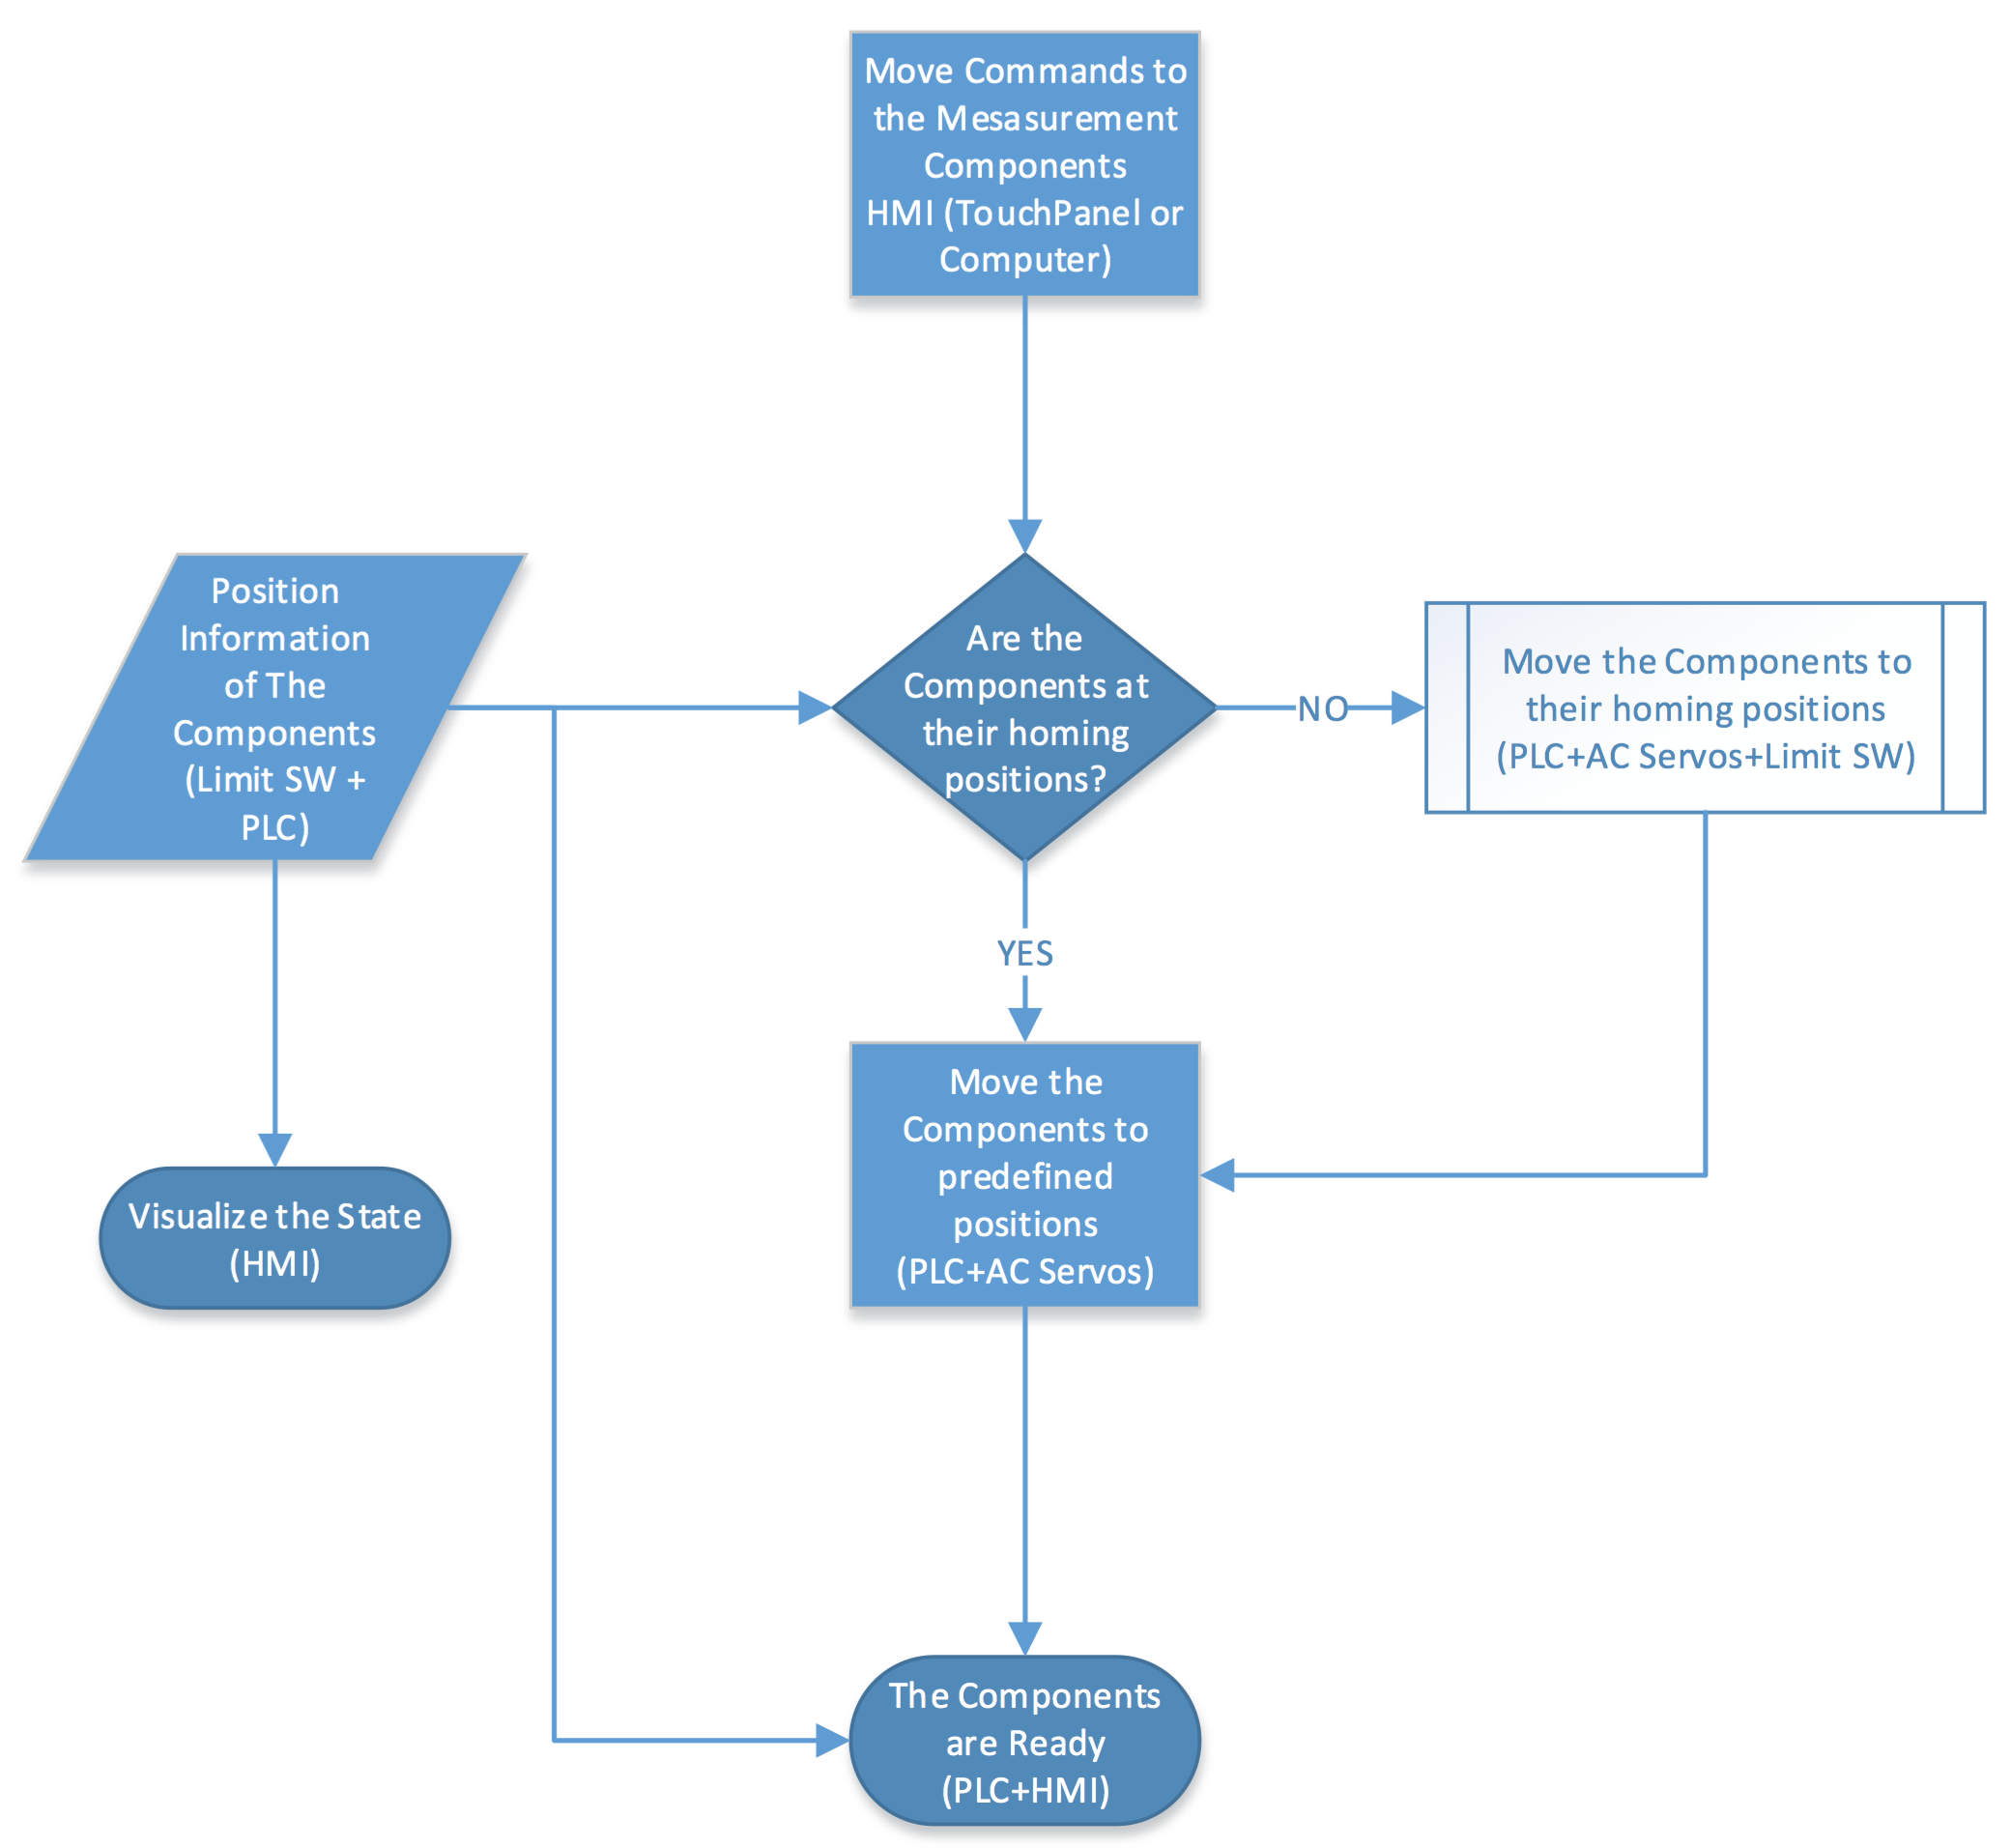
The operation of the system operation diagram is shown in Fig.9. The user commands are transmitted and the current status of the system is monitored via the HMI system which can be an operator panel and (or) the computer screen.
III.2 Emittance Measurement
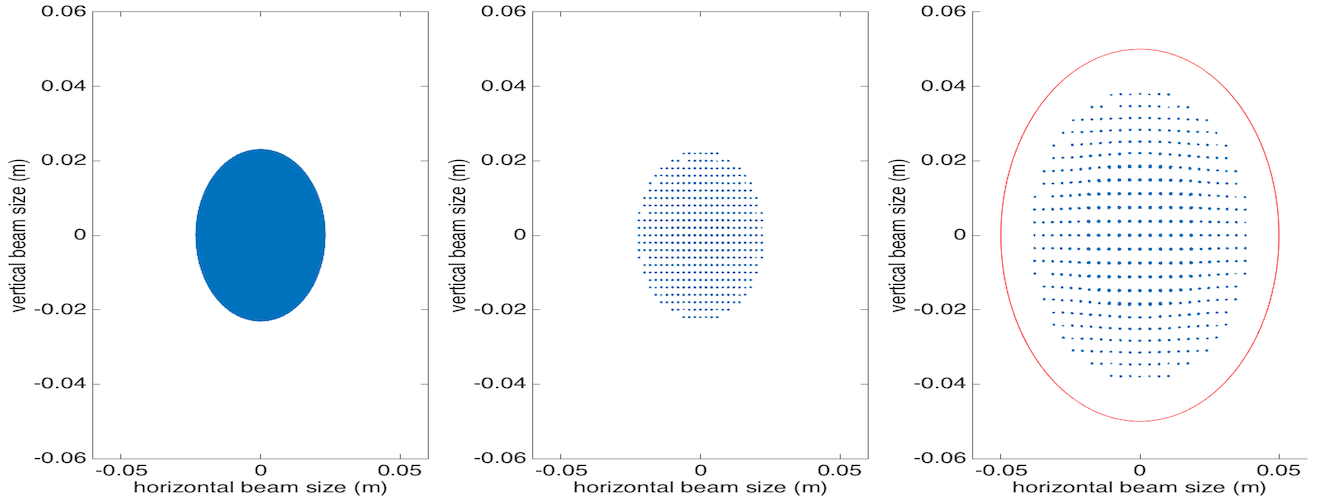
Pepper pot (PP) emittance meter is simultaneous way of measuring both transverse emittances. The method is similar to the work at GSIGSI and other more recent studiesPPot1 ; PPot2 ; PPot3 ; PPot4 . Briefly, the PP is a device that samples the beam through a two dimensional pinhole grid and allows measurements of the beam parameters from the photographic images. The validity of the algorithm and its implementation are checked using a proton beam created in IBSIMU, an ion optical computer simulation package for ion optics, plasma extraction and space charge dominated ion beam transport using Vlasov iteration IBSIMU . The initial proton beam profile is shown on the leftmost plot of Fig.10. The remaining particles, after sifting out both horizontally and vertically through the PP, are shown in the middle plot. The particles not passing through the holes are dropped from this simple tracking and simulation software written in MATLABmatlab . Finally on the remaining particles are drifted along the beam direction to hit the screen, which is treated as a CCD camera for practical purposes due to the linearity of the particle motion and the proportionality of the light output to the incident beam. The expected image on the screen is shown in the same figure rightmost plot.
The reconstruction of the 4-D phase space is made by three steps. First, the position of the particles are endorsed as the center of the pinholes on the PP plate. Second, the beamlets create circle-like spots on the scintillator; and the angle is determined by matching the associated pinholes to corresponding spots. Third, the light output assumed to be proportional to the intensity of the incident current so that the spot density is read off as charge. All in all, a MATLABmatlab program has been written to simulate PP emittance meter by reconstruction of the phase space using a multi-particle beam. In terms of design, a solid software is an inevitable necessity to simulate how the PP works. In one hand, since the radius of the pinhole as well as the pinhole to pinhole distance determine the spatial resolution, it is natural to ask pinholes to be many and tightly distributed. On the other hand, the smaller pinholes allow fewer particles which can be less than the cut-off current(CC) value. Besides, the closer they are, the more likely their spots on view screen would overlap. This phenomenon, called beamlet overlap, is the most problematic outcome of PP. We may avoid this problem up to a point by shortening the distance between PP plate and the view screen (). However, bigger values bring about better spatial spread, conclusively better angular resolution, yet the better spread of the particles on the screen means fewer particles incident into the unit area. This obligates us to rethink of the beamlet current if it is below the CC, again. This is why we have made the view screen movable on a rail such that we avoid beamlet overlap while keeping beamlet current above CC . Also, Monte Carlo simulations have been made to forecast possible errors may the movement of PP plate and view screen bring. It turns out that the horizontal movements would not have a substantial impact whereas an error in determination together with misalignment of PP plate and view screen cause ineligible results. After simulations, we conclude to manufacture the pinhole radius 50 µm (or less up to 40 µm) and distance between two adjacent pinholes as 2 mm. The distance() between PP plate and view screen is adjustable between 60-150 mm to be able to calculate emittance for our least and most divergent beam expectations from the ion source exition_source .
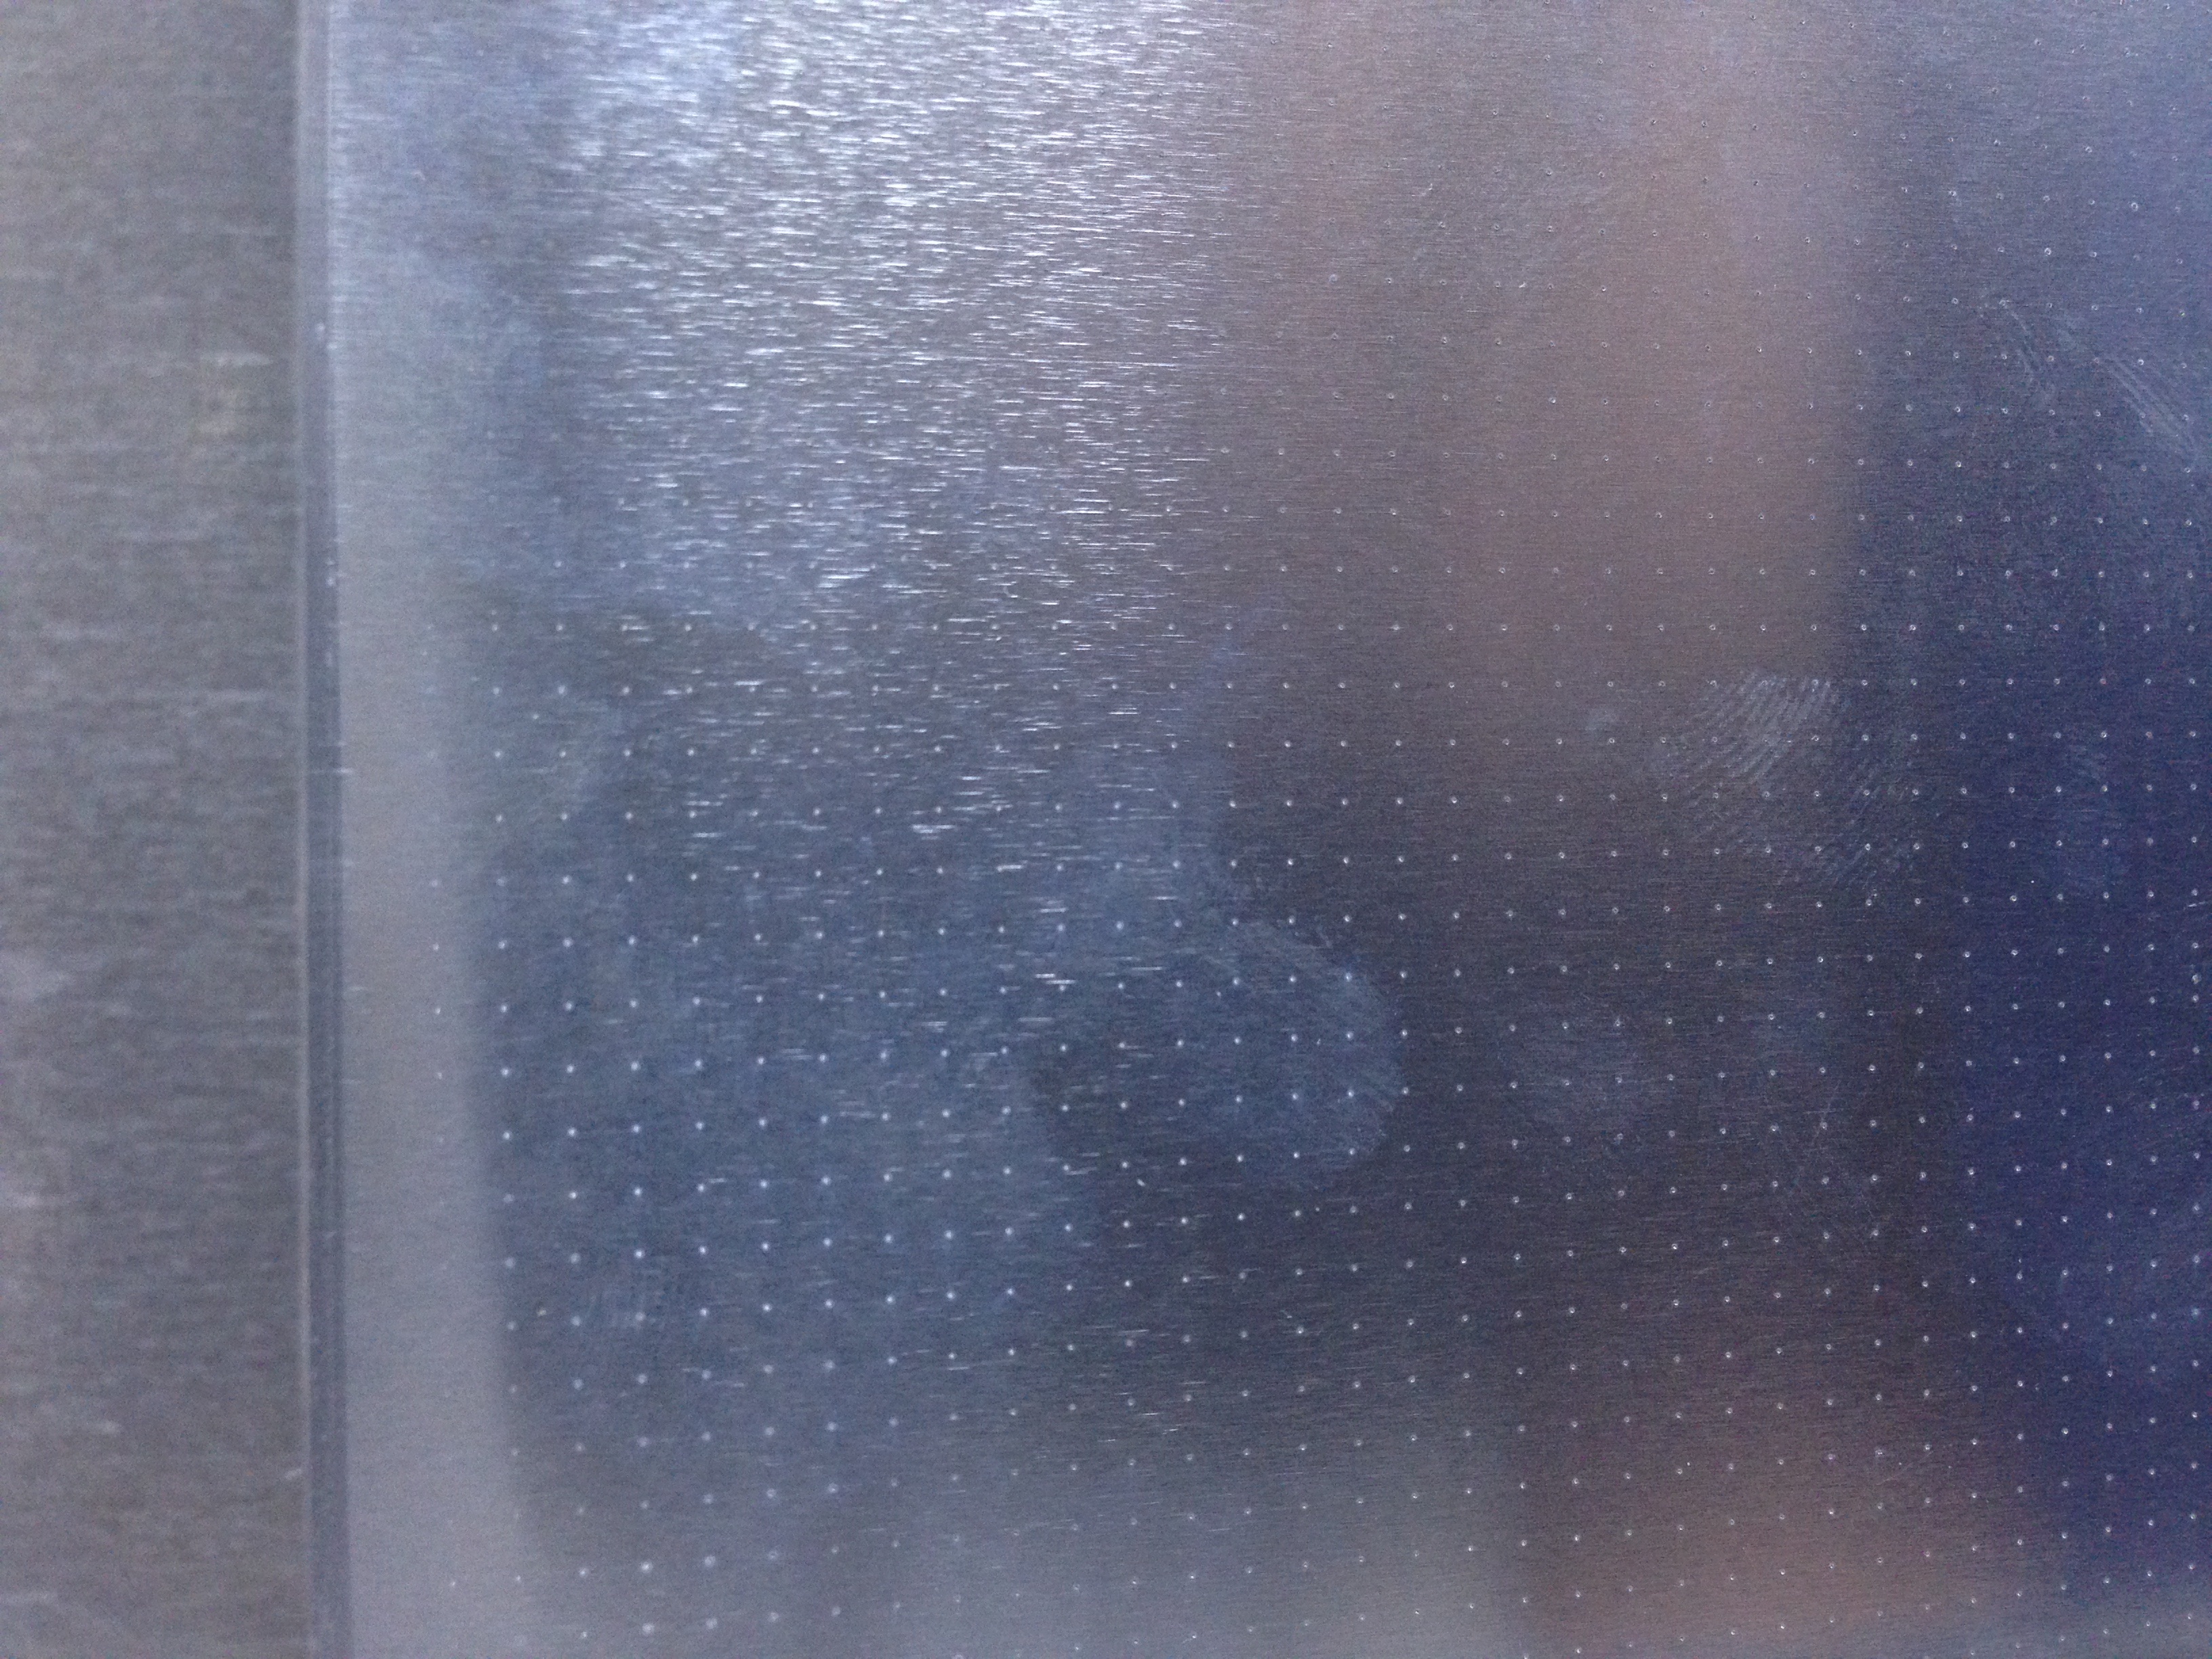
The PP plate, is produced by a local company specializing in fiber lasers in Ankara by drilling a thin plate with a femtosecond laser Fiberlast . The given design was to produce a cone like pinhole such that the laser would aim to drill in a diameter of 110 m and drill out from the other side of the plate with a diameter of about 100 m. Early trials have been made with aluminum due of its low cost and easiness to shape. The posterior plates are going to be built with Tungsten. Since Tungsten has low thermal expansion coefficient and high atomic number, these characteristics avoid thermal deformation and result in shorter passage of protons stockli . The manufactured PP plate is presented in Fig.11. The actual hole diameters are measured to be about 80-90 m. This is an acceptable deviation from the design since the smaller radii are already preferable in the PP Emittance Meter as long as current per unit area is above the CC value.
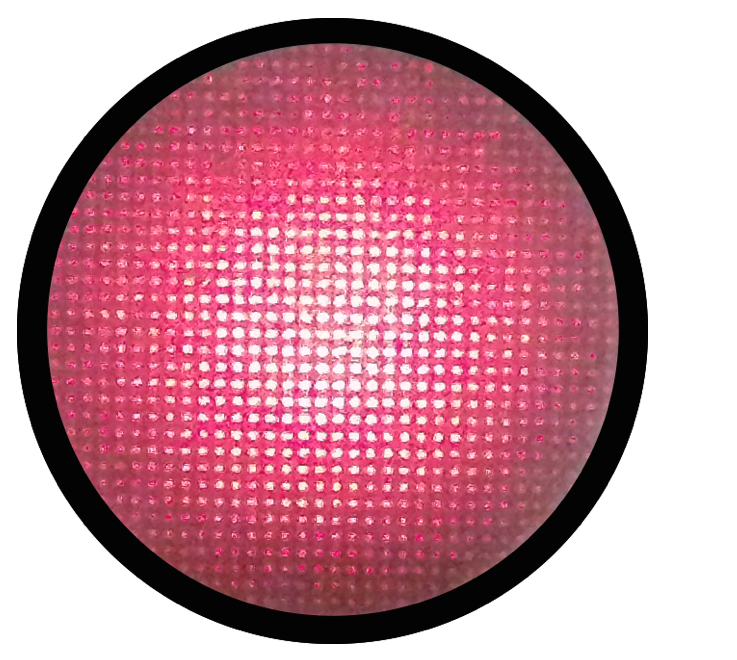
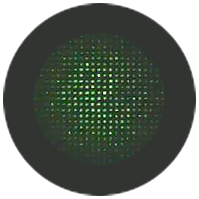
Apart from the simulation software, a data analysis software has been written in MATLAB, as well. The idea is similar to PP simulation software, yet Data Analysis code begins with reading the recorded image off and turning it into a matrix which its size is the pixels of the image. Since the intensity of the spot is assumed as the charge intensity, image is read off in gray-scale. To check data analysis code, a laser setup is prepared. A laser beam, diverged by a concave lens, is put through the PP plate and the beamlets are incident on the tracing paper. The image taken using an IMX145 SONY Exmor RS CMOS sensor with square pixels of width 1.5 m sensor is presented in figure 12.
| Exposure | |||
|---|---|---|---|
| High | 53.0 | 3.68 | -4.62 |
| As is | 51.4 | 3.91 | -4.60 |
| Low | 50.8 | 3.96 | -4.20 |
As a result, we conclude that the measured geometric emittance of the laser beam is , and Twiss parameters are and . The plot of the phase space is presented in figure 13. In fact, this calculated geometric emittance of the laser beam is comparable to the normalized emittance of a 20 keV proton beam, = , expected value at the TAEK-SANAEM’s proton beamline.
IV Assembly and Tests
The technical design drawings were submitted to the local companies for manufacturing and initial assembly kalitek . The final assembly of the outer box and the motion system was completed in the SPP laboratory. The measurement devices such as the scintillator screen and the pepper pot were installed inside the station and laser aligned to ensure the smallest possible angle with respect to the beam axis, thus the linearity of the system response. The scintillator material was Gd2O2S:Tb commonly known as P43 with a 545nm maximum emission wavelength and about 1ms decay time. The final product is shown in Fig.14 just before the closing of its top section. The beam moves from left to right, the driving motors can be seen at the bottom of the image. After the assembly, the first studies on the box were the vacuum tests.
The measurement box’s vacuum was initially provided by a TriScroll (Varian TS300) mechanical pump that allowed reaching mbar triscoll . At this pressure, vacuum leaks were searched using a helium leak detector, Varian Leak Detector BR15 leak , and mostly found at the joining edges of the box faces. These leaks were repaired with Torr Seal paste, qualified for mbar vacuum. Once the leaks were fixed, higher vacuum values were obtained using a turbo-molecular pump (Varian Navigator 551) turbo . The best vacuum value, mbar, was obtained with mechanical and turbo-molecular pumps working in tandem. The mechanisms like rails, endless gears are than installed into the MB allowing the motion of various detectors into and out of the beam. After initial degassing of these elements, the vacuum value at was about mbar.
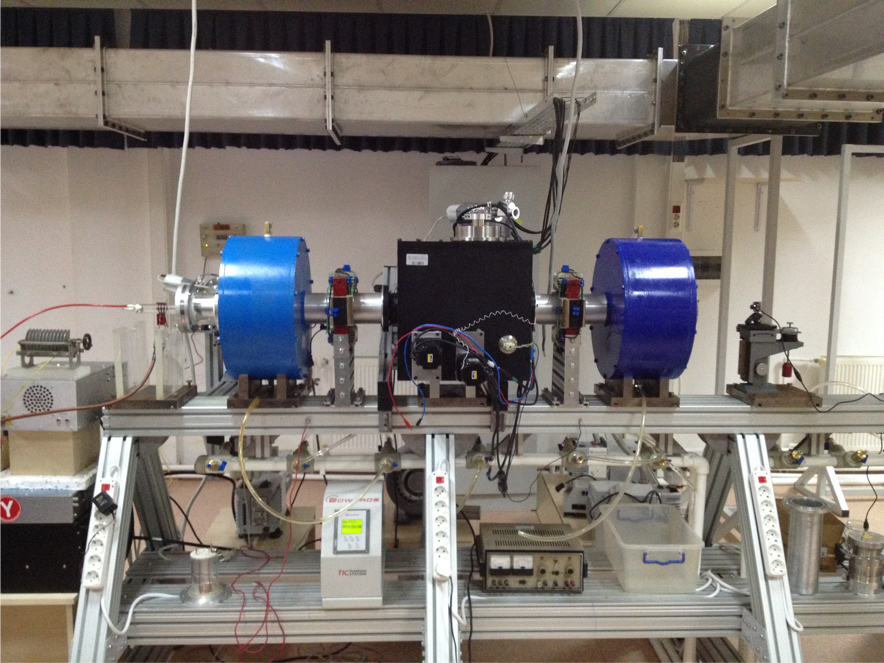
After ensuring satisfactory operation of the motors under vacuum conditions the measurement box was installed at the low energy section of the SPP beamline as shown in Fig.15. At this position i. e. after the first solenoid, the beam should be divergent, ideal for the emittance measurement with the PP method.
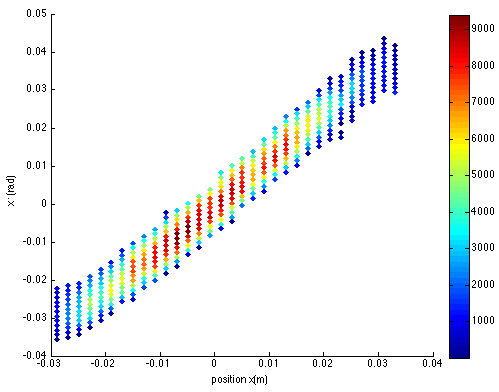
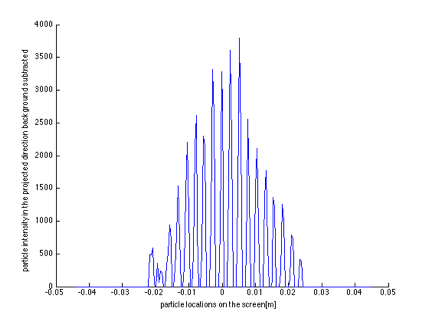
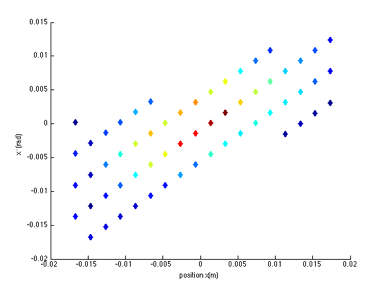
A beam test was also performed to measure the emittance of the SPP low energy proton beam. The beam profile in the horizontal direction after the PP plate can be seen in Fig.16 left side and its phase space analysis result on the same figure, right side. The beam emittance in both horizontal and vertical directions together with their Twiss parameters are also calculated and presented in Table 2.
| Horizontal | 0.1757 | 2.230 | -1.169 |
| Vertical | 0.1688 | 5.920 | -6.241 |
V Conclusions and Prospects
The diagnostics station is working as expected. It can measure the beam charge, profile and emittance. It can be used in other beamlines as well after minor adjustments. For a next version of the station, as an improvement, the vacuum shell could be produced in cylindrical form to improve pressure resistance.
Acknowledgments
This study is supported in part by the TAEK project under grant No. A4.H4.P1.
References
- (1) G. Turemen et. al, Proceedings of the 2nd International Beam Instrumentation Conference 2013, arXiv:1310.0790 [physics.acc-ph]
- (2) ANSYS® Academic Research, Release 16.2, Help System, Coupled Field Analysis Guide, ANSYS, Inc.
- (3) Hoffmann, W. Barth, P. Forck, A. Peters, P. Strehl, D. A. Liakin, Proc. 9th BIW 2000, Cambridge, USA, pp. 432-439.
- (4) Ostroumov, et al. Phys Rev ST-AB 12 010101 (2009) and Kondrashev, et al. PAC 2007.
- (5) S. Kondrashev, et al., Nucl. Instr. and Meth. A 606 (2009), 296-304.
- (6) A. Pikin, et al., Pepper pot emittance meter, BNL note C-A AP244, July 2006.
- (7) Marti, et al., 12th Intern. Cyc. Conf.
- (8) T. Kalvas, et. al., "IBSIMU: A three-dimensional simulation software for charged particle optics", Rev. Sci. Instrum. 81, 02B703, (2010).
- (9) MATLAB, version 8.3 (R2014a), The MathWorks Inc. Natick, Massachusetts 2014.
- (10) G. Turemen et. al, Proceedings of the 5th International Particle Accelerator Conference (IPAC’14), 15-20 June 2014, THPME050, p. 3338, arXiv:1406.3066 [physics.acc-ph]
- (11) FiberLAST, http://www.fiberlast.com.tr/eng/, FiberLAST, Inc., Ankara, Turkey, 2015.
- (12) Martin P. Stockli, Measuring and Analyzing the Transverse Emittance of Charged Particle Beams, Beam Instrumentation Workshop 2006.
- (13) Sony Corp. "Sensor Technologies", http://www.sony-semicon.co.jp/products_en/IS/sensor1/index.html
- (14) Kalitek, http://www.kalitek.net, Kalitek, Inc., Ostim, Ankara, Turkey.
- (15) Varian Inc. "Vacuum Technologies", http://ridl.cfd.rit.edu/products/manuals/Varian/TS300tipseal replacement manual.pdf
- (16) Varian Inc. "Vacuum Technologies", http://www.metrovac.eu/Publicacoes/assets/Varian leakdetect-catalog.pdf
- (17) Varian Inc. "Vacuum Technologies", http://accms04.physik.rwth-aachen.de/~chchung/ams/trd/tvt/turbo-catalog.pdf